subQuad
Below is a demonstration of the features of the subQuad function
Contents
- Syntax
- Description
- Examples
- Refining a 2D quadrilateral with boundary edges
- Refining a cube (3D closed mesh)
- Refining 3D quadrilateral surfaces with boundary edges
- Example: Subdividing in 1 direction by specifying splitMethod
- Example: Maintaining/resampling face data (e.g. face color)
- Example: Maintaining/resampling vertex data (e.g. vertex color)
- Example: Study vertex type
Syntax
[Fs,Vs]=subQuad(F,V,n,splitMethod);
Description
The subQuad function enables refinement of quadrangulated data. The quadrilateral faces defined by the patch format data F (faces) and V (vertices). Each face is split n times using the specified split method (splitMethod). The user may request the following outputs: The new faces: Fs The new coordinates: Vs Face color labels: C Nodal labels: CV
Four split methods are defined: 1: General linear resampling 2: Linear resampling only in the first direction 3: Linear resampling only in the second direction
Examples
clear; close all; clc;
Plot Settings
fontSize=15;
faceAlpha=1;
edgeColor=0.2*ones(1,3);
edgeWidth=1.5;
markerSize=35;
markerSize2=20;
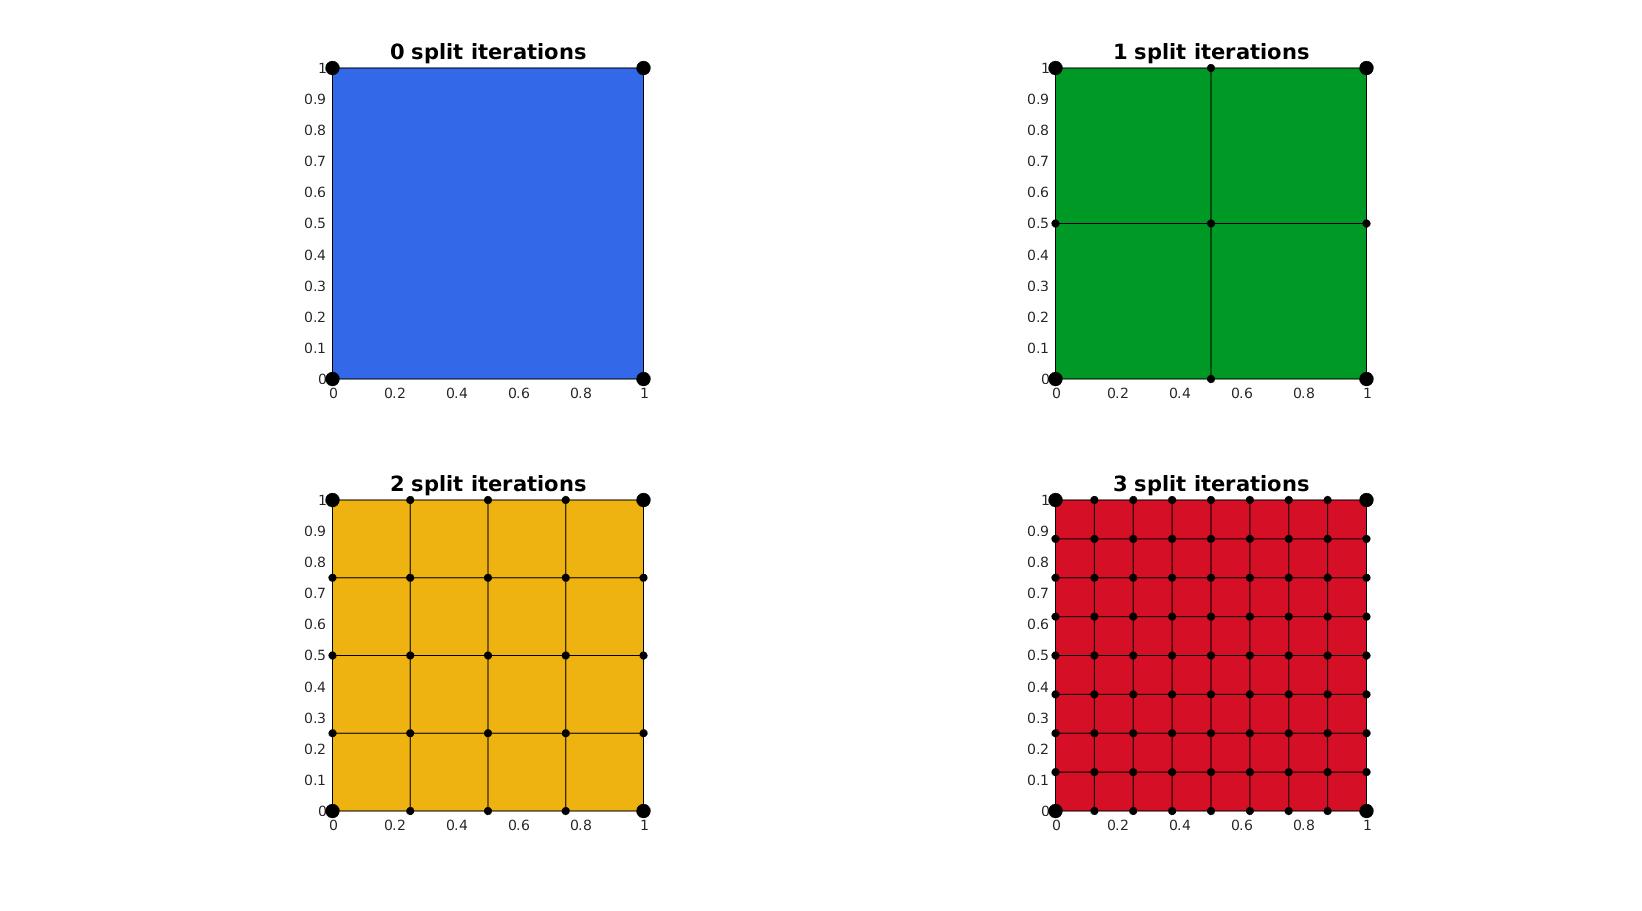
Refining a 2D quadrilateral with boundary edges
V=[0 0; 1 0; 1 1; 0 1];
F=[1 2 3 4];

n=0:1:3; %Number subdivision iterations
pColors=gjet(numel(n));

cFigure;
for q=1:1:numel(n)
    [Fs,Vs]=subQuad(F,V,n(q));
    subplot(2,2,q); hold on;
    title([num2str(n(q)),' split iterations'],'FontSize',fontSize);
    gpatch(Fs,Vs,pColors(q,:),'k');
    plotV(Vs,'k.','markerSize',markerSize2);
    plotV(V,'k.','markerSize',markerSize);

    axis equal; axis tight; view(2);
end
drawnow;

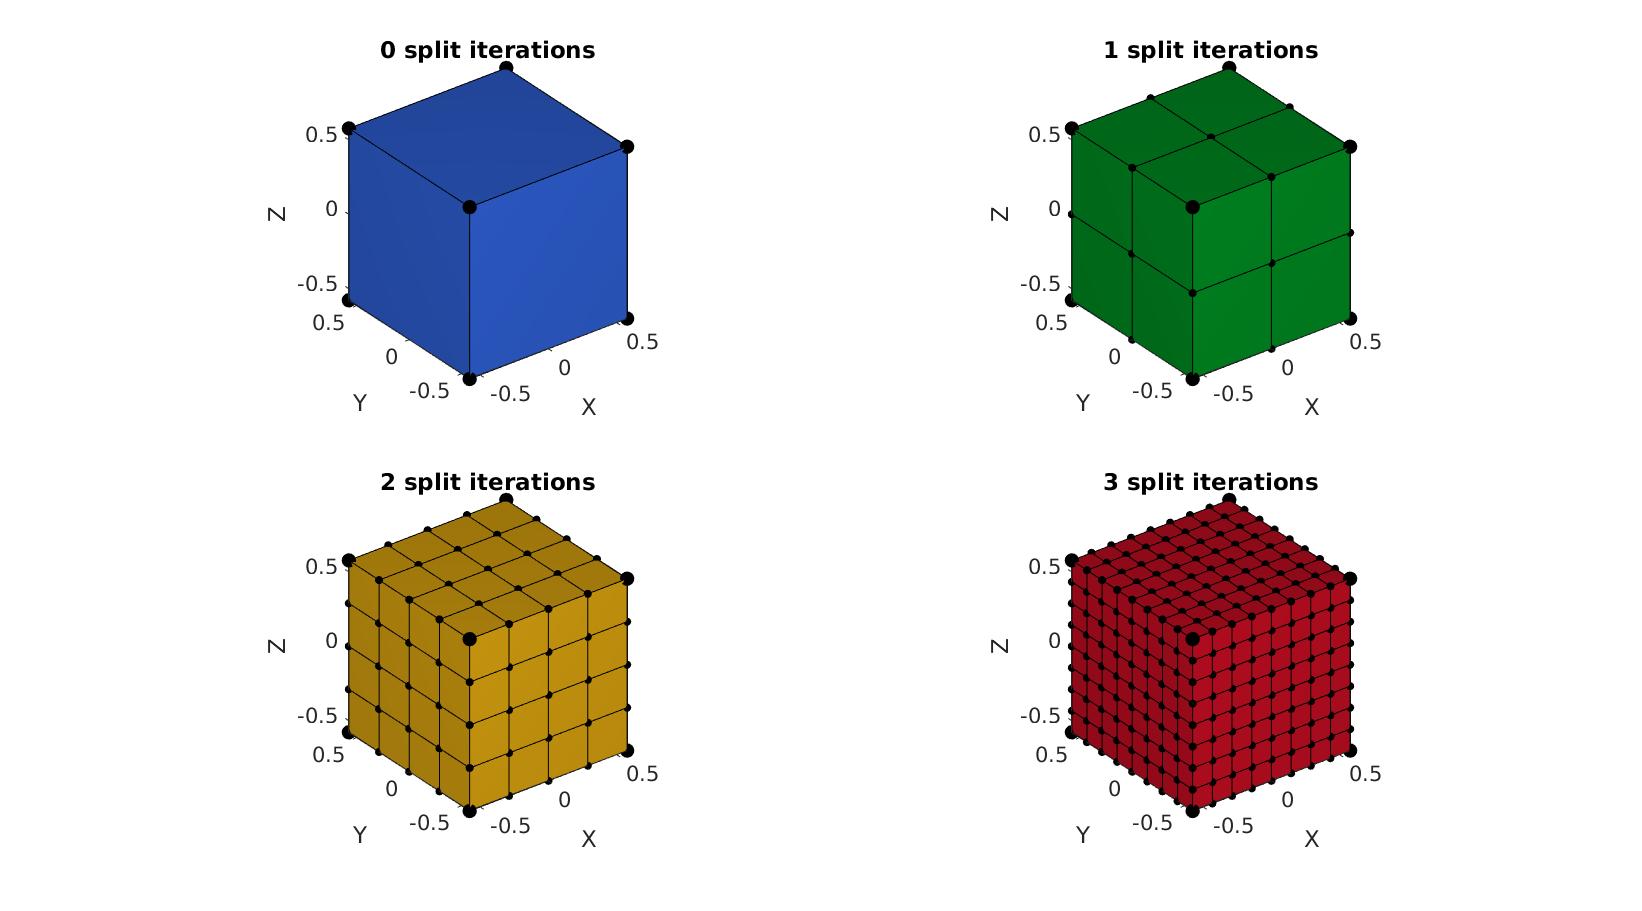
Refining a cube (3D closed mesh)
[V,F]=platonic_solid(2,1);

n=0:1:3; %Number subdivision iterations
pColors=gjet(numel(n));

cFigure;
for q=1:1:numel(n)
    [Fs,Vs]=subQuad(F,V,n(q));
    subplot(2,2,q); hold on;
    title([num2str(n(q)),' split iterations'],'FontSize',fontSize);
    gpatch(Fs,Vs,pColors(q,:),'k');
%     patchNormPlot(Fs,Vs);
    plotV(Vs,'k.','markerSize',markerSize2);
    plotV(V,'k.','markerSize',markerSize);
    axisGeom(gca,fontSize);
    camlight headlight;
end
drawnow;
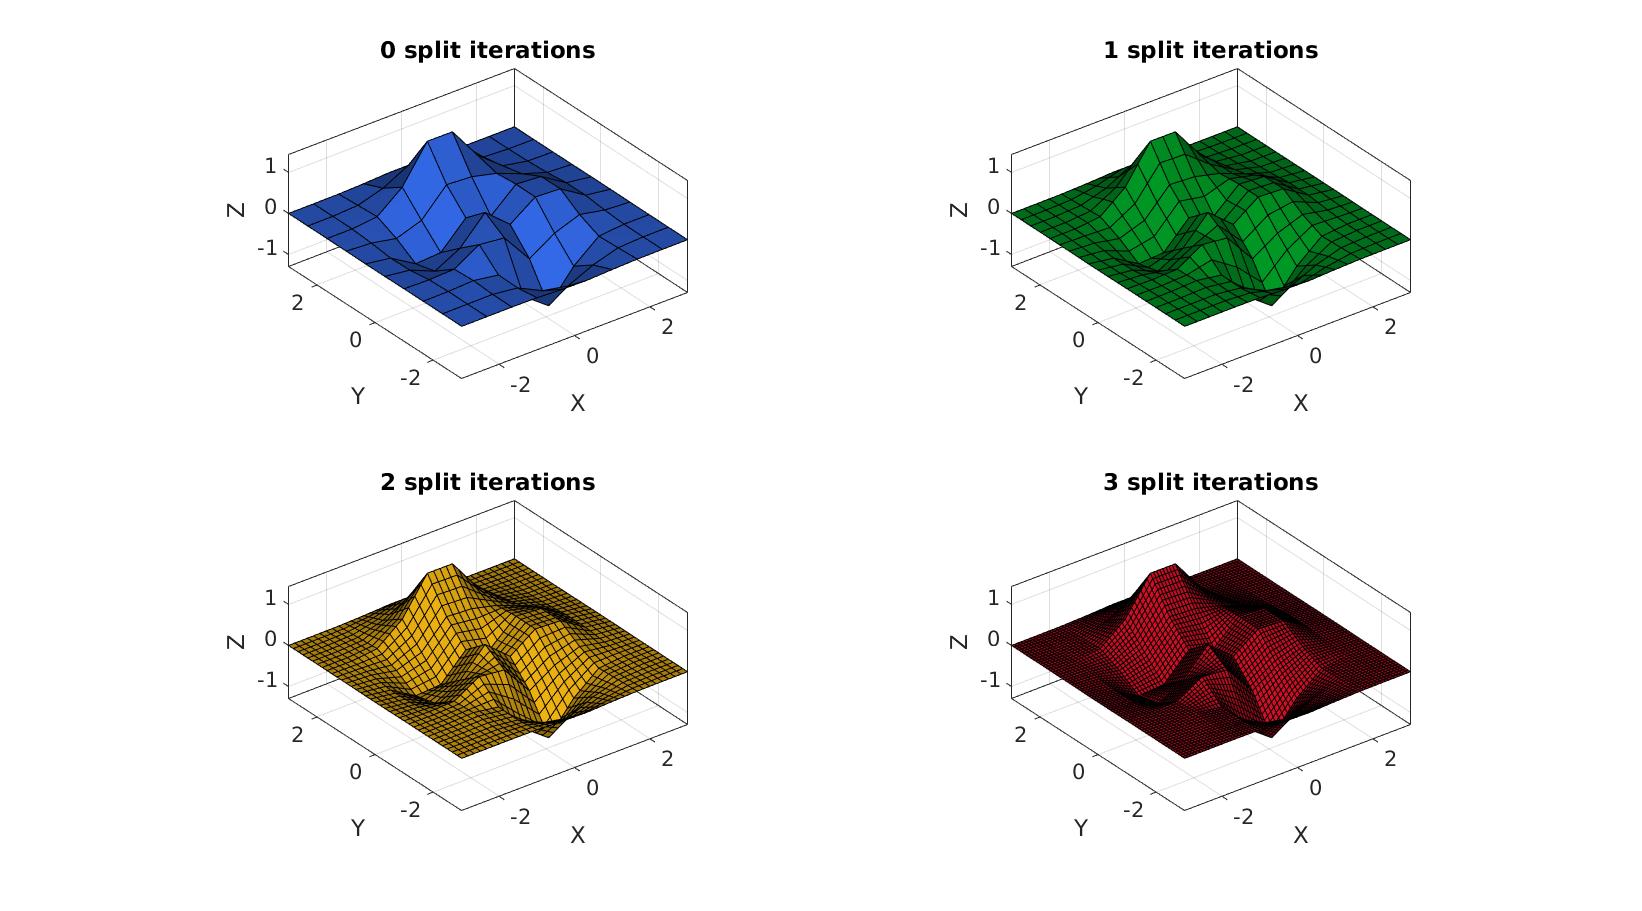
Refining 3D quadrilateral surfaces with boundary edges
[X,Y,Z]=peaks(10);
Z=Z/5;
[F,V]=surf2patch(X,Y,Z);

n=[0 1 2 3]; %Number of refinement steps

pColors=gjet(numel(n));

cFigure;
for q=1:1:numel(n)
    [Fs,Vs]=subQuad(F,V,n(q));
    subplot(2,2,q); hold on;
    title([num2str(n(q)),' split iterations'],'FontSize',fontSize);
    gpatch(Fs,Vs,pColors(q,:),'k');
%     patchNormPlot(Fs,Vs);
    axisGeom(gca,fontSize);
    camlight headlight;
end
drawnow;
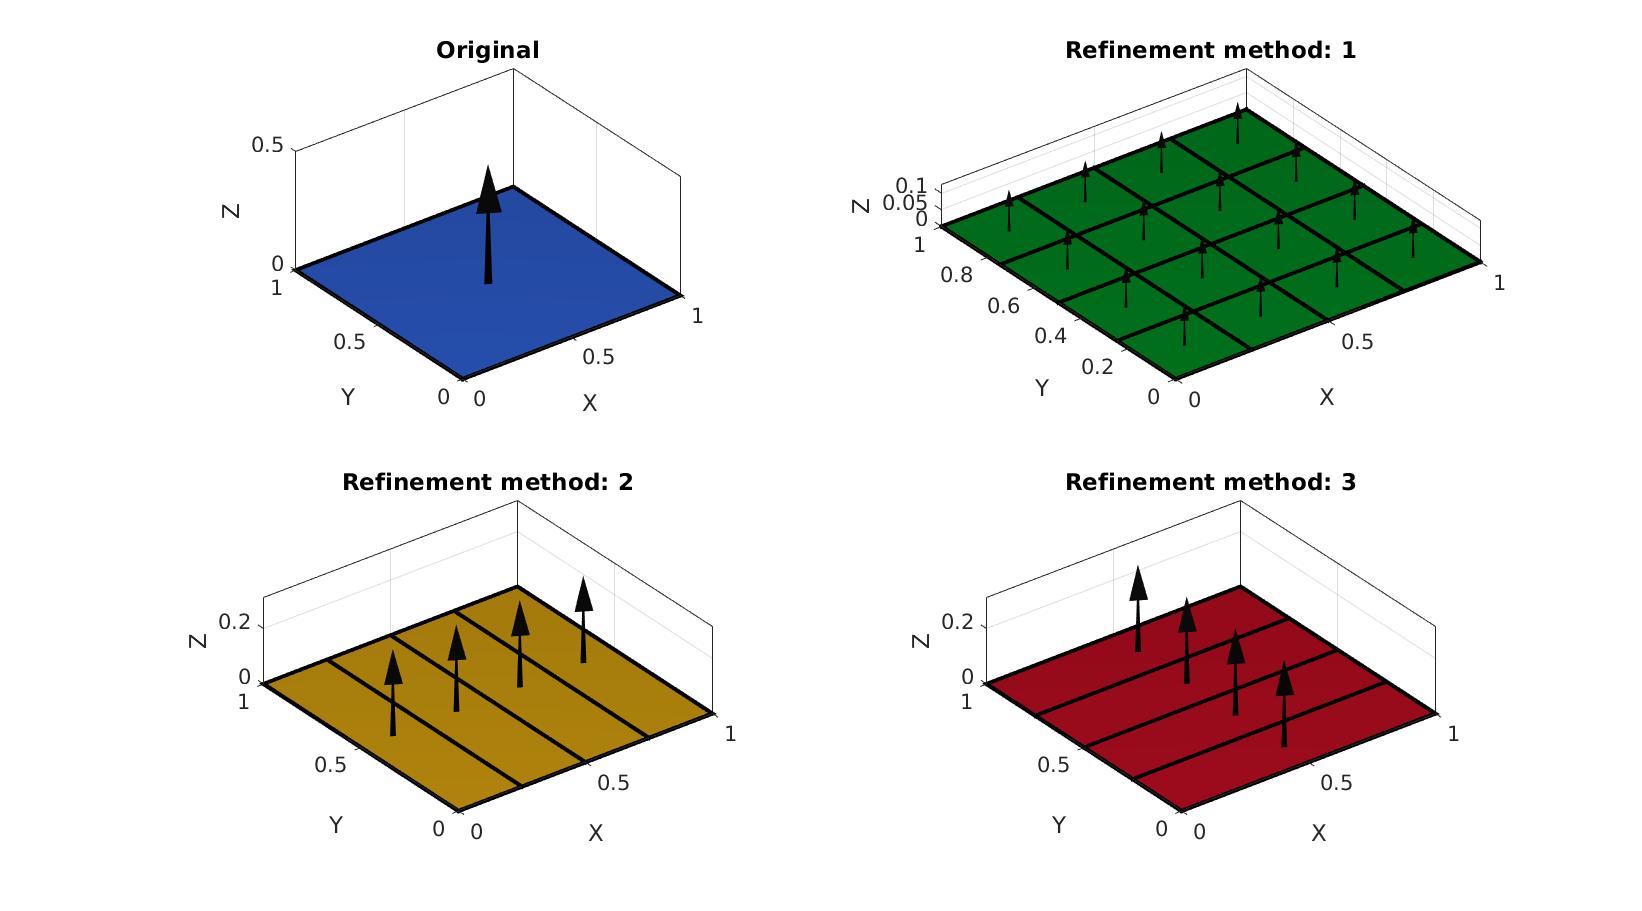
Example: Subdividing in 1 direction by specifying splitMethod
V=[0 0 0; 1 0 0; 1 1 0; 0 1 0];
F=[1 2 3 4];

pColors=gjet(4);

n=2;

cFigure;
subplot(2,2,1); hold on;
title('Original','FontSize',fontSize);
gpatch(F,V,pColors(1,:),'k',1,3);
patchNormPlot(F,V);
axisGeom(gca,fontSize);
camlight headlight;

for q=1:1:3
    splitMethod=q;
    [Fs,Vs]=subQuad(F,V,n,splitMethod);
    subplot(2,2,q+1); hold on;
    title(['Refinement method: ',num2str(q)],'FontSize',fontSize);
    gpatch(Fs,Vs,pColors(q+1,:),'k',1,3);
    patchNormPlot(Fs,Vs);
    axisGeom(gca,fontSize);
    camlight headlight;
%     view(2);
end
drawnow;
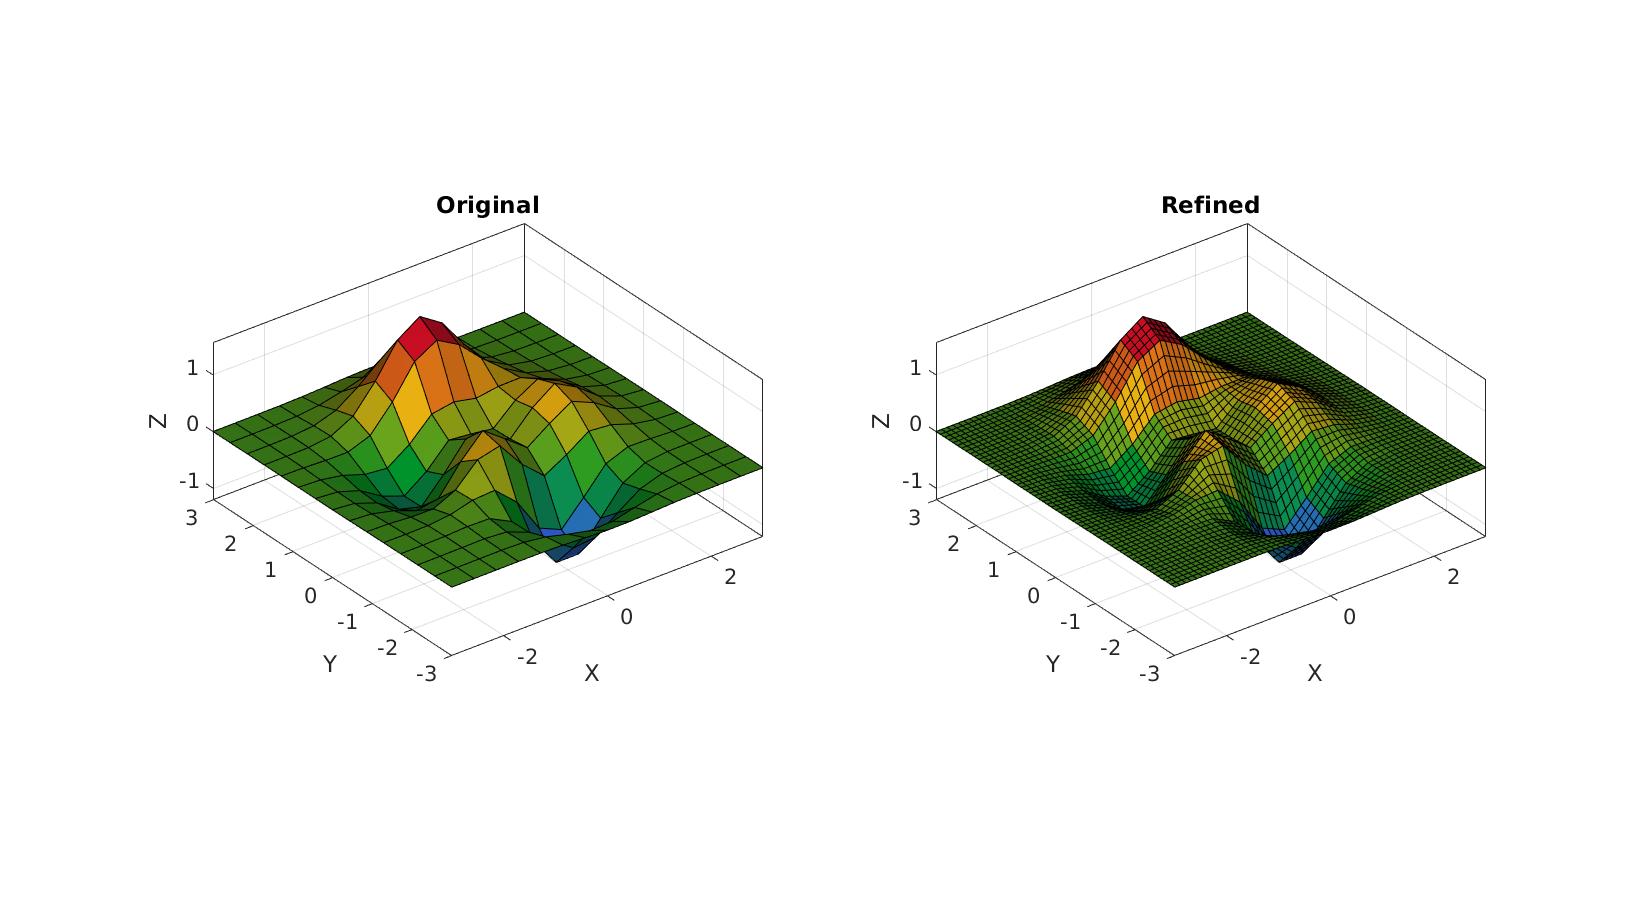
Example: Maintaining/resampling face data (e.g. face color)
[X,Y,Z]=peaks(15); Z=Z/5;
[F,V,CV]=surf2patch(X,Y,Z,Z);
C=vertexToFaceMeasure(F,CV);
Requesting additional output to allow for "book keeping" of face data
[Fs,Vs,Css]=subQuad(F,V,2,1);
The additional output Css contains face indices, i.e. each refined face in Fs belongs to an initial face in F and this mapping is defined in Css. Hence the following operation "picks" out the appropriate color data for each face from the original array.
Cs=C(Css); %Get colors for refined faces from color data of original
cFigure;
subplot(1,2,1); hold on;
title('Original','FontSize',fontSize);
gpatch(F,V,C,'k');
axisGeom(gca,fontSize);
colormap gjet;
camlight headlight;

subplot(1,2,2); hold on;
title('Refined','FontSize',fontSize);
gpatch(Fs,Vs,Cs,'k');
axisGeom(gca,fontSize);
colormap gjet;
camlight headlight;

drawnow;
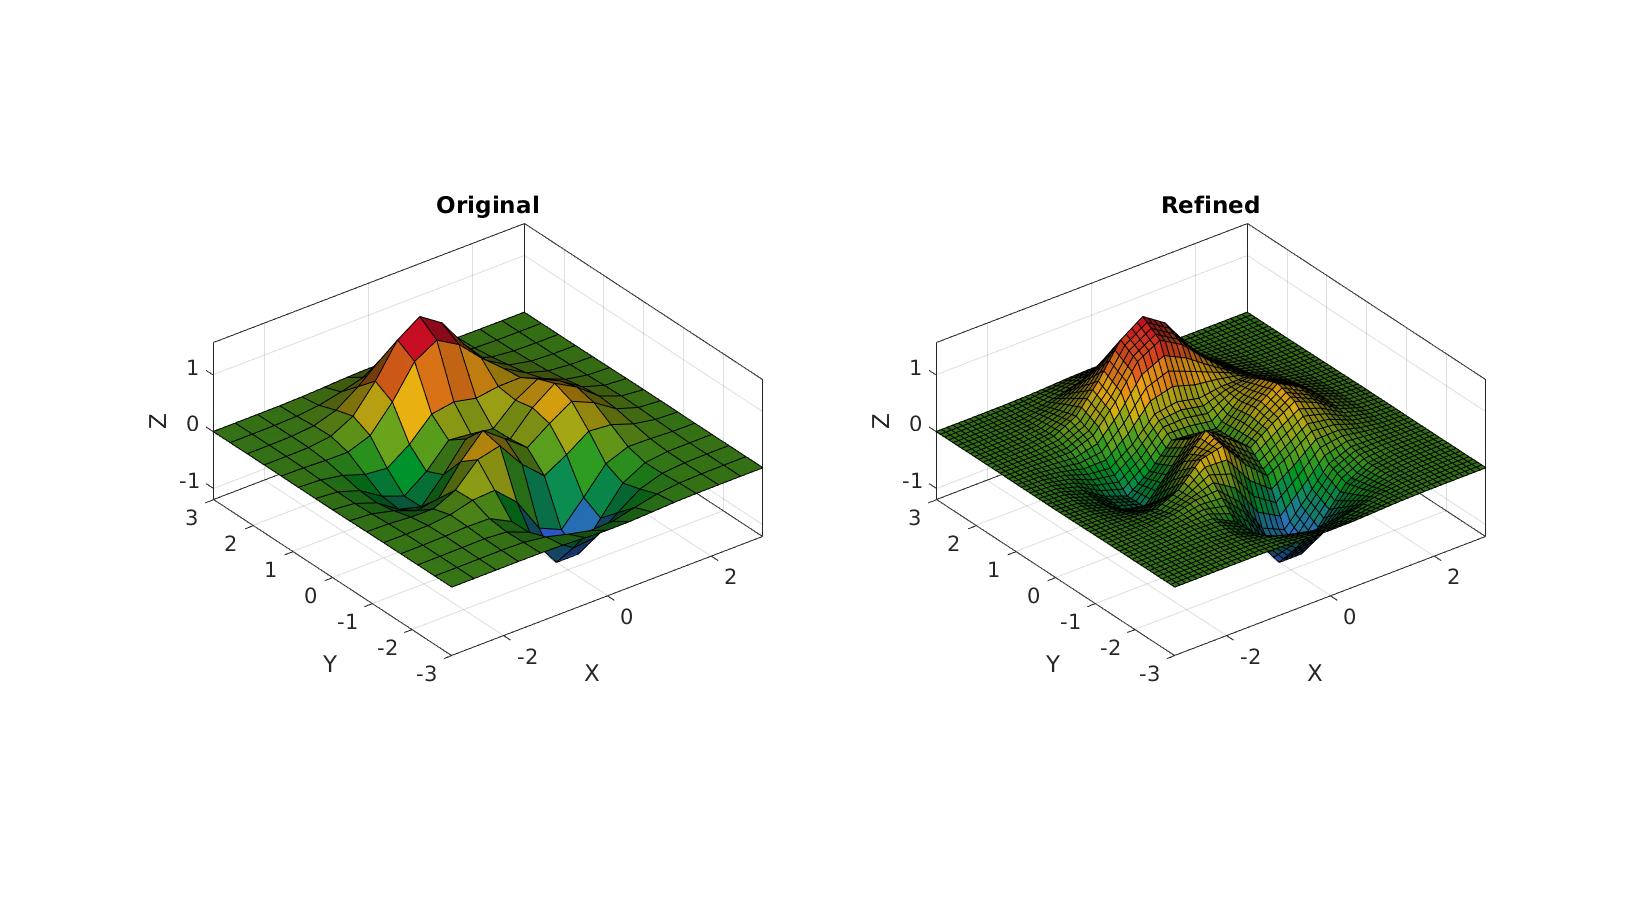
Example: Maintaining/resampling vertex data (e.g. vertex color)
Requesting additional output to allow for "book keeping" of face data
VI=[V CV]; %Append color as artificial additional coordinate
[Fs,VsI]=subQuad(F,VI,2,1); %Refinement
Vs=VsI(:,1:3); %Pick out coordinates from first 3 columns
CVs=VsI(:,4); %Pick out resampled vertex data from 4th column
cFigure;
subplot(1,2,1); hold on;
title('Original','FontSize',fontSize);
gpatch(F,V,C,'k');
axisGeom(gca,fontSize);
colormap gjet;
camlight headlight;

subplot(1,2,2); hold on;
title('Refined','FontSize',fontSize);
gpatch(Fs,Vs,CVs,'k');
axisGeom(gca,fontSize);
colormap gjet;
camlight headlight;

drawnow;
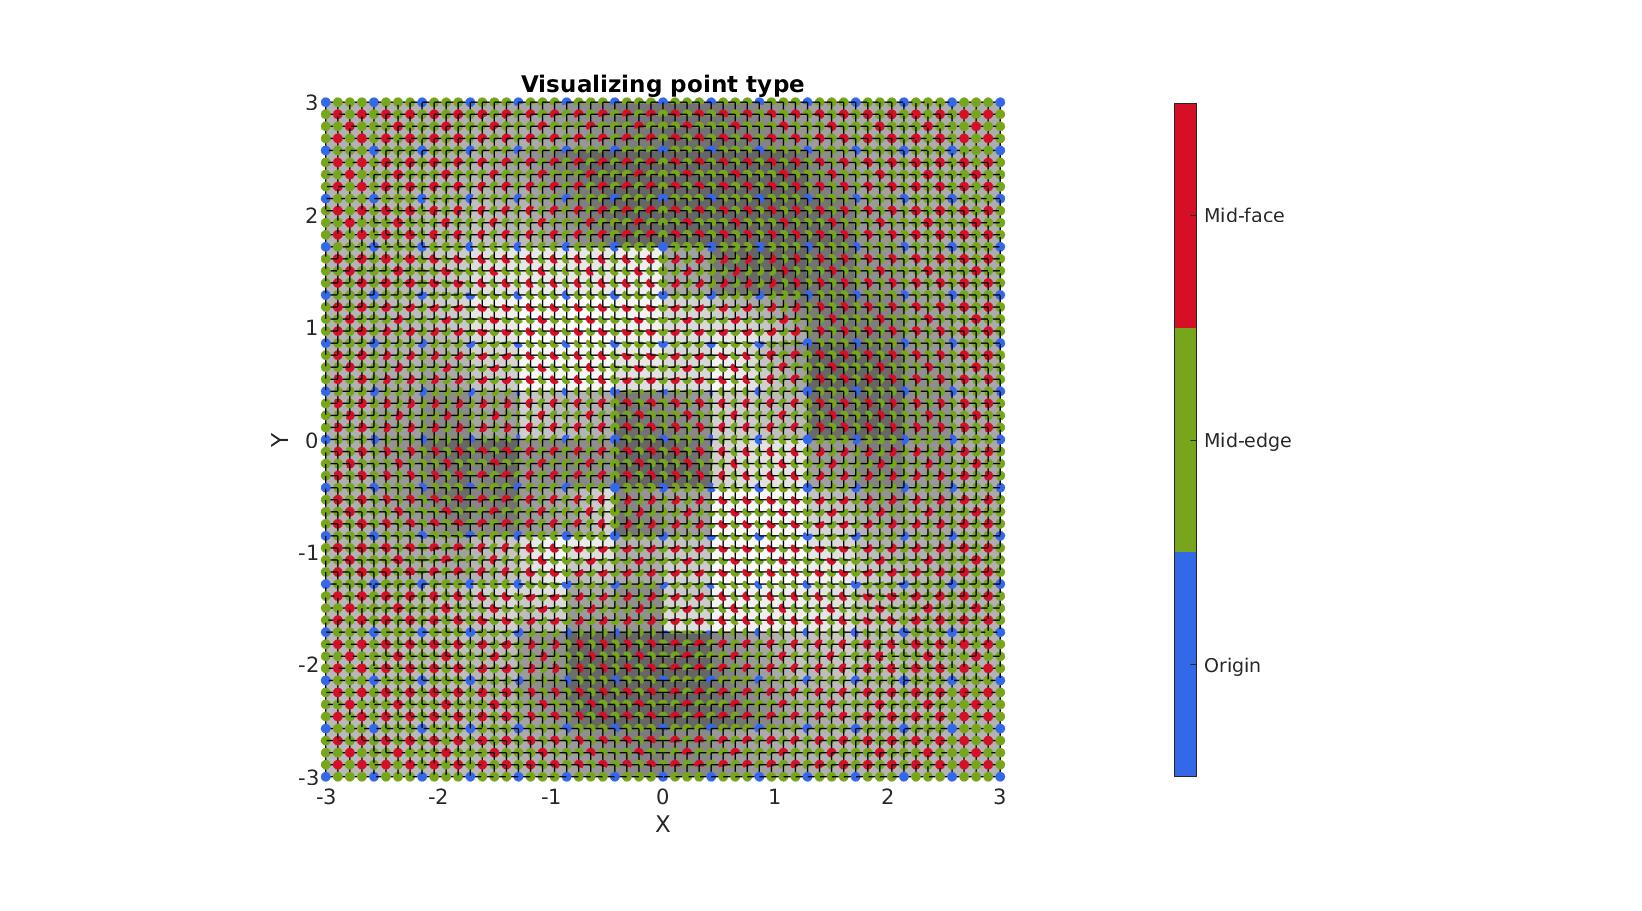
Example: Study vertex type
An optional 4th output can provide "vertex labels", these define the vertex origins, i.e. whether they stem from the initial coordinates (iteration 0), or from iteration n.
n=2; %Number of refinement steps
[Fs,Vs,~,CV]=subQuad(F,V,n,1);
cFigure; hold on;
title('Visualizing point type','FontSize',fontSize);
gpatch(Fs,Vs,'w','k',1,1);
scatterV(Vs,50,CV,'filled')
axisGeom(gca,fontSize); camlight headlight;
view(2);
colormap gjet; [~,hc]=icolorbar;
hc.TickLabels={'Origin';'Mid-edge';'Mid-face'};
drawnow;

GIBBON www.gibboncode.org
Kevin Mattheus Moerman, [email protected]
GIBBON footer text
License: https://github.com/gibbonCode/GIBBON/blob/master/LICENSE
GIBBON: The Geometry and Image-based Bioengineering add-On. A toolbox for image segmentation, image-based modeling, meshing, and finite element analysis.
Copyright (C) 2006-2021 Kevin Mattheus Moerman and the GIBBON contributors
This program is free software: you can redistribute it and/or modify it under the terms of the GNU General Public License as published by the Free Software Foundation, either version 3 of the License, or (at your option) any later version.
This program is distributed in the hope that it will be useful, but WITHOUT ANY WARRANTY; without even the implied warranty of MERCHANTABILITY or FITNESS FOR A PARTICULAR PURPOSE. See the GNU General Public License for more details.
You should have received a copy of the GNU General Public License along with this program. If not, see http://www.gnu.org/licenses/.