subCurve
Below is a demonstration of the features of the subCurve function
Contents
Syntax
[VN]=subCurve(Vt,np,closeLoopOpt);
Description
The subCurve function can be used to increase the point density of the input curve by adding evenly spaced points between each of the curve segments.
Examples
clear; close all; clc;
PLOT SETTINGS
fontSize=15;
markerSize1=45;
lineWidth1=2;
lineWidth2=5;
lineWidth3=2;
faceAlpha=0.5;
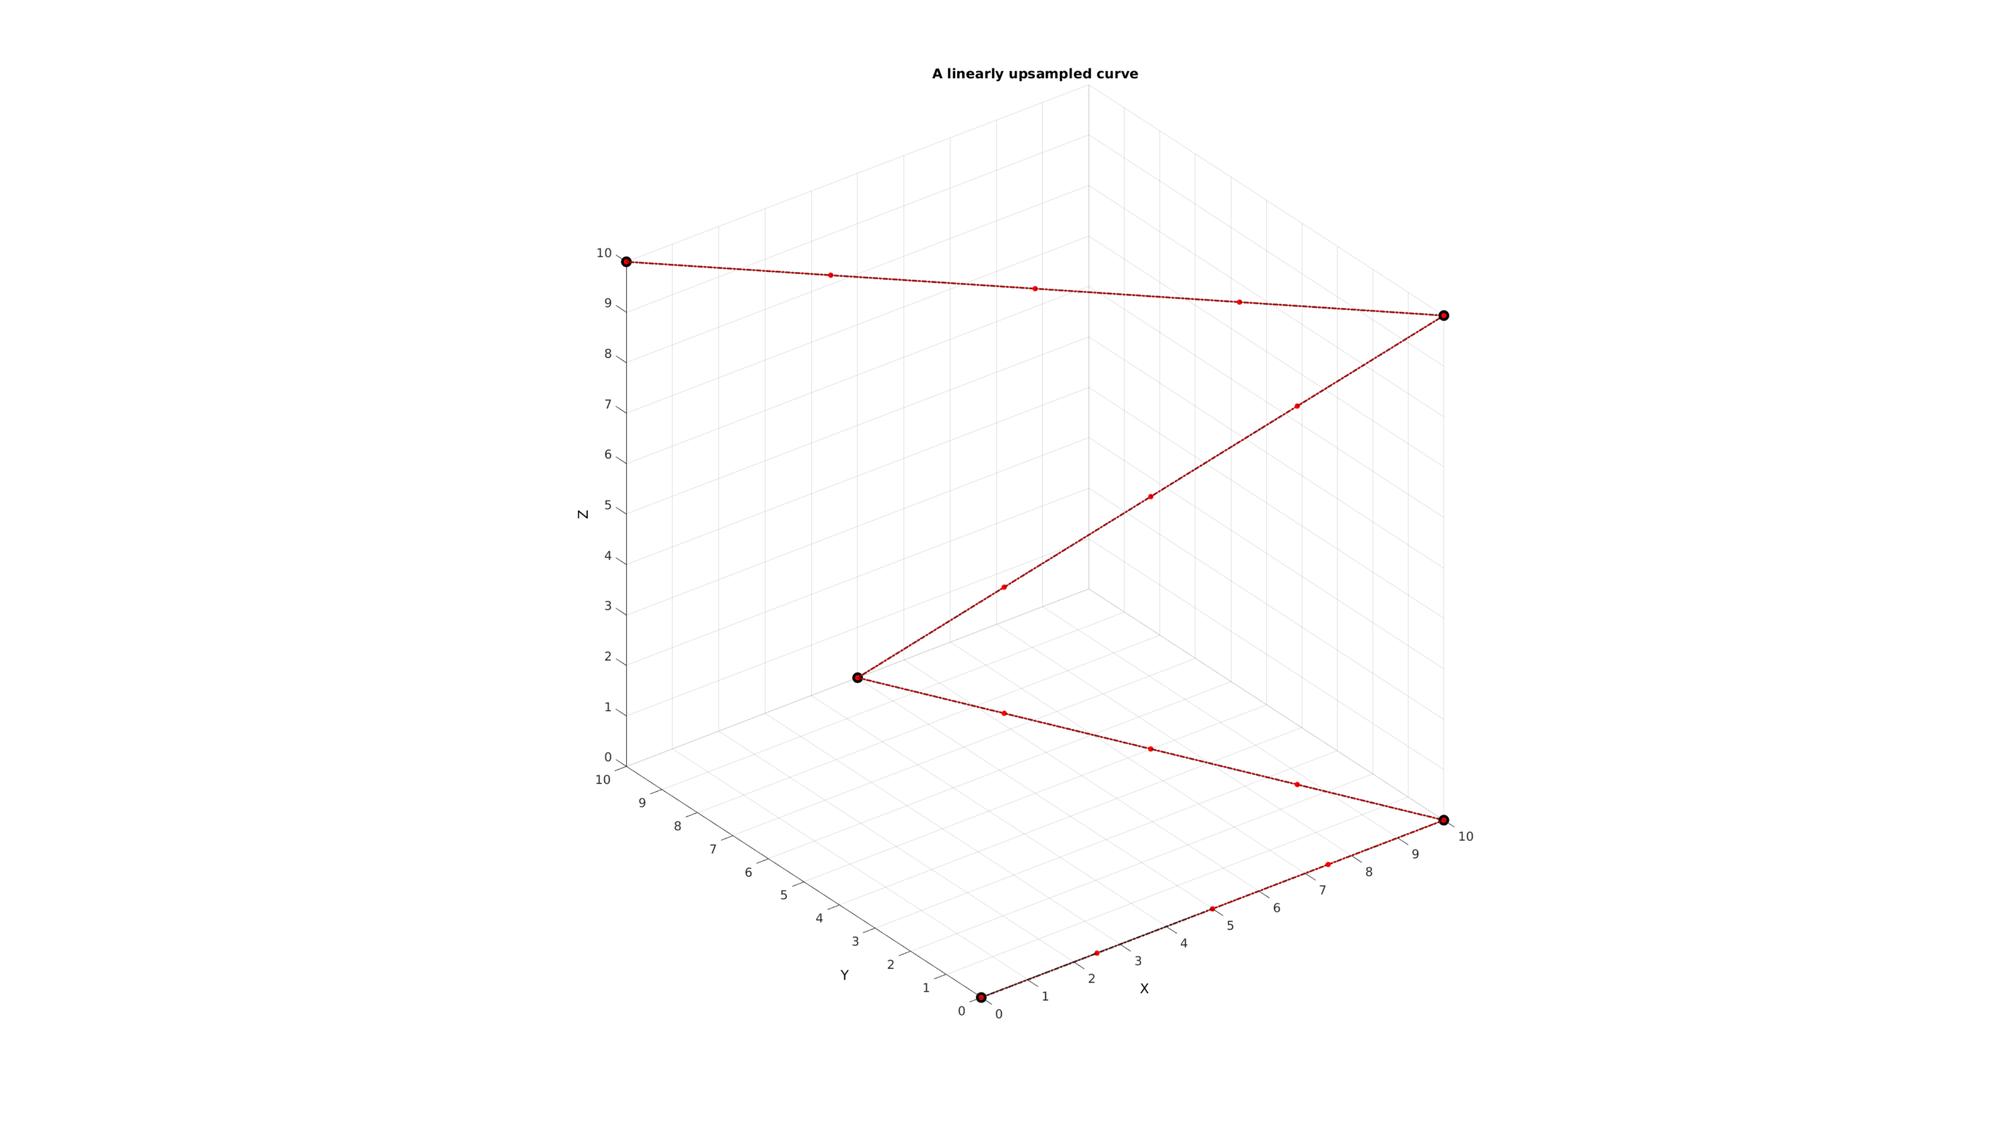
Example: Linearly upsample an open ended curve with intermediate points
Simulating a curve
Vt=[0 0 0; 10 0 0; 5 10 0; 10 0 10; 0 10 10; ];
Upsampling the curve
np=3; %Number of desired intermediate points to be added
[VN]=subCurve(Vt,np); %Using subcurve to upsample curve
Plotting results
hf1=cFigure;
title('A linearly upsampled curve','FontSize',fontSize);
xlabel('X','FontSize',fontSize);ylabel('Y','FontSize',fontSize); zlabel('Z','FontSize',fontSize);
hold on;

plotV(Vt,'k.-.','lineWidth',lineWidth1,'MarkerSize',markerSize1);
plotV(VN,'r.-','lineWidth',lineWidth1/2,'MarkerSize',markerSize1/2);

axis equal; view(3); axis tight;  grid on;  set(gca,'FontSize',fontSize);
drawnow;
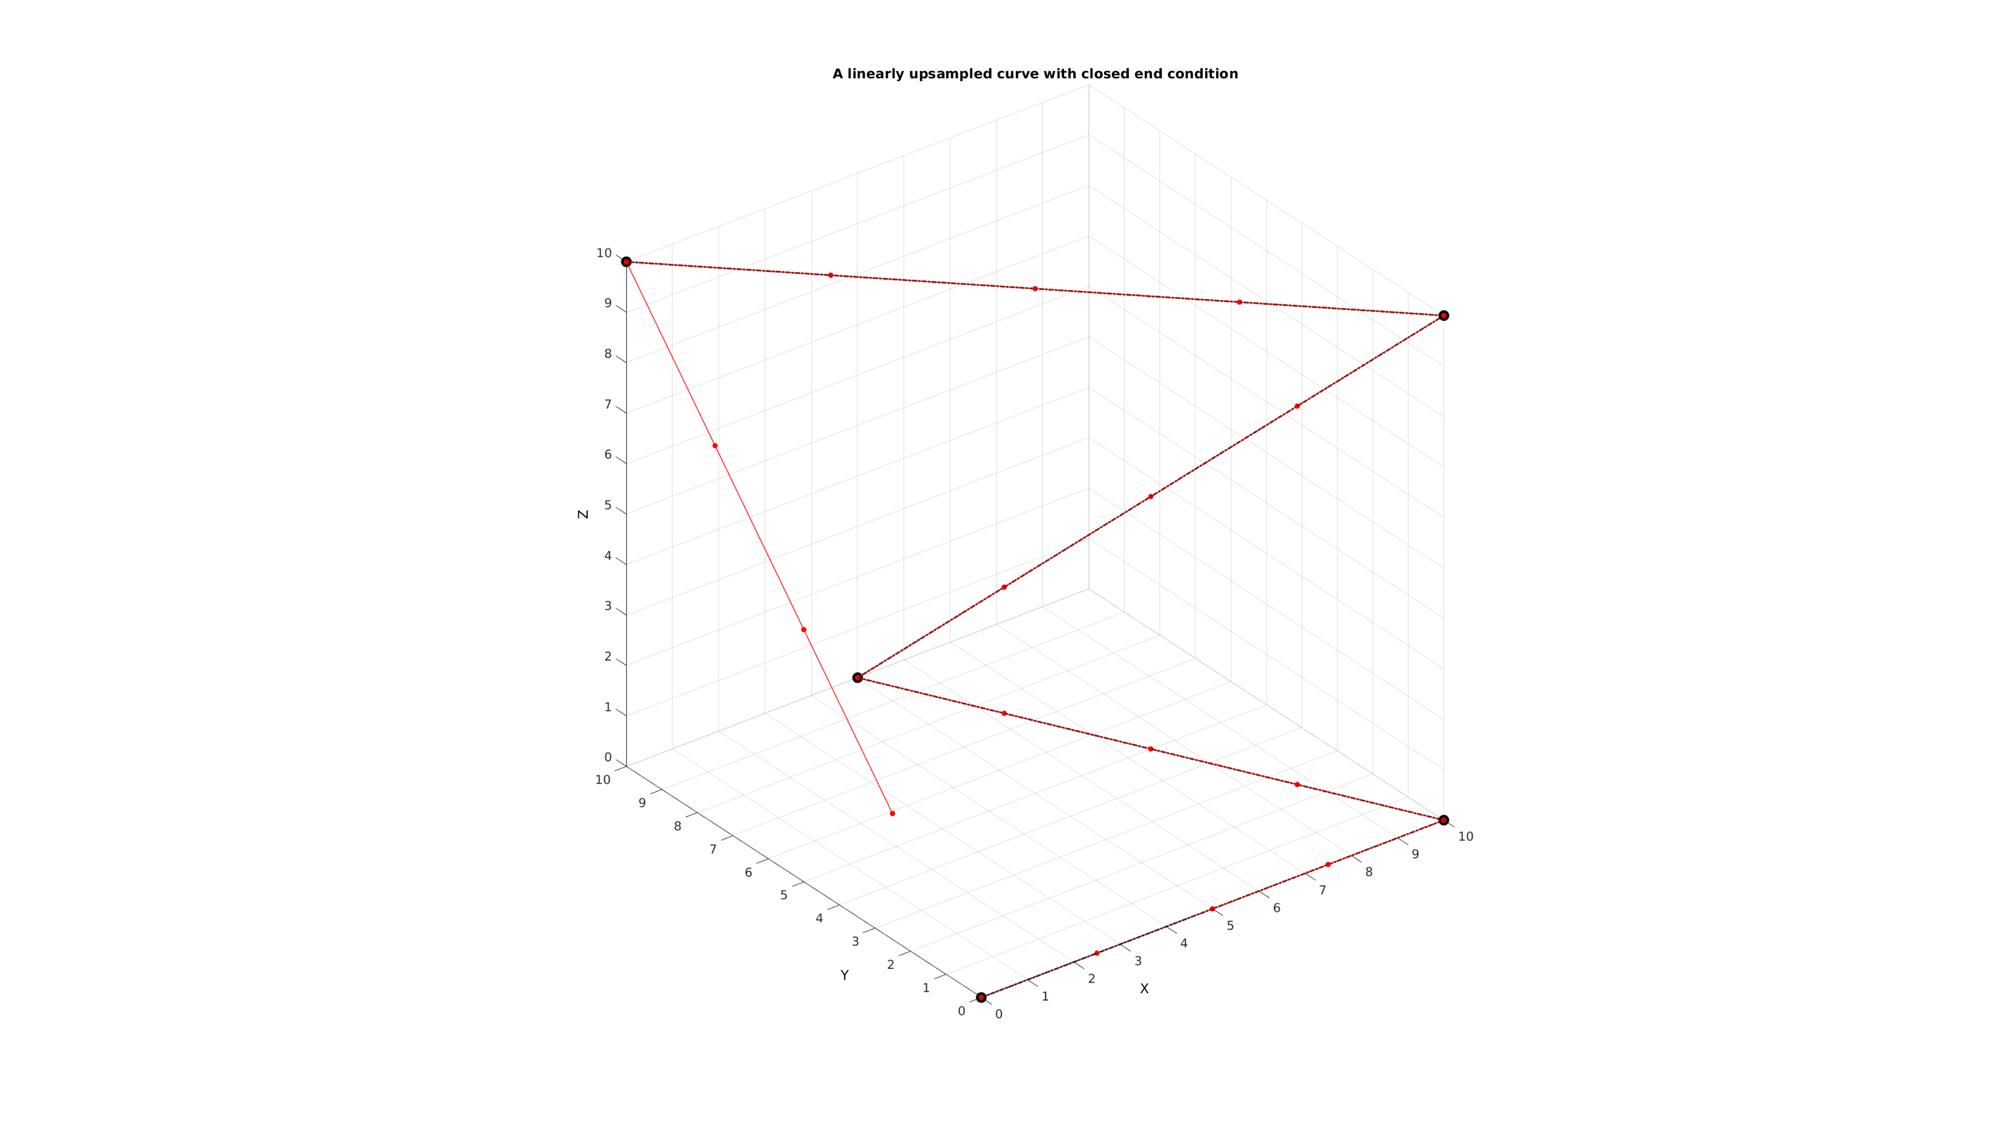
Example: Linearly upsample a closed curve with intermediate points
Upsampling the curve
np=3; %Number of desired intermediate points to be added
closeLoopOpt=1; %Enable closed loop option
[VN]=subCurve(Vt,np,closeLoopOpt); %Using subcurve to upsample curve
Plotting results
hf1=cFigure;
title('A linearly upsampled curve with closed end condition','FontSize',fontSize);
xlabel('X','FontSize',fontSize);ylabel('Y','FontSize',fontSize); zlabel('Z','FontSize',fontSize);
hold on;

plotV(Vt,'k.-.','lineWidth',lineWidth1,'MarkerSize',markerSize1);
plotV(VN,'r.-','lineWidth',lineWidth1/2,'MarkerSize',markerSize1/2);

axis equal; view(3); axis tight;  grid on;  set(gca,'FontSize',fontSize);
drawnow;

GIBBON www.gibboncode.org
Kevin Mattheus Moerman, [email protected]
GIBBON footer text
License: https://github.com/gibbonCode/GIBBON/blob/master/LICENSE
GIBBON: The Geometry and Image-based Bioengineering add-On. A toolbox for image segmentation, image-based modeling, meshing, and finite element analysis.
Copyright (C) 2019 Kevin Mattheus Moerman
This program is free software: you can redistribute it and/or modify it under the terms of the GNU General Public License as published by the Free Software Foundation, either version 3 of the License, or (at your option) any later version.
This program is distributed in the hope that it will be useful, but WITHOUT ANY WARRANTY; without even the implied warranty of MERCHANTABILITY or FITNESS FOR A PARTICULAR PURPOSE. See the GNU General Public License for more details.
You should have received a copy of the GNU General Public License along with this program. If not, see http://www.gnu.org/licenses/.