splitCurveSetMesh
Below is a demonstration of the features of the splitCurveSetMesh function
Contents
clear; close all; clc;
PLOT SETTINGS
fontSize=15;
faceAlpha1=1;
faceAlpha2=0.5;
edgeColor=0.25*ones(1,3);
edgeWidth=1.5;
markerSize1=50;
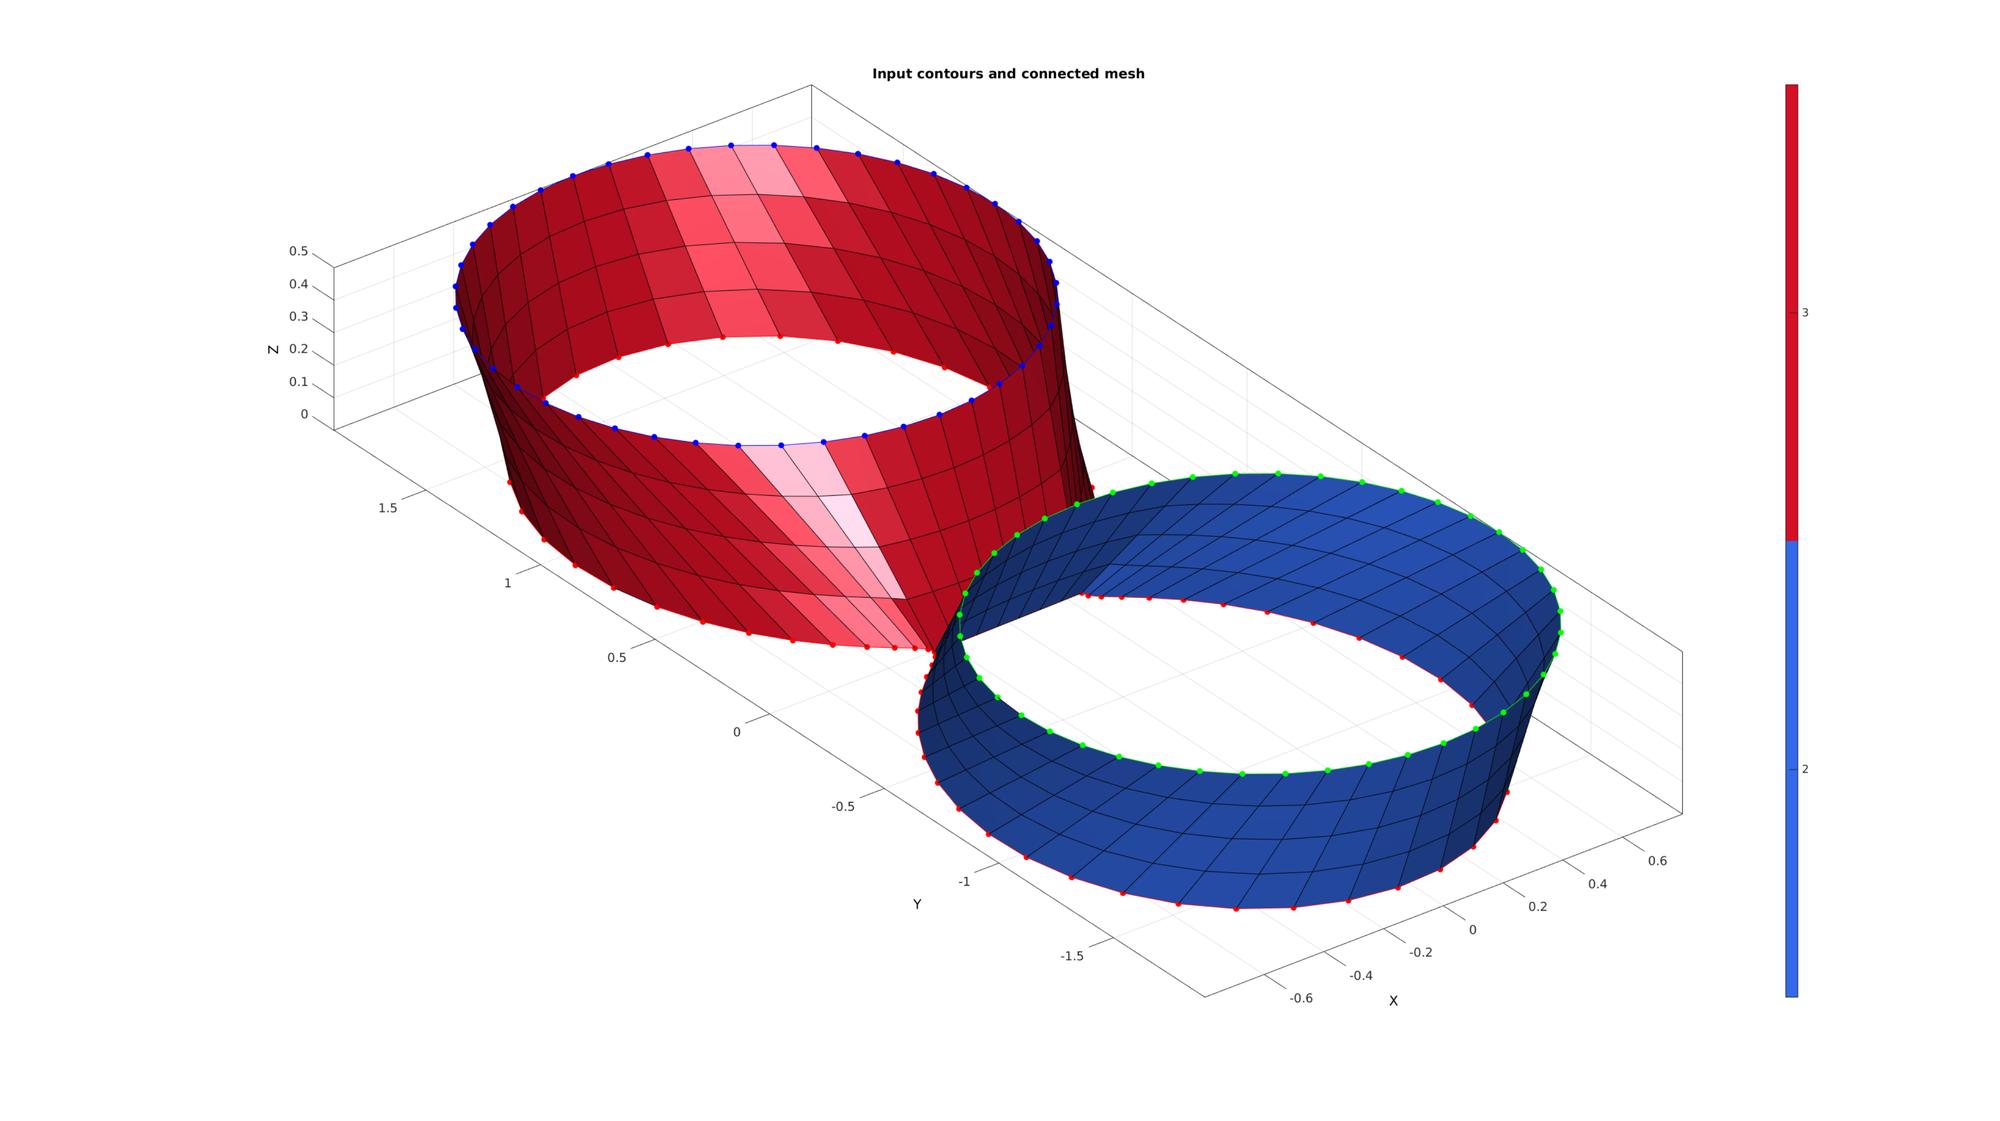
MESHING BIFURCATION BASED ON INPUT CURVES: from narrowed curve to split curves
Create example curves
t=linspace(0.25*pi,2.25*pi,75);
t=t(1:end-1);
x=sin(t(:));
y=cos(t(:));
[t,r] = cart2pol(x,y);
r=r-0.75*cos(2*t);
[x,y] = pol2cart(t,r);
z=zeros(size(x));
V1=[x(:) y(:) z(:)];

t=linspace(0,2*pi,135);
r2=0.8;
x=r2.*sin(t);
y=r2.*cos(t);
z=0.5*ones(size(x));
V2=[x(:) y(:) z(:)];
V2=V2(1:end-1,:);

V2(:,1)=V2(:,1);
V2(:,2)=V2(:,2)-1.1;

V3=V2;
V3(:,1)=V3(:,1);
V3(:,2)=V3(:,2)+2.2;
ns=5;
V_cell={V1,V2,V3};
patchType='quad';
smoothPar.Method='HC';
smoothPar.n=0;
smoothPar.Tolerance=0.001;
switch smoothPar.Method
    case 'HC'
        smoothPar.Alpa=0.1; %Alpha scale factor to push points back to original
        smoothPar.Beta=0.5; %Beta
    case 'LAP'
        smoothPar.LambdaSmooth=0.25;
end
splitMethod='nearMid';
Meshing bifurcation
[F,V,curveIndices,faceMarker]=splitCurveSetMesh(V_cell,ns,patchType,smoothPar,splitMethod);
% Plotting results
cFigure; hold on;
title('Input contours and connected mesh','FontSize',fontSize);
gpatch(F,V,faceMarker);
plotV(V(curveIndices{1},:),'r.-','MarkerSize',25);
plotV(V(curveIndices{2},:),'g.-','MarkerSize',25);
plotV(V(curveIndices{3},:),'b.-','MarkerSize',25);
axisGeom(gca,fontSize);
colormap gjet; icolorbar;
camlight headlight;
drawnow;
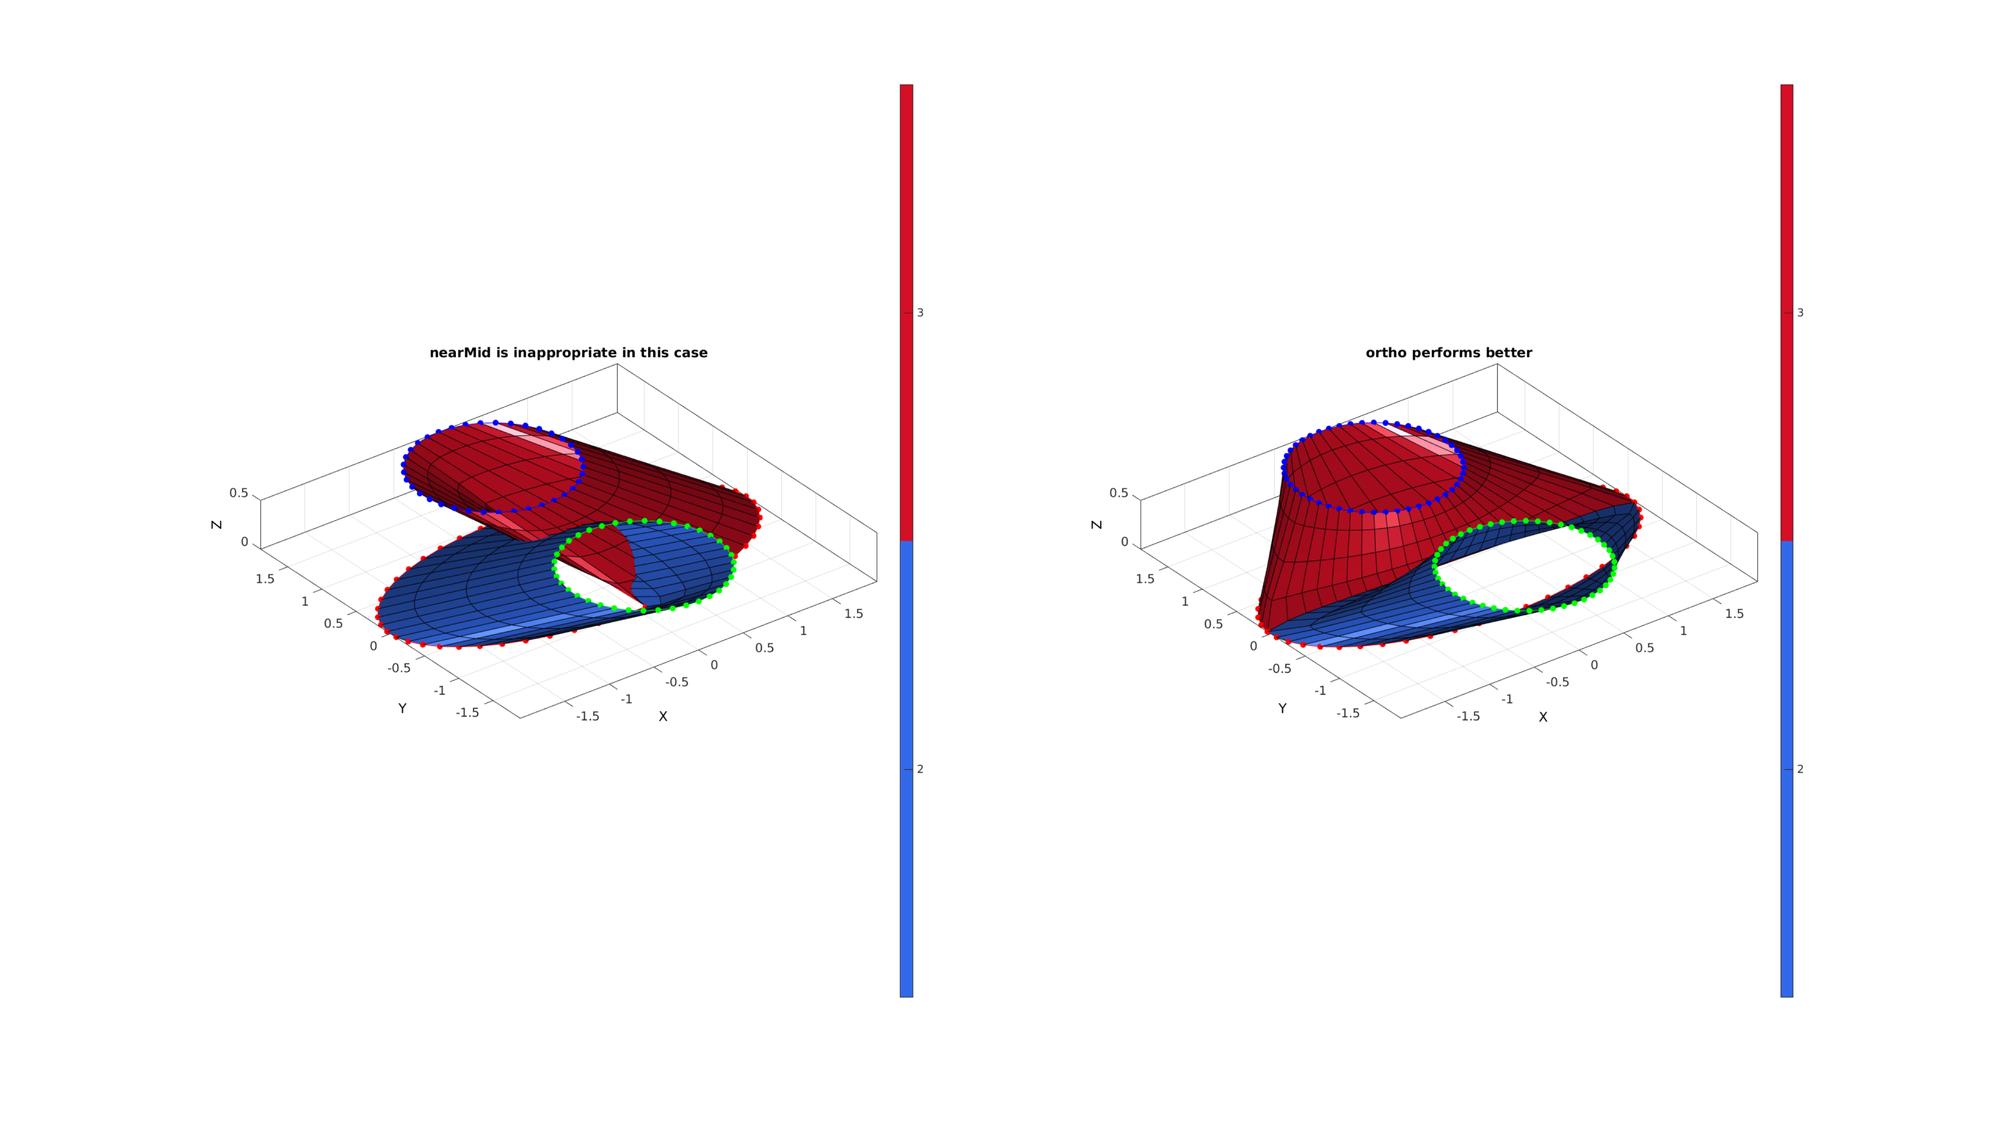
MESHING BIFURCATION BASED ON INPUT CURVES: from ellips curve to split curves
Create example curves
t=linspace(0.25*pi,2.25*pi,50);
t=t(1:end-1);
x=2*sin(t(:));
y=cos(t(:));
z=zeros(size(x));
V1=[x(:) y(:) z(:)];

t=linspace(0,2*pi,25);
r2=0.8;
x=r2.*sin(t);
y=r2.*cos(t);
z=0.5*ones(size(x));
V2=[x(:) y(:) z(:)];
V2=V2(1:end-1,:);

V2(:,1)=V2(:,1);
V2(:,2)=V2(:,2)-1.1;

V3=V2;
V3(:,1)=V3(:,1);
V3(:,2)=V3(:,2)+2.2;
ns=5;
V_cell={V1,V2,V3};
patchType='quad';
smoothPar.Method='HC';
smoothPar.n=250;
smoothPar.Tolerance=0.001;
switch smoothPar.Method
    case 'HC'
        smoothPar.Alpa=0.1; %Alpha scale factor to push points back to original
        smoothPar.Beta=0.5; %Beta
    case 'LAP'
        smoothPar.LambdaSmooth=0.25;
end
splitMethod='nearMid';
Meshing bifurcation
[F_1,V_1,curveIndices_1,faceMarker_1]=splitCurveSetMesh(V_cell,ns,patchType,smoothPar,'nearMid');
[F_2,V_2,curveIndices_2,faceMarker_2]=splitCurveSetMesh(V_cell,ns,patchType,smoothPar,'ortho');
% Plotting results

subplot(1,2,1); hold on;
title('nearMid is inappropriate in this case','FontSize',fontSize);
gpatch(F_1,V_1,faceMarker_1);
plotV(V_1(curveIndices_1{1},:),'r.-','MarkerSize',25);
plotV(V_1(curveIndices_1{2},:),'g.-','MarkerSize',25);
plotV(V_1(curveIndices_1{3},:),'b.-','MarkerSize',25);
axisGeom(gca,fontSize);
colormap(gca,gjet(2)); icolorbar;
camlight headlight;

subplot(1,2,2); hold on;
title('ortho performs better','FontSize',fontSize);
gpatch(F_2,V_2,faceMarker_2);
plotV(V_2(curveIndices_2{1},:),'r.-','MarkerSize',25);
plotV(V_2(curveIndices_2{2},:),'g.-','MarkerSize',25);
plotV(V_2(curveIndices_2{3},:),'b.-','MarkerSize',25);
axisGeom(gca,fontSize);
colormap(gca,gjet(2)); icolorbar;
camlight headlight;
drawnow;
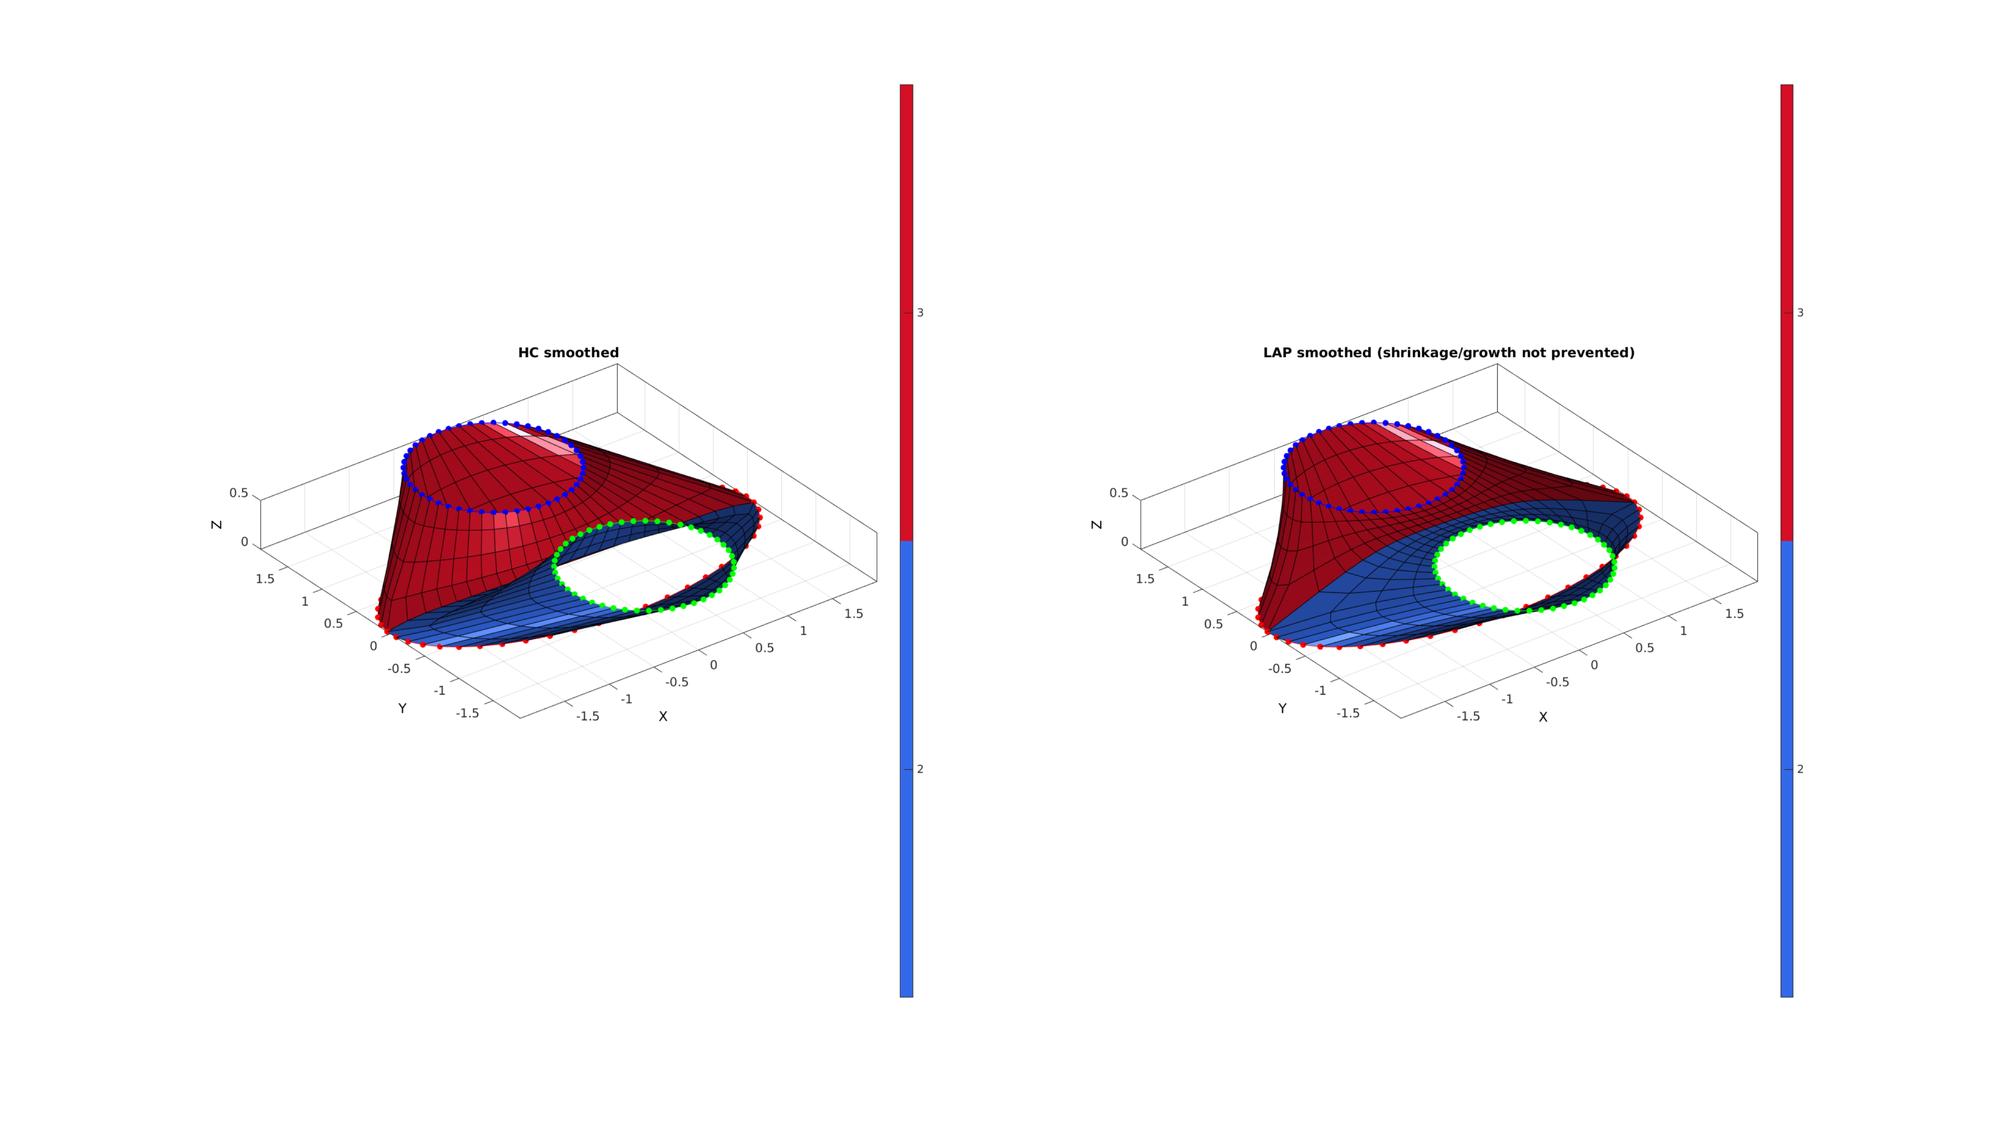
ABOUT SMOOTHENING METHODS
ns=5;
V_cell={V1,V2,V3};
patchType='quad';
splitMethod='ortho';

smoothPar.Method='HC';
smoothPar.n=250;
smoothPar.Tolerance=0.001;
switch smoothPar.Method
    case 'HC'
        smoothPar.Alpa=0.1; %Alpha scale factor to push points back to original
        smoothPar.Beta=0.5; %Beta
    case 'LAP'
        smoothPar.LambdaSmooth=0.25;
end
[F_1,V_1,curveIndices_1,faceMarker_1]=splitCurveSetMesh(V_cell,ns,patchType,smoothPar,splitMethod);

smoothPar.Method='LAP';
smoothPar.n=250;
smoothPar.Tolerance=0.001;
switch smoothPar.Method
    case 'HC'
        smoothPar.Alpa=0.1; %Alpha scale factor to push points back to original
        smoothPar.Beta=0.5; %Beta
    case 'LAP'
        smoothPar.LambdaSmooth=0.25;
end
[F_2,V_2,curveIndices_2,faceMarker_2]=splitCurveSetMesh(V_cell,ns,patchType,smoothPar,splitMethod);
% Plotting results

% Plotting results
cFigure;
subplot(1,2,1); hold on;
title('HC smoothed','FontSize',fontSize);
gpatch(F_1,V_1,faceMarker_1);
plotV(V_1(curveIndices_1{1},:),'r.-','MarkerSize',25);
plotV(V_1(curveIndices_1{2},:),'g.-','MarkerSize',25);
plotV(V_1(curveIndices_1{3},:),'b.-','MarkerSize',25);
axisGeom(gca,fontSize);
colormap(gca,gjet(2)); icolorbar;
camlight headlight;

subplot(1,2,2); hold on;
title('LAP smoothed (shrinkage/growth not prevented)','FontSize',fontSize);
gpatch(F_2,V_2,faceMarker_2);
plotV(V_2(curveIndices_2{1},:),'r.-','MarkerSize',25);
plotV(V_2(curveIndices_2{2},:),'g.-','MarkerSize',25);
plotV(V_2(curveIndices_2{3},:),'b.-','MarkerSize',25);
axisGeom(gca,fontSize);
colormap(gca,gjet(2)); icolorbar;
camlight headlight;
drawnow;

GIBBON www.gibboncode.org
Kevin Mattheus Moerman, [email protected]
GIBBON footer text
License: https://github.com/gibbonCode/GIBBON/blob/master/LICENSE
GIBBON: The Geometry and Image-based Bioengineering add-On. A toolbox for image segmentation, image-based modeling, meshing, and finite element analysis.
Copyright (C) 2019 Kevin Mattheus Moerman
This program is free software: you can redistribute it and/or modify it under the terms of the GNU General Public License as published by the Free Software Foundation, either version 3 of the License, or (at your option) any later version.
This program is distributed in the hope that it will be useful, but WITHOUT ANY WARRANTY; without even the implied warranty of MERCHANTABILITY or FITNESS FOR A PARTICULAR PURPOSE. See the GNU General Public License for more details.
You should have received a copy of the GNU General Public License along with this program. If not, see http://www.gnu.org/licenses/.