scatterV
Below is a demonstration of the features of the scatterV function
Contents
clear; close all; clc;
Syntax
[hp]=scatterV(V); [hp]=scatterV(V,scatterMarkerSize,C); [hp]=scatterV(V,scatterMarkerSize,C,'filled');
Description
This function is similar to scatter3 except that the coordinate set can be specified in a single nx3 array. In fact the function simply does: hp=scatter3(V(:,1),V(:,2),V(:,3),varargin{:}); In other words all additional inputs are directly passed to the scatter3 function.
See also: scatter3
Examples
Create example coordinates V and color data C
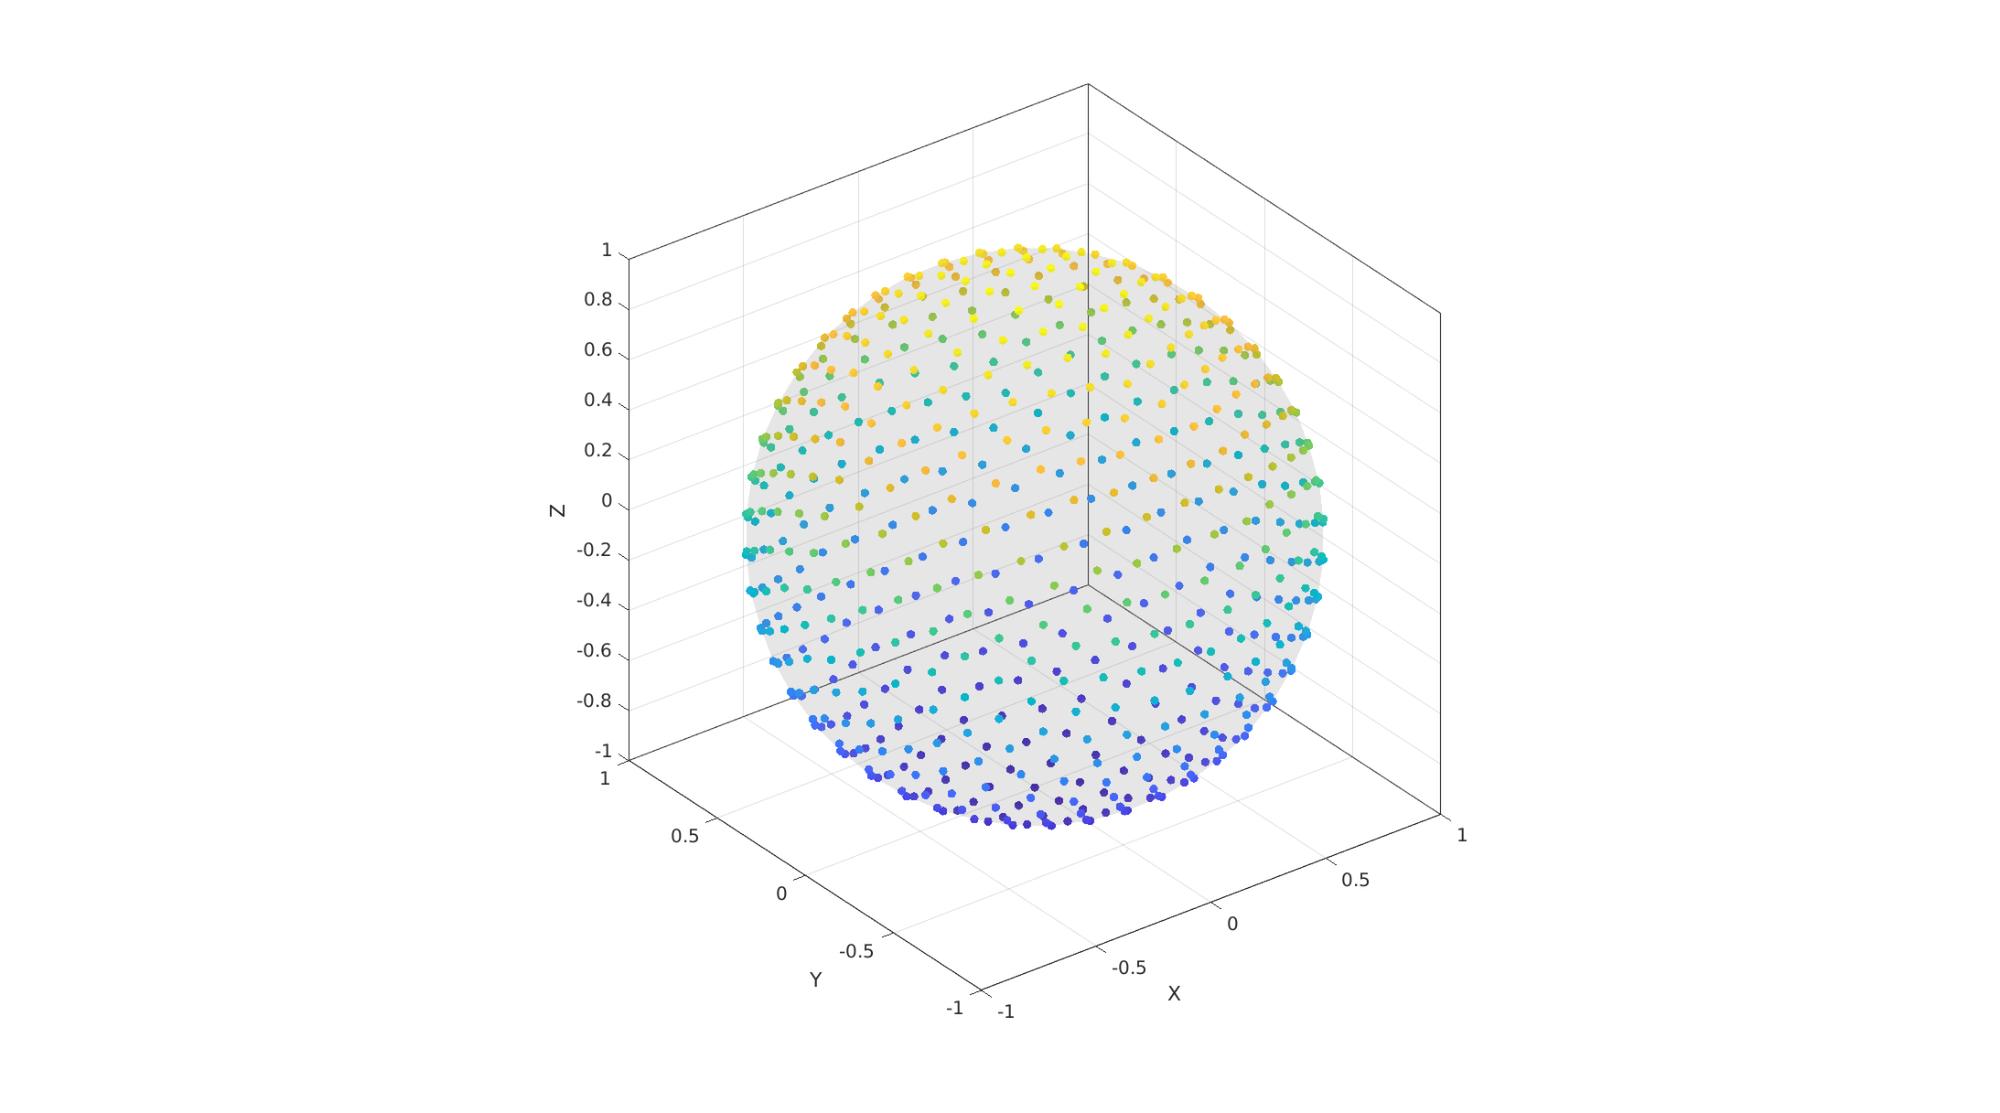
[F,V]=geoSphere(3,1); %Gettting vertices of a sphere
C=V(:,3); %The color data
scatterMarkerSize=50; %The marker size to use
cFigure; hold on;
gpatch(F,V,'kw','none',0.1); %Visualize surface

scatterV(V,scatterMarkerSize,C,'filled'); %using scatterV

axisGeom;
gdrawnow;

GIBBON www.gibboncode.org
Kevin Mattheus Moerman, [email protected]
GIBBON footer text
License: https://github.com/gibbonCode/GIBBON/blob/master/LICENSE
GIBBON: The Geometry and Image-based Bioengineering add-On. A toolbox for image segmentation, image-based modeling, meshing, and finite element analysis.
Copyright (C) 2006-2020 Kevin Mattheus Moerman
This program is free software: you can redistribute it and/or modify it under the terms of the GNU General Public License as published by the Free Software Foundation, either version 3 of the License, or (at your option) any later version.
This program is distributed in the hope that it will be useful, but WITHOUT ANY WARRANTY; without even the implied warranty of MERCHANTABILITY or FITNESS FOR A PARTICULAR PURPOSE. See the GNU General Public License for more details.
You should have received a copy of the GNU General Public License along with this program. If not, see http://www.gnu.org/licenses/.