pointAnnotate
Below is a demonstration of the features of the pointAnnotate function
Contents
clear; close all; clc;
Syntax
[ht]=pointAnnotate(V,nodeIndices,varargin);
Description
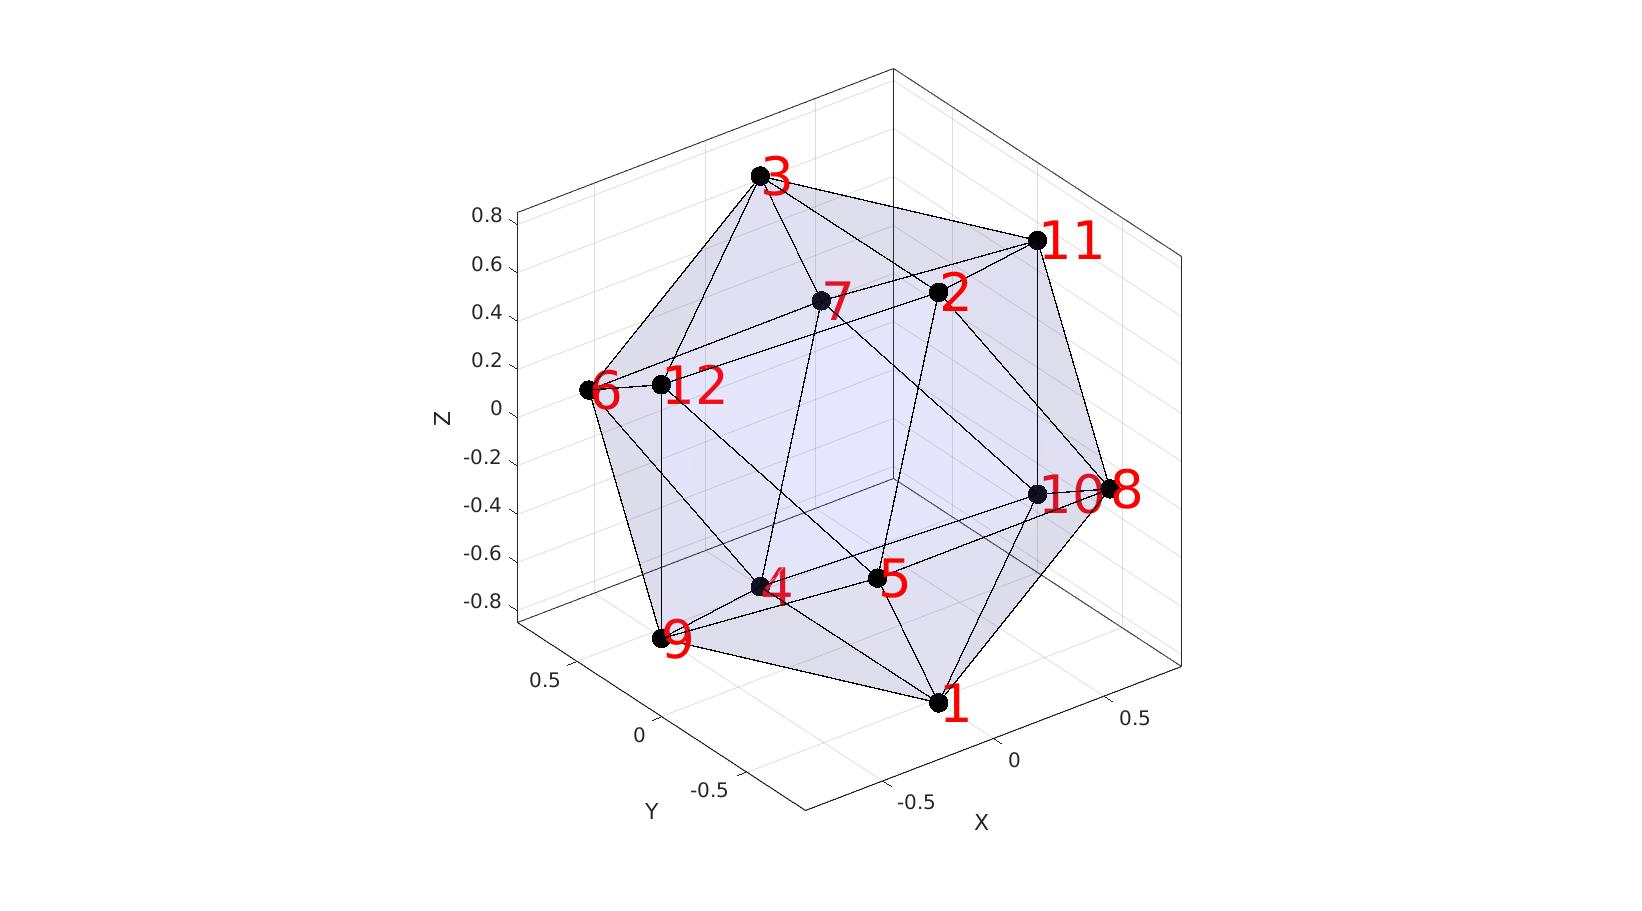
This function adds number labels to a plot at the points specified by V and using the numbers nodeIndices. If nodeIndices is empty then the default numbers are 1:1:size(V,1)
Plot settings
fontSize=40;
makerSize=50;
Examples
[F,V]=geoSphere(0,1);
nodeIndices=1:1:size(V,1);
Creating a plot with annotated points
cFigure; hold on;
gpatch(F,V,'bw','k',0.1,1);
plotV(V,'k.','MarkerSize',makerSize)

%Annotate the point set
ht=pointAnnotate(V,nodeIndices,'FontSize',fontSize);

%Modify text using handles
for q=1:1:numel(ht)
    ht(q).Color='r';
end
axisGeom; camlight headlight;
drawnow;

GIBBON www.gibboncode.org
Kevin Mattheus Moerman, [email protected]
GIBBON footer text
License: https://github.com/gibbonCode/GIBBON/blob/master/LICENSE
GIBBON: The Geometry and Image-based Bioengineering add-On. A toolbox for image segmentation, image-based modeling, meshing, and finite element analysis.
Copyright (C) 2006-2022 Kevin Mattheus Moerman and the GIBBON contributors
This program is free software: you can redistribute it and/or modify it under the terms of the GNU General Public License as published by the Free Software Foundation, either version 3 of the License, or (at your option) any later version.
This program is distributed in the hope that it will be useful, but WITHOUT ANY WARRANTY; without even the implied warranty of MERCHANTABILITY or FITNESS FOR A PARTICULAR PURPOSE. See the GNU General Public License for more details.
You should have received a copy of the GNU General Public License along with this program. If not, see http://www.gnu.org/licenses/.