linspacen
Below is a demonstration of the features of the linspacen function
Contents
Syntax
[C]=linspacen(A,B,n);
Description
This function is a generalization of the linspace function to N dimensions. The output C is a matrix of size [size(A) n] such that "it goes" from A to B in n steps in the last dimention. The input variables A and B (scalars, vectors or matrices). For scalar input this function is equivalent to linspace (but slower due to repmat operation). Clearly the inputs A and B should have the same size.
See also: linspace and subCurve
Examples
clear; close all; clc;
Plot settings
fontSize=15;
cMap=viridis(250);
Control parameters for examples
% Number of steps used in examples
n=6;
Example 1: Use of linspacen for scalars
For scalar input linspacen is equivalent to linspace
A=0
B=1
C=linspacen(A,B,n)
A =

     0


B =

     1


C =

  Columns 1 through 3

                   0   0.200000000000000   0.400000000000000

  Columns 4 through 6

   0.600000000000000   0.800000000000000   1.000000000000000
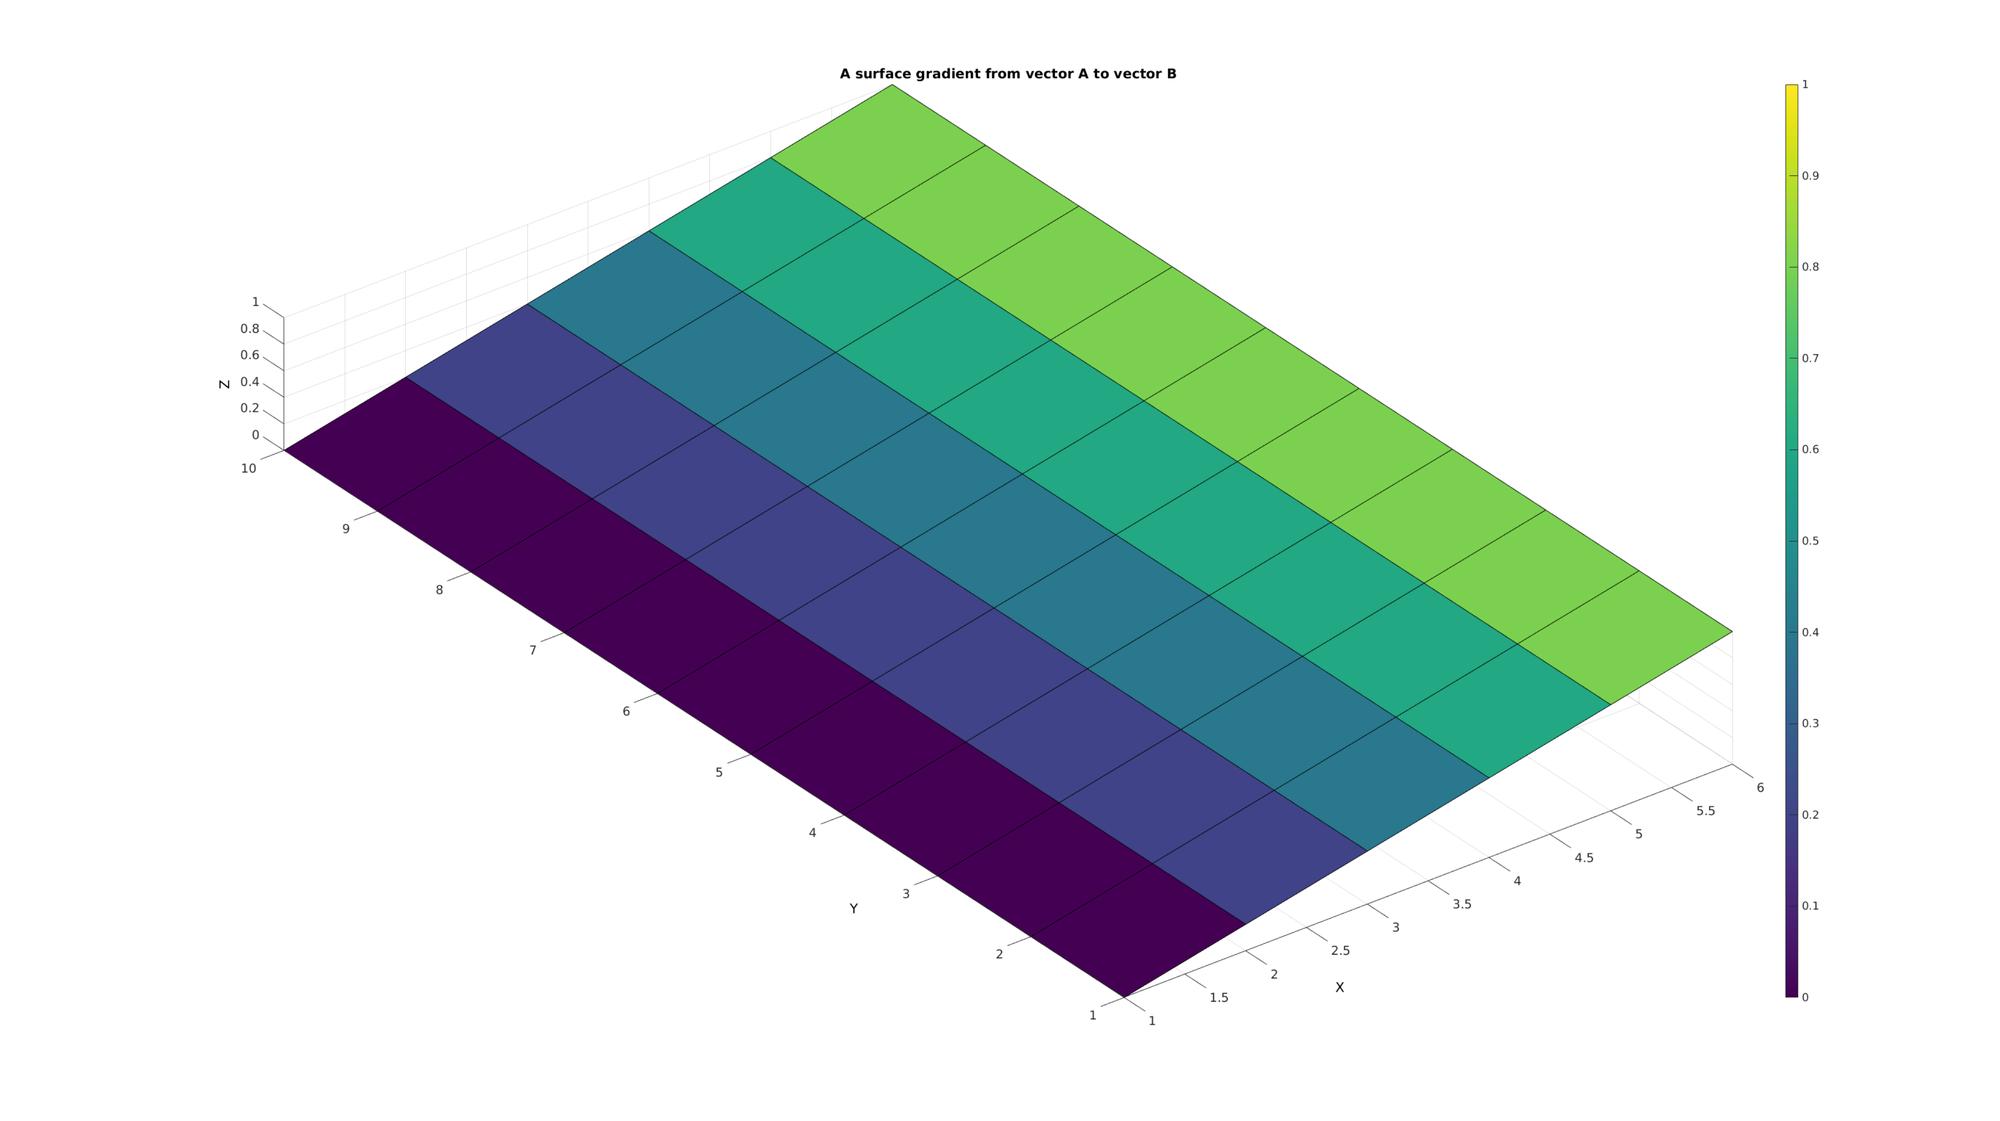
Example 2: Use of linspacen for vectors
For (column) vector input linspacen produces a matrix
A=zeros(1,10)
B=ones(size(A))
C=linspacen(A(:),B(:),n)
A =

     0     0     0     0     0     0     0     0     0     0


B =

     1     1     1     1     1     1     1     1     1     1


C =

  Columns 1 through 3

                   0   0.200000000000000   0.400000000000000
                   0   0.200000000000000   0.400000000000000
                   0   0.200000000000000   0.400000000000000
                   0   0.200000000000000   0.400000000000000
                   0   0.200000000000000   0.400000000000000
                   0   0.200000000000000   0.400000000000000
                   0   0.200000000000000   0.400000000000000
                   0   0.200000000000000   0.400000000000000
                   0   0.200000000000000   0.400000000000000
                   0   0.200000000000000   0.400000000000000

  Columns 4 through 6

   0.600000000000000   0.800000000000000   1.000000000000000
   0.600000000000000   0.800000000000000   1.000000000000000
   0.600000000000000   0.800000000000000   1.000000000000000
   0.600000000000000   0.800000000000000   1.000000000000000
   0.600000000000000   0.800000000000000   1.000000000000000
   0.600000000000000   0.800000000000000   1.000000000000000
   0.600000000000000   0.800000000000000   1.000000000000000
   0.600000000000000   0.800000000000000   1.000000000000000
   0.600000000000000   0.800000000000000   1.000000000000000
   0.600000000000000   0.800000000000000   1.000000000000000
Plotting results
cFigure;
title('A surface gradient from vector A to vector B','FontSize',fontSize);
xlabel('X','FontSize',fontSize);ylabel('Y','FontSize',fontSize); zlabel('Z','FontSize',fontSize);
hold on;
surf(C);
colormap(cMap); caxis([min(C(:)) max(C(:))]);  colorbar;
axis equal; view(3); axis tight;  grid on;  set(gca,'FontSize',fontSize);
drawnow;
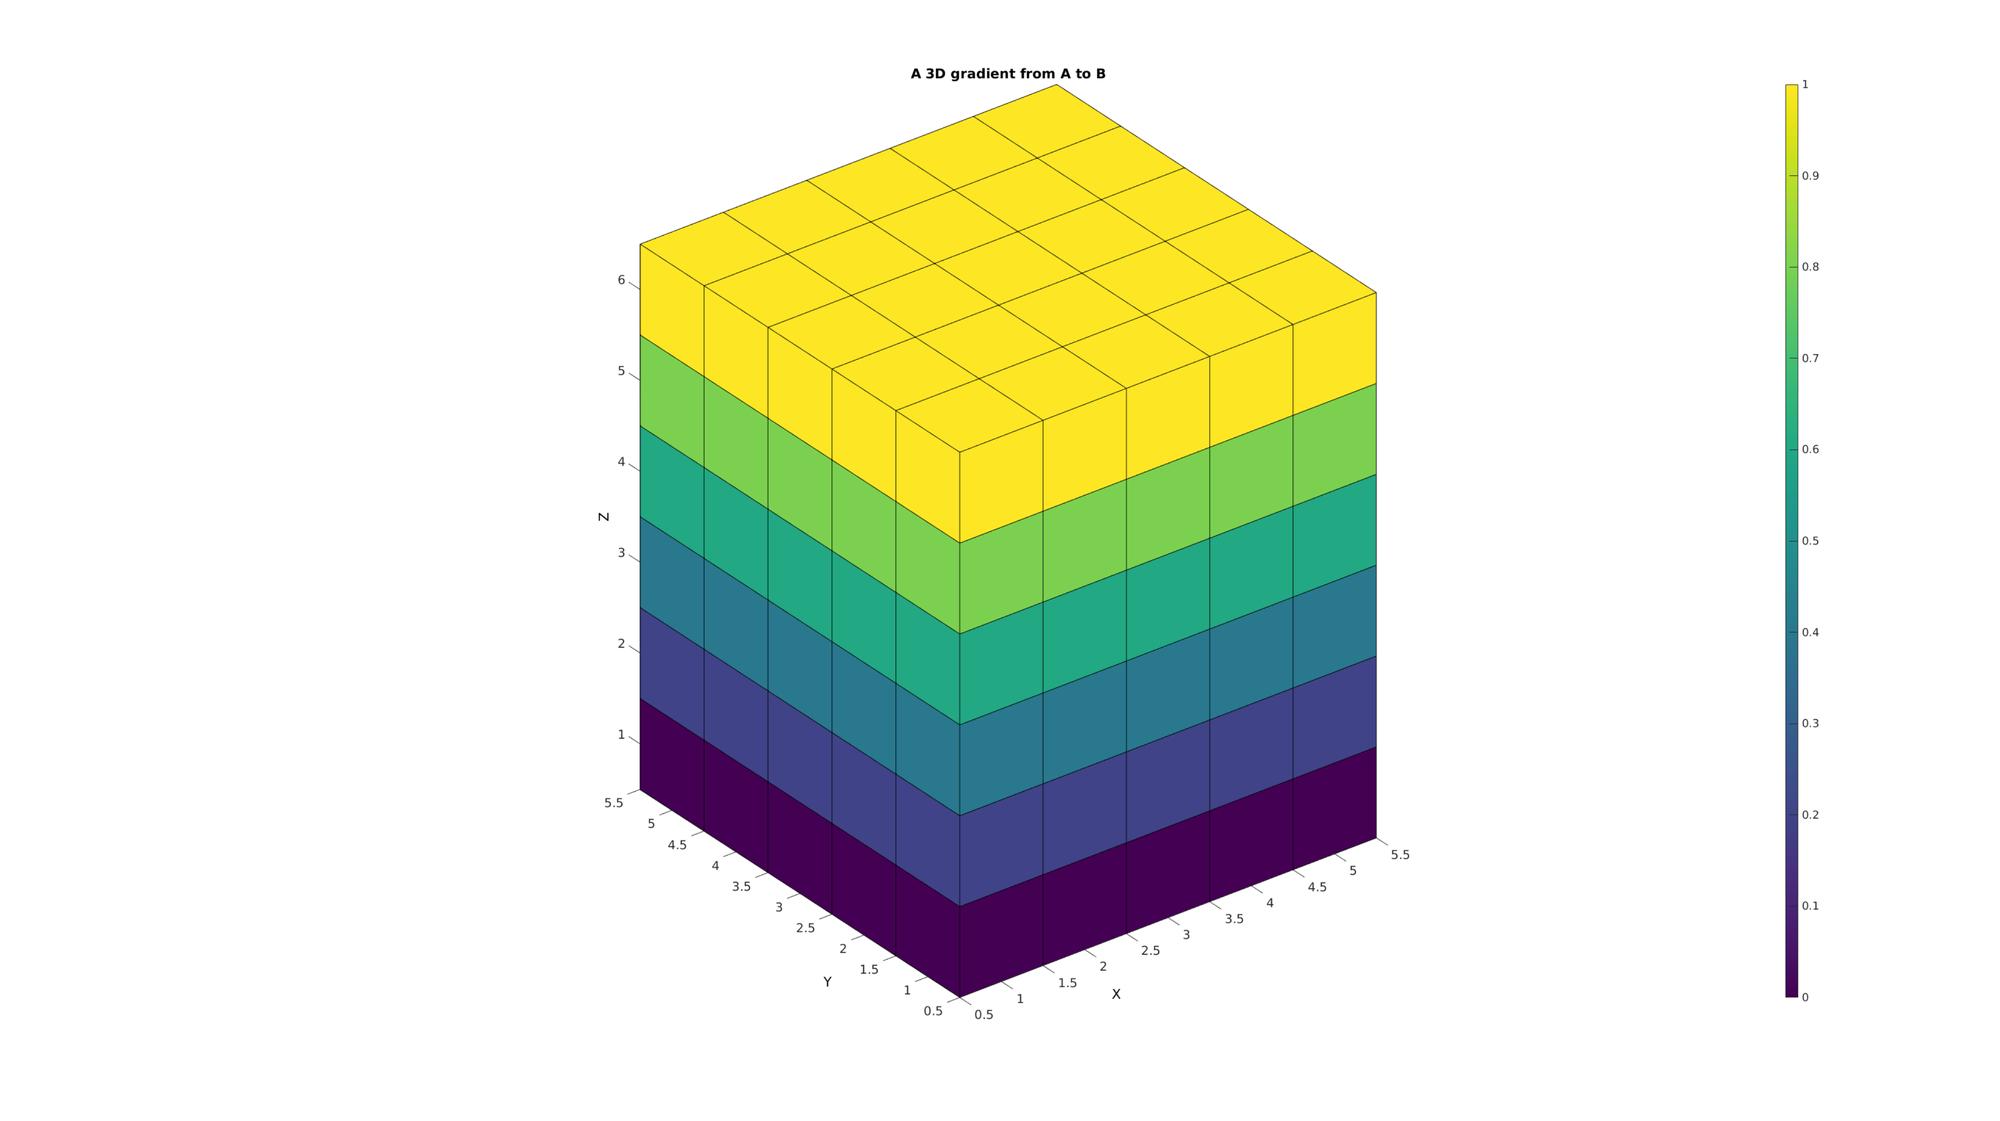
Example 3: Use of linspacen for 2D matrices
For qxr input matrices linspacen produces a qxrxn output matrix whereby the entries go from input A to B allong the last dimension in n steps
A=zeros(5,5)
B=ones(size(A));
C=linspacen(A,B,n)
A =

     0     0     0     0     0
     0     0     0     0     0
     0     0     0     0     0
     0     0     0     0     0
     0     0     0     0     0


C(:,:,1) =

     0     0     0     0     0
     0     0     0     0     0
     0     0     0     0     0
     0     0     0     0     0
     0     0     0     0     0


C(:,:,2) =

  Columns 1 through 3

   0.200000000000000   0.200000000000000   0.200000000000000
   0.200000000000000   0.200000000000000   0.200000000000000
   0.200000000000000   0.200000000000000   0.200000000000000
   0.200000000000000   0.200000000000000   0.200000000000000
   0.200000000000000   0.200000000000000   0.200000000000000

  Columns 4 through 5

   0.200000000000000   0.200000000000000
   0.200000000000000   0.200000000000000
   0.200000000000000   0.200000000000000
   0.200000000000000   0.200000000000000
   0.200000000000000   0.200000000000000


C(:,:,3) =

  Columns 1 through 3

   0.400000000000000   0.400000000000000   0.400000000000000
   0.400000000000000   0.400000000000000   0.400000000000000
   0.400000000000000   0.400000000000000   0.400000000000000
   0.400000000000000   0.400000000000000   0.400000000000000
   0.400000000000000   0.400000000000000   0.400000000000000

  Columns 4 through 5

   0.400000000000000   0.400000000000000
   0.400000000000000   0.400000000000000
   0.400000000000000   0.400000000000000
   0.400000000000000   0.400000000000000
   0.400000000000000   0.400000000000000


C(:,:,4) =

  Columns 1 through 3

   0.600000000000000   0.600000000000000   0.600000000000000
   0.600000000000000   0.600000000000000   0.600000000000000
   0.600000000000000   0.600000000000000   0.600000000000000
   0.600000000000000   0.600000000000000   0.600000000000000
   0.600000000000000   0.600000000000000   0.600000000000000

  Columns 4 through 5

   0.600000000000000   0.600000000000000
   0.600000000000000   0.600000000000000
   0.600000000000000   0.600000000000000
   0.600000000000000   0.600000000000000
   0.600000000000000   0.600000000000000


C(:,:,5) =

  Columns 1 through 3

   0.800000000000000   0.800000000000000   0.800000000000000
   0.800000000000000   0.800000000000000   0.800000000000000
   0.800000000000000   0.800000000000000   0.800000000000000
   0.800000000000000   0.800000000000000   0.800000000000000
   0.800000000000000   0.800000000000000   0.800000000000000

  Columns 4 through 5

   0.800000000000000   0.800000000000000
   0.800000000000000   0.800000000000000
   0.800000000000000   0.800000000000000
   0.800000000000000   0.800000000000000
   0.800000000000000   0.800000000000000


C(:,:,6) =

     1     1     1     1     1
     1     1     1     1     1
     1     1     1     1     1
     1     1     1     1     1
     1     1     1     1     1
Plotting results
cFigure;
title('A 3D gradient from A to B','FontSize',fontSize);
xlabel('X','FontSize',fontSize);ylabel('Y','FontSize',fontSize); zlabel('Z','FontSize',fontSize);
hold on;

[Fm,Vm,Cm]=ind2patch(1:numel(C),C,'vu');

gpatch(Fm,Vm,Cm);

axis equal; view(3); axis tight; axis vis3d; grid off;
colormap(cMap); caxis([min(C(:)) max(C(:))]);  colorbar;
set(gca,'FontSize',fontSize);
drawnow;
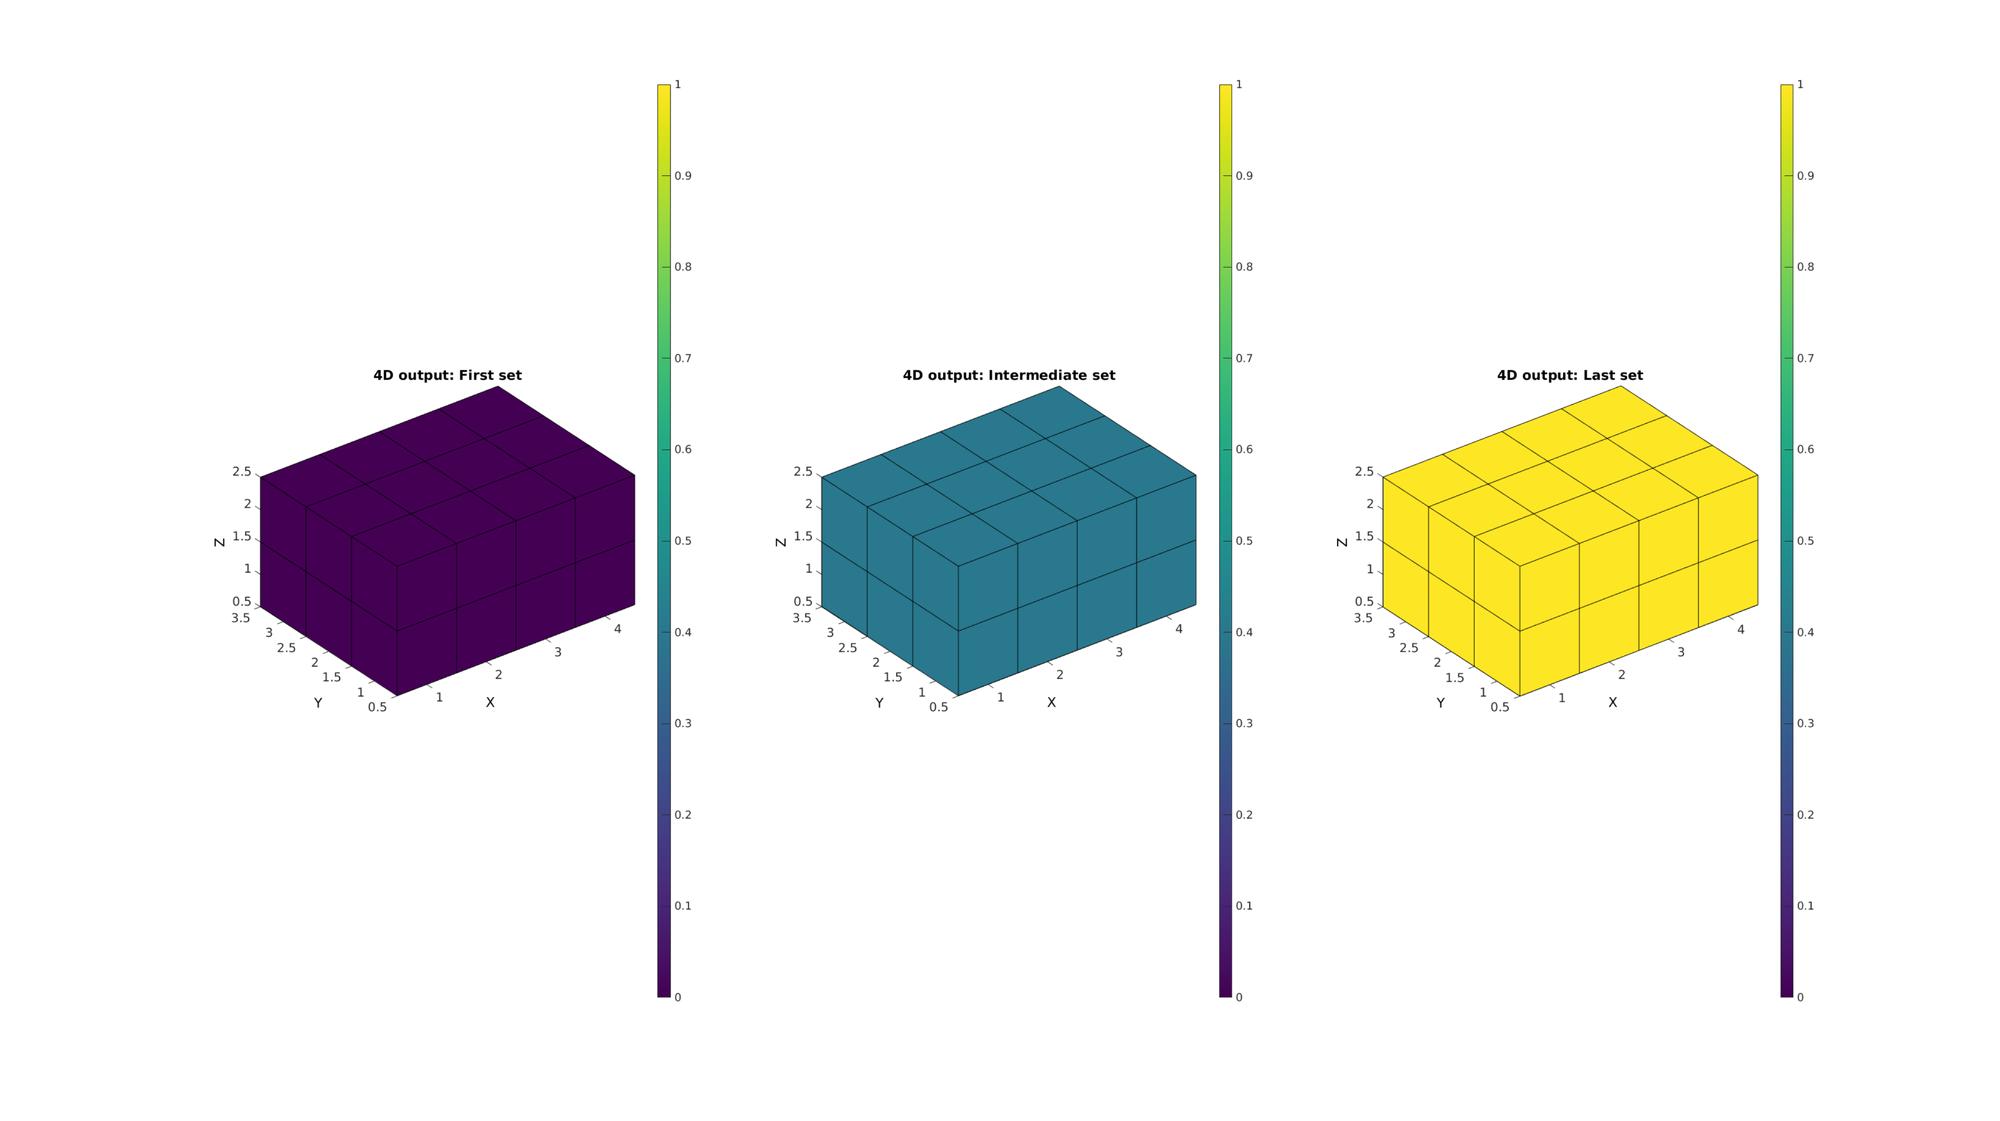
Example 4: Use of linspacen for higher order matrices
For qxrx... input matrices linspacen produces a qxrxn output matrix whereby the entries go from input A to B allong the last dimension in n steps.
A=zeros(3,4,2)
B=ones(size(A));
C=linspacen(A,B,n)
A(:,:,1) =

     0     0     0     0
     0     0     0     0
     0     0     0     0


A(:,:,2) =

     0     0     0     0
     0     0     0     0
     0     0     0     0


C(:,:,1,1) =

     0     0     0     0
     0     0     0     0
     0     0     0     0


C(:,:,2,1) =

     0     0     0     0
     0     0     0     0
     0     0     0     0


C(:,:,1,2) =

  Columns 1 through 3

   0.200000000000000   0.200000000000000   0.200000000000000
   0.200000000000000   0.200000000000000   0.200000000000000
   0.200000000000000   0.200000000000000   0.200000000000000

  Column 4

   0.200000000000000
   0.200000000000000
   0.200000000000000


C(:,:,2,2) =

  Columns 1 through 3

   0.200000000000000   0.200000000000000   0.200000000000000
   0.200000000000000   0.200000000000000   0.200000000000000
   0.200000000000000   0.200000000000000   0.200000000000000

  Column 4

   0.200000000000000
   0.200000000000000
   0.200000000000000


C(:,:,1,3) =

  Columns 1 through 3

   0.400000000000000   0.400000000000000   0.400000000000000
   0.400000000000000   0.400000000000000   0.400000000000000
   0.400000000000000   0.400000000000000   0.400000000000000

  Column 4

   0.400000000000000
   0.400000000000000
   0.400000000000000


C(:,:,2,3) =

  Columns 1 through 3

   0.400000000000000   0.400000000000000   0.400000000000000
   0.400000000000000   0.400000000000000   0.400000000000000
   0.400000000000000   0.400000000000000   0.400000000000000

  Column 4

   0.400000000000000
   0.400000000000000
   0.400000000000000


C(:,:,1,4) =

  Columns 1 through 3

   0.600000000000000   0.600000000000000   0.600000000000000
   0.600000000000000   0.600000000000000   0.600000000000000
   0.600000000000000   0.600000000000000   0.600000000000000

  Column 4

   0.600000000000000
   0.600000000000000
   0.600000000000000


C(:,:,2,4) =

  Columns 1 through 3

   0.600000000000000   0.600000000000000   0.600000000000000
   0.600000000000000   0.600000000000000   0.600000000000000
   0.600000000000000   0.600000000000000   0.600000000000000

  Column 4

   0.600000000000000
   0.600000000000000
   0.600000000000000


C(:,:,1,5) =

  Columns 1 through 3

   0.800000000000000   0.800000000000000   0.800000000000000
   0.800000000000000   0.800000000000000   0.800000000000000
   0.800000000000000   0.800000000000000   0.800000000000000

  Column 4

   0.800000000000000
   0.800000000000000
   0.800000000000000


C(:,:,2,5) =

  Columns 1 through 3

   0.800000000000000   0.800000000000000   0.800000000000000
   0.800000000000000   0.800000000000000   0.800000000000000
   0.800000000000000   0.800000000000000   0.800000000000000

  Column 4

   0.800000000000000
   0.800000000000000
   0.800000000000000


C(:,:,1,6) =

     1     1     1     1
     1     1     1     1
     1     1     1     1


C(:,:,2,6) =

     1     1     1     1
     1     1     1     1
     1     1     1     1
Plotting results
cFigure;
subplot(1,3,1);
title('4D output: First set','FontSize',fontSize);
xlabel('X','FontSize',fontSize);ylabel('Y','FontSize',fontSize); zlabel('Z','FontSize',fontSize);
hold on;

c=C(:,:,:,1);
[Fm,Vm,Cm]=ind2patch(1:numel(c),c,'vu');

gpatch(Fm,Vm,Cm);

axis equal; view(3); axis tight; axis vis3d; grid off;
colormap(cMap); caxis([min(C(:)) max(C(:))]); colorbar;
set(gca,'FontSize',fontSize);

subplot(1,3,2);
title('4D output: Intermediate set','FontSize',fontSize);
xlabel('X','FontSize',fontSize);ylabel('Y','FontSize',fontSize); zlabel('Z','FontSize',fontSize);
hold on;

c=C(:,:,:,round(size(C,4)/2));
[Fm,Vm,Cm]=ind2patch(1:numel(c),c,'vu');

gpatch(Fm,Vm,Cm);

axis equal; view(3); axis tight; axis vis3d; grid off;
colormap(cMap); caxis([min(C(:)) max(C(:))]); colorbar;
set(gca,'FontSize',fontSize);

subplot(1,3,3);
title('4D output: Last set','FontSize',fontSize);
xlabel('X','FontSize',fontSize);ylabel('Y','FontSize',fontSize); zlabel('Z','FontSize',fontSize);
hold on;

c=C(:,:,:,end);
[Fm,Vm,Cm]=ind2patch(1:numel(c),c,'vu');

gpatch(Fm,Vm,Cm);

axis equal; view(3); axis tight; axis vis3d; grid off;
colormap(cMap); caxis([min(C(:)) max(C(:))]); colorbar;
set(gca,'FontSize',fontSize);

drawnow;

GIBBON www.gibboncode.org
Kevin Mattheus Moerman, [email protected]
GIBBON footer text
License: https://github.com/gibbonCode/GIBBON/blob/master/LICENSE
GIBBON: The Geometry and Image-based Bioengineering add-On. A toolbox for image segmentation, image-based modeling, meshing, and finite element analysis.
Copyright (C) 2019 Kevin Mattheus Moerman
This program is free software: you can redistribute it and/or modify it under the terms of the GNU General Public License as published by the Free Software Foundation, either version 3 of the License, or (at your option) any later version.
This program is distributed in the hope that it will be useful, but WITHOUT ANY WARRANTY; without even the implied warranty of MERCHANTABILITY or FITNESS FOR A PARTICULAR PURPOSE. See the GNU General Public License for more details.
You should have received a copy of the GNU General Public License along with this program. If not, see http://www.gnu.org/licenses/.