interpDirVec
Below is a demonstration of the features of the interpDirVec function
Contents
clear; close all; clc;
Syntax
[varargout]=interpDirVec(interpStruct,Vf,P_I);
Description
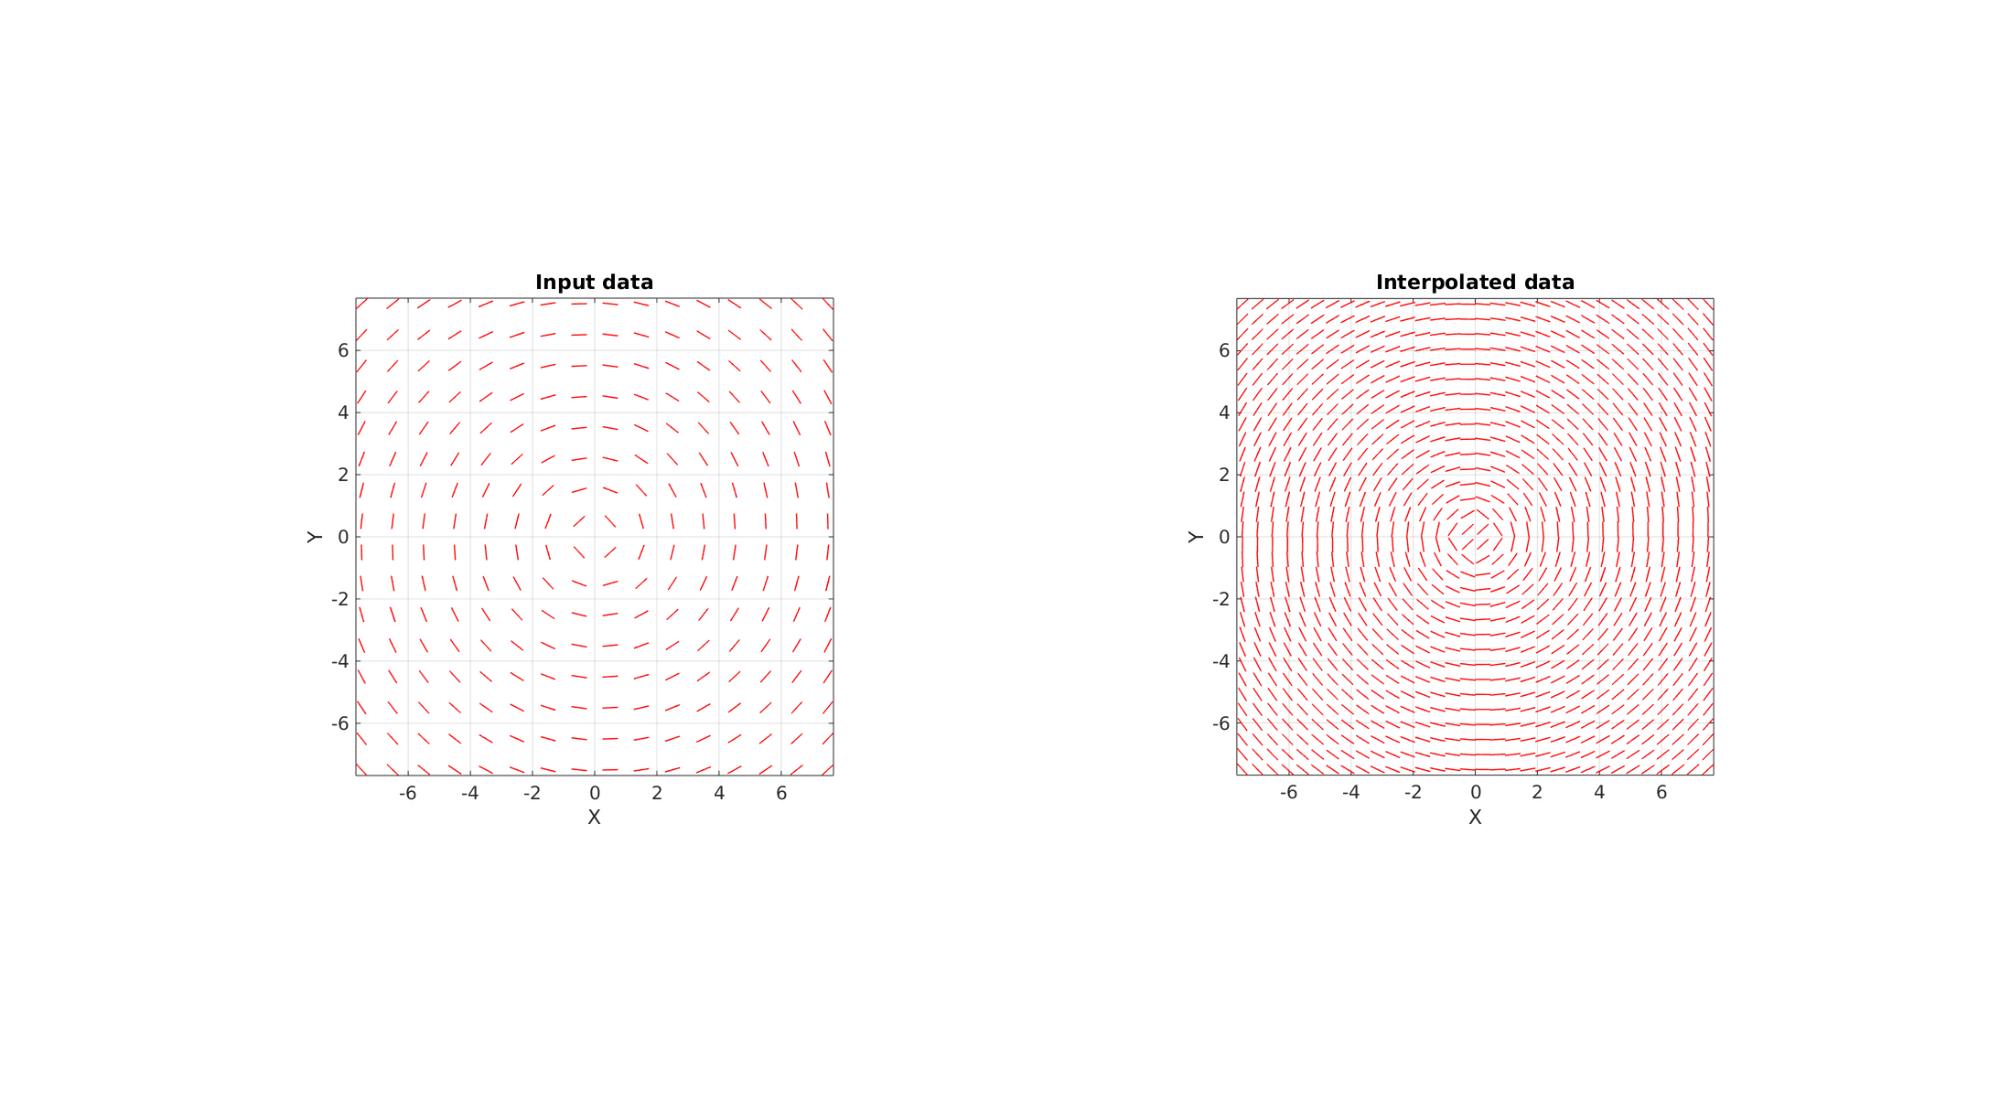
This function interpolates a direction vector field. Direction vectors are here defined as vectors indicating for instance a fibre direction such that for a vector 'v' actually defines the same fibre direction as the vector '-v'. Hence for interpolation special care must be taken to treat this property. Firstly structure tensors are composed of the form V=v'*v. This tensor field is then interpolated (in 6 steps due to symmetry). The 1st principal eigenvectors of the interpolated tensors then forms the interpolated direction vector set. The input is the a variable here called interpStruct. If interpStruct is a structure array it and may contain: interpStruct.Points interpStruct.Method (default is 'linear' if not provided) interpStruct.ExtrapolationMethod (default is 'none' if not provided) If however interpStruct is of the scatteredInterpolant class it will in addition contain: interpStruct.Values If interpStruct is not of the scatteredInterpolant class such a representation will be constructed. The inputs are the position vectors interpStruct.Points (coordinates of vector origins), the direction or fibre direction vectors Vf, the position vectors P_I defining the interpolation coordinates, interpStruct.Method defining an interpolation method (default is 'linear') for the scatteredInterpolant function ('linear','natural','nearest'), and similarly interpStruct.ExtrapolationMethod defining the extrapolation method (default is 'none').
See also: scatteredInterpolant
Examples
Plot settings
Create example direction vector data (note the data need not be gridded)
% Create circular direction field
n=16;
s=15;
[X,Y,Z]=meshgrid(linspace(-s/2,s/2,n));
V=[X(:) Y(:) Z(:)];
R=euler2DCM([0 0 (5/180)*pi]);
V2=V*R;
Vf=vecnormalize(V-V2);

%Flip half negative (invert direction which means the same direction) to
%show the point of this method
Vf(V(:,1)>0,:)=-Vf(V(:,1)>0,:);
Define interpolation set
ni=2*n;
[X,Y,Z]=meshgrid(linspace(-s/2,s/2,ni));
VI=[X(:) Y(:) Z(:)];

interpStruct.Points=V;
interpStruct.Method='linear';

[VfI,interpFun]=interpDirVec(interpStruct,Vf,VI);
cFigure;

subplot(1,2,1); hold on;
title('Input data')
quiverLine(V,Vf,0.5,'r',1,3);
axisGeom; camlight headlight;
view(2);

subplot(1,2,2); hold on;
title('Interpolated data')
quiverLine(VI,VfI,0.5,'r',1,3);
axisGeom; camlight headlight;
view(2);
gdrawnow;

GIBBON www.gibboncode.org
Kevin Mattheus Moerman, [email protected]
GIBBON footer text
License: https://github.com/gibbonCode/GIBBON/blob/master/LICENSE
GIBBON: The Geometry and Image-based Bioengineering add-On. A toolbox for image segmentation, image-based modeling, meshing, and finite element analysis.
Copyright (C) 2006-2023 Kevin Mattheus Moerman and the GIBBON contributors
This program is free software: you can redistribute it and/or modify it under the terms of the GNU General Public License as published by the Free Software Foundation, either version 3 of the License, or (at your option) any later version.
This program is distributed in the hope that it will be useful, but WITHOUT ANY WARRANTY; without even the implied warranty of MERCHANTABILITY or FITNESS FOR A PARTICULAR PURPOSE. See the GNU General Public License for more details.
You should have received a copy of the GNU General Public License along with this program. If not, see http://www.gnu.org/licenses/.