gedge
Below is a demonstration of the features of the dihedralAngles function
Contents
- Syntax
- Description
- Examples
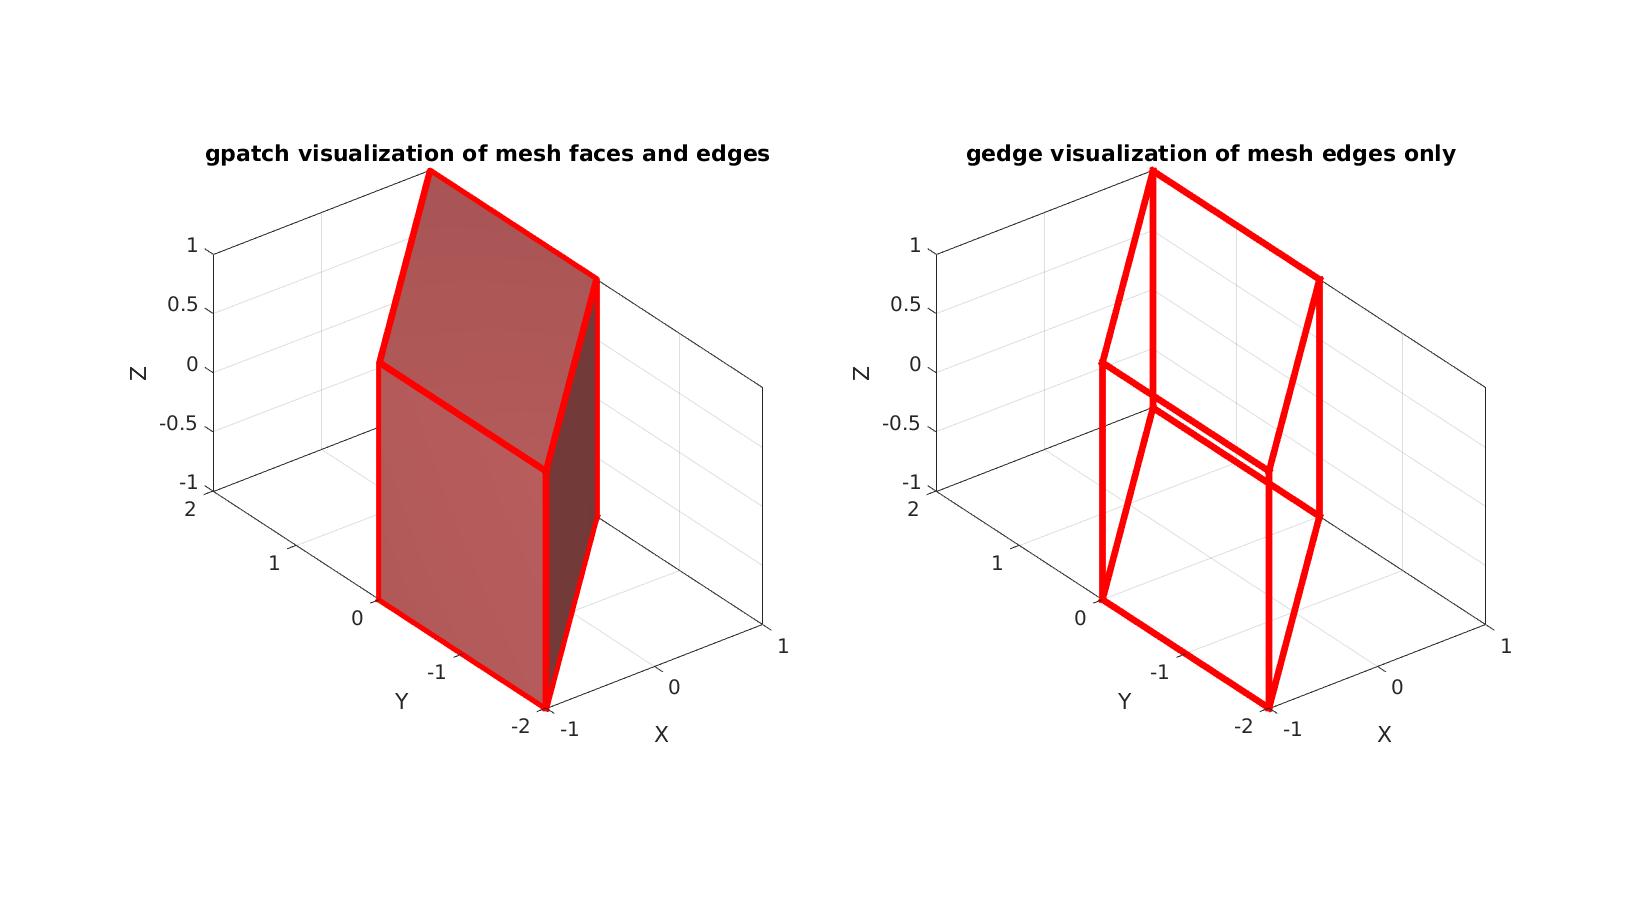
- Example 1: Visualizing edges in a single color
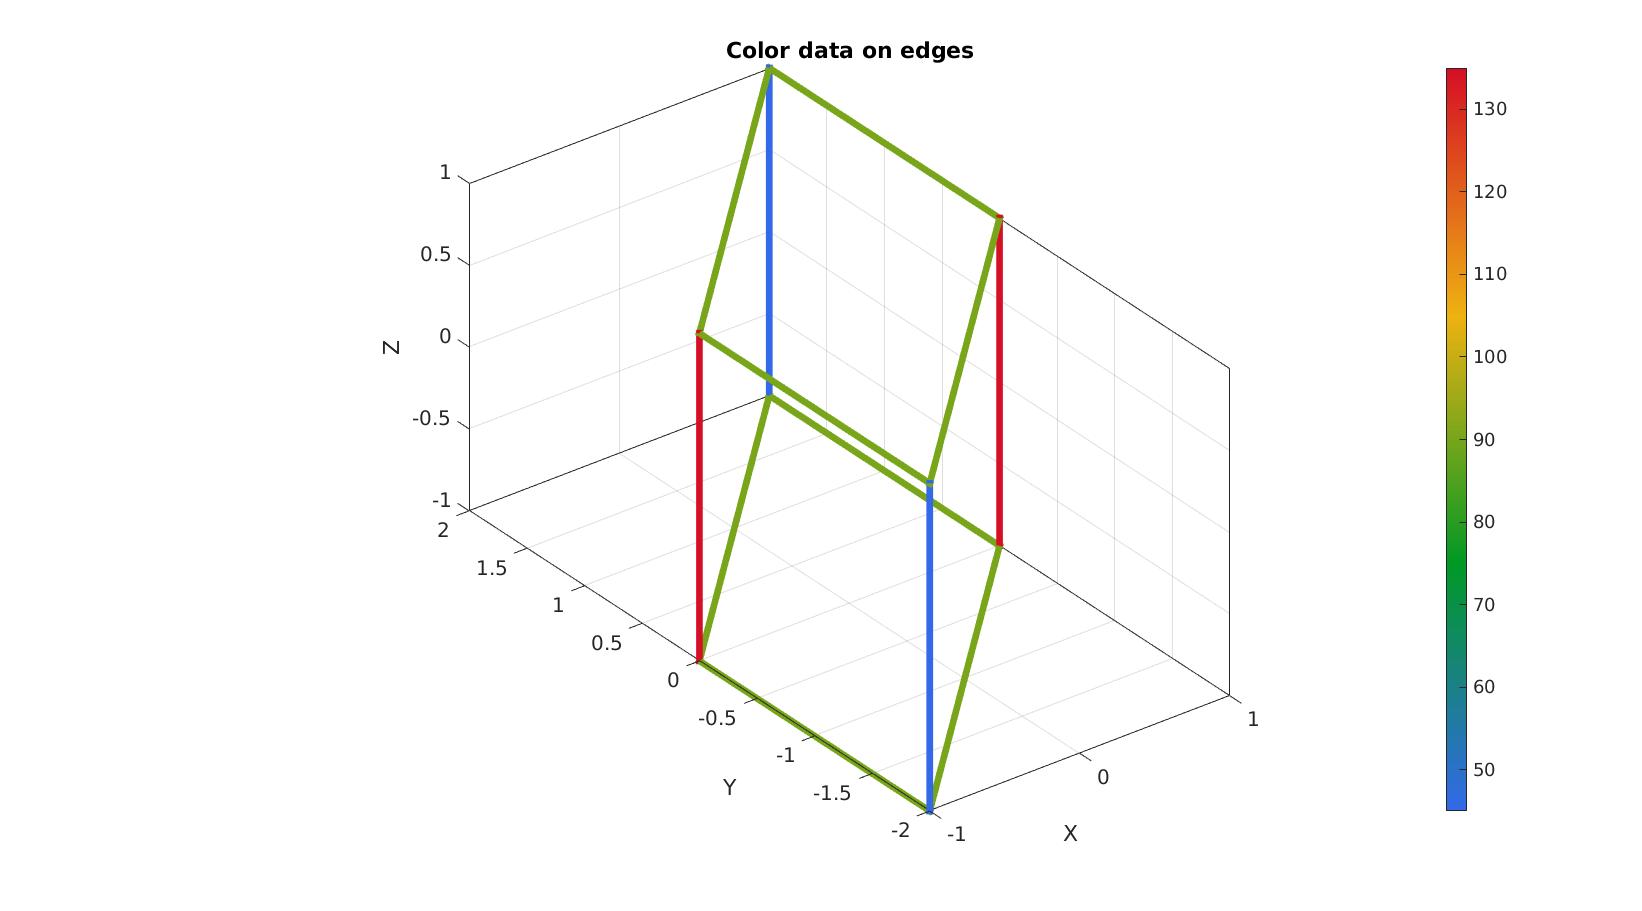
- Example 2: Using colormapping on the edges
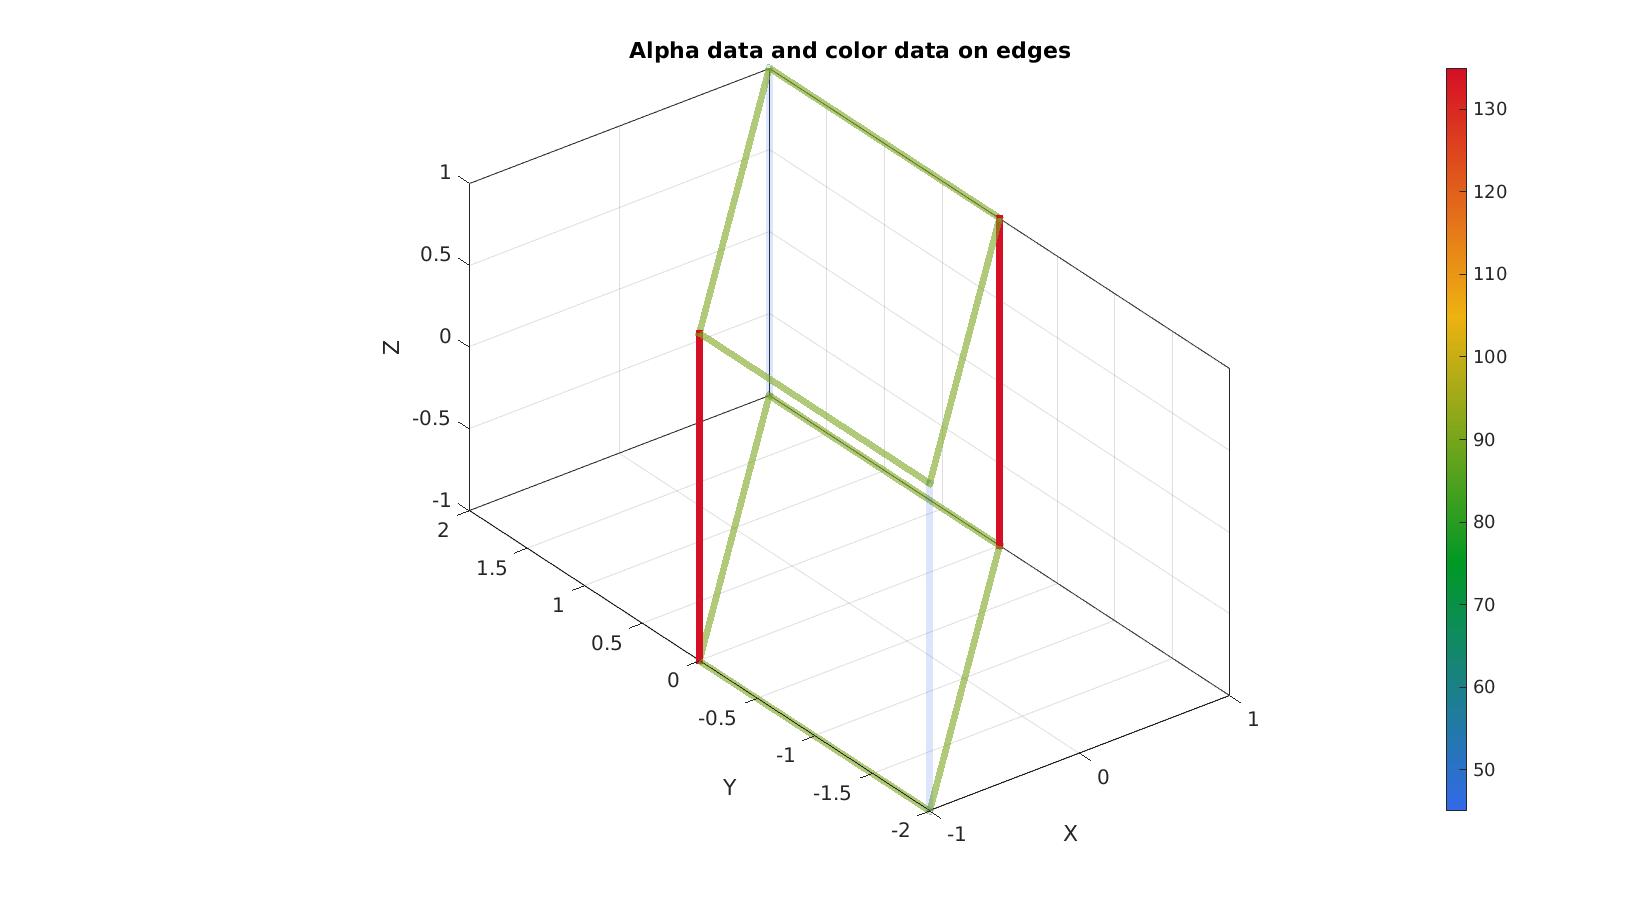
- Example 3: Specifying edge transparency as well
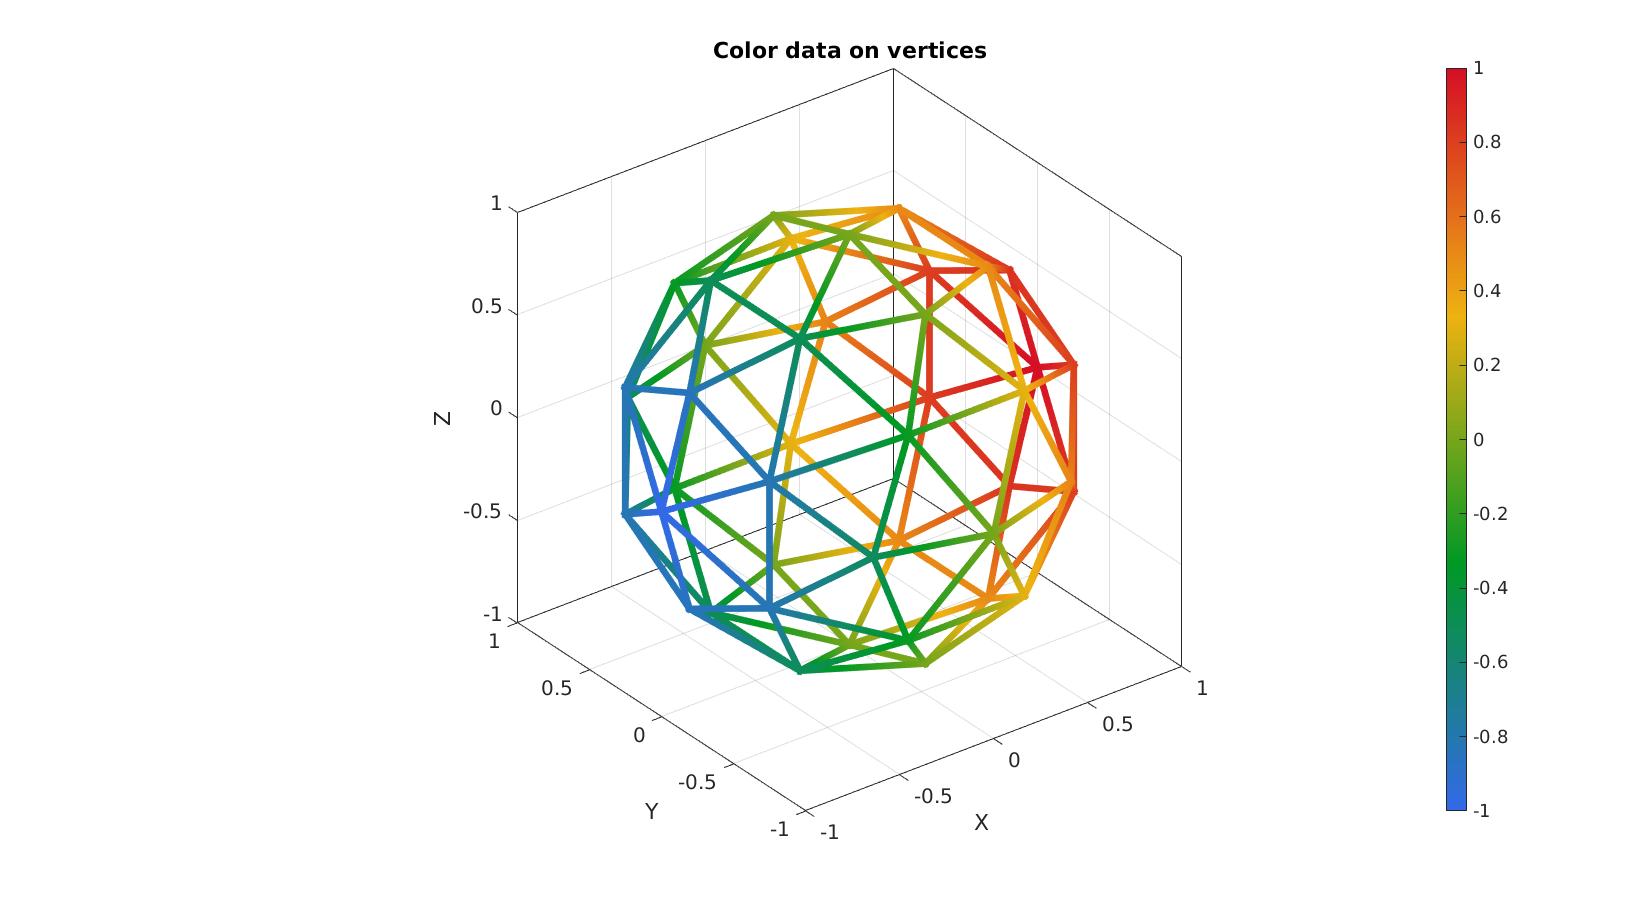
- Example 4: Interpolated colors from vertex (node) data
- Example 5: Specifying RGB color data on edges
- Example 6: Specifying RGB color data on vertices (nodes)
clear; close all; clc;
Syntax
[h]=gedge(E,V,AE,5,AE);
Description
The gedge function aids in the visualization of edges e.g. of meshes. Edge coloring and transparency can be prescribed.
SEe also gpatch.
Examples
Plot settings
fontSize=20;
edgeThickness=5;
cmap=gjet(250);
Create example data, mesh data for a hex mesh
%Create mesh for a cube
boxDim=2*ones(1,3);
boxEl=1*ones(1,3);
[meshStruct]=hexMeshBox(boxDim,boxEl);
Eh=meshStruct.E;
V=meshStruct.V;
F=meshStruct.F;

%Distorting the shape (shear)
d=eye(3,3); %Identity
d(1,2)=1; %Add shear
V=V*d; %Deform

%Get mesh edges
E=patchEdges(F,V);
Example 1: Visualizing edges in a single color
cFigure;
subplot(1,2,1); hold on;
title('gpatch visualization of mesh faces and edges');
gpatch(F,V,'rw','r',1,edgeThickness);
axisGeom; camlight headlight;

subplot(1,2,2); hold on;
title('gedge visualization of mesh edges only');
gedge(E,V,'r',edgeThickness);
axisGeom; camlight headlight;

drawnow;
Example 2: Using colormapping on the edges
Create example color data on edges, e.g. the mesh dihedral angle
[~,E,AE]=dihedralAngles(Eh,V,'hex8');
AE=180*(AE./pi);
cFigure; hold on;
title('Color data on edges')
gedge(E,V,AE,edgeThickness);
axisGeom; camlight headlight;
colormap(cmap); colorbar;
gdrawnow;
Example 3: Specifying edge transparency as well
cFigure; hold on;
title('Alpha data and color data on edges')
gedge(E,V,AE,edgeThickness,AE);
axisGeom; camlight headlight;
colormap(cmap); colorbar;
alim([25 135]);
gdrawnow;
Example 4: Interpolated colors from vertex (node) data
[F,V]=geoSphere(1,1);
E=patchEdges(F);
VE=patchCentre(E,V);
CE=VE(:,1); %Example edge color data  = mid-edge x-coordinate
CV=V(:,1); %Example vertex color data = x-coordinate
cFigure; hold on;
title('Color data on vertices')
h= gedge(E,V,CV,edgeThickness);
h.EdgeColor='interp'; %Turn on interpolated shading
axisGeom; camlight headlight;
colormap(cmap); colorbar;
gdrawnow;
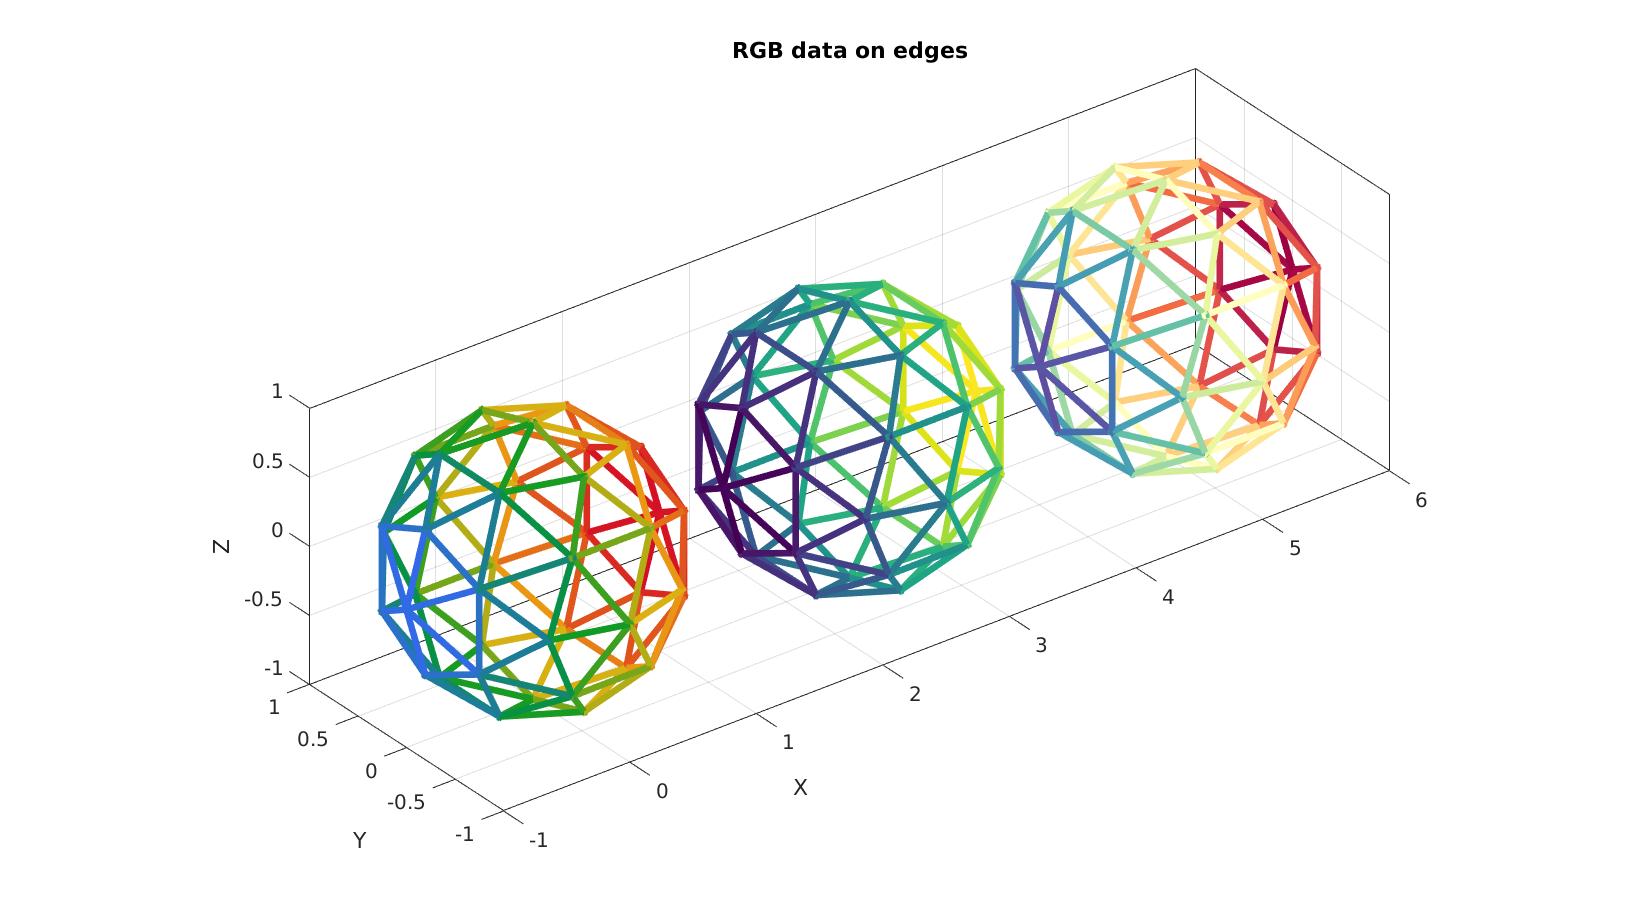
Example 5: Specifying RGB color data on edges
C_rgb1=cmaperise(CE,gjet(250));
C_rgb2=cmaperise(CE,viridis(250));
C_rgb3=cmaperise(CE,spectral(250));

V2=V;
V2(:,1)=V2(:,1)+2.5;
V3=V2;
V3(:,1)=V3(:,1)+2.5;
cFigure; hold on;
title('RGB data on edges')
h1= gedge(E,V ,C_rgb1,edgeThickness);
h2= gedge(E,V2,C_rgb2,edgeThickness);
h3= gedge(E,V3,C_rgb3,edgeThickness);
axisGeom; camlight headlight;
gdrawnow;
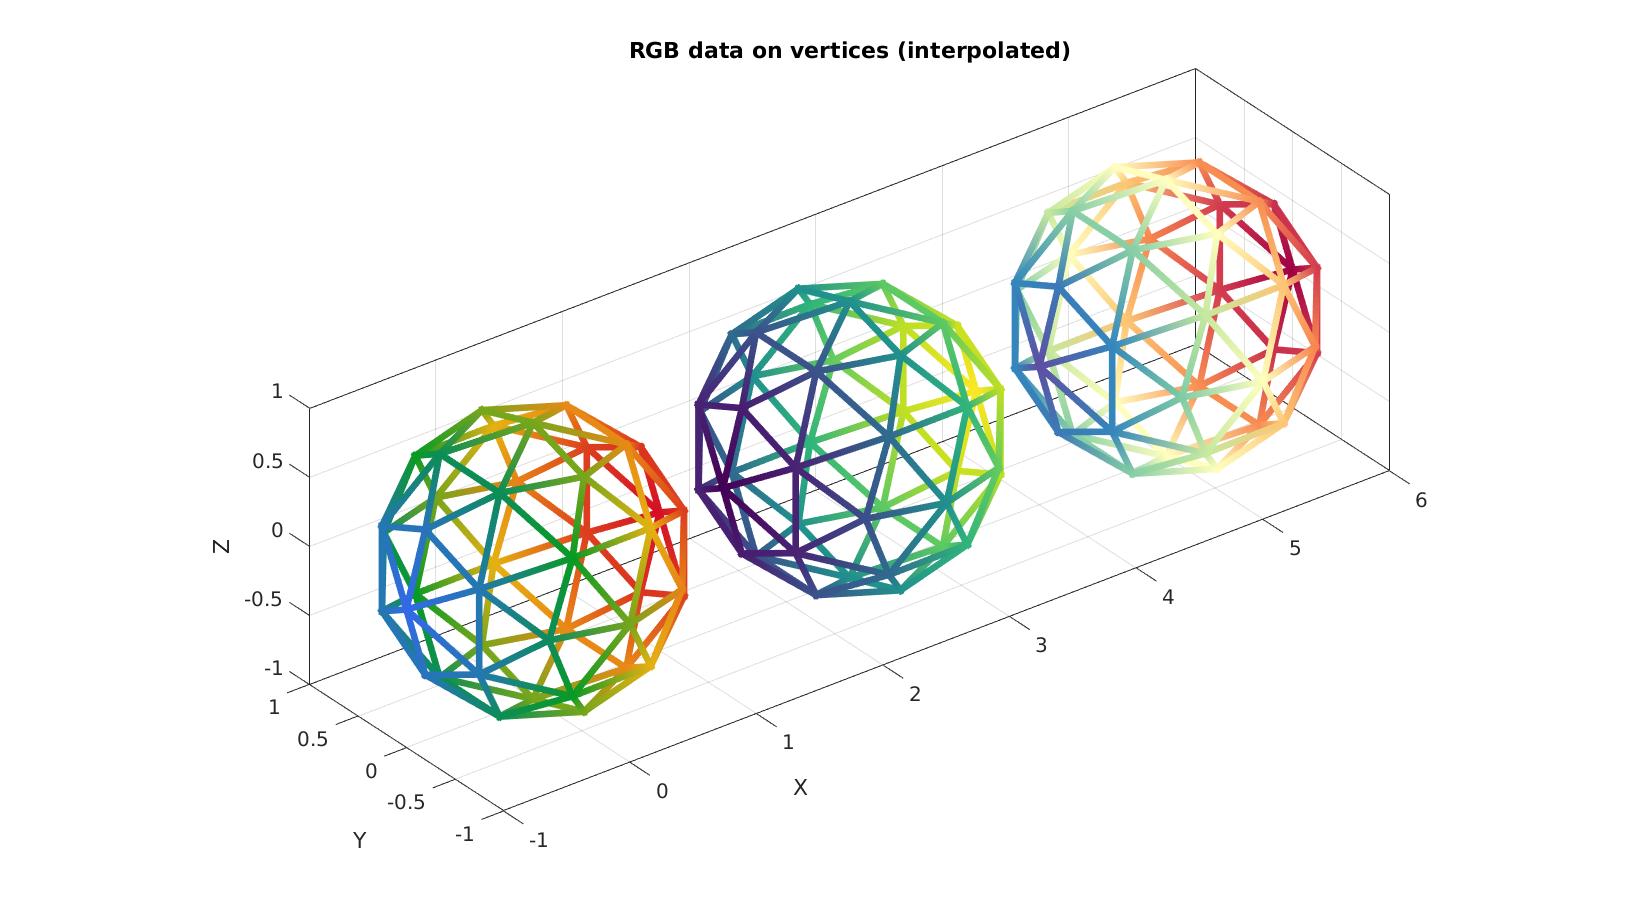
Example 6: Specifying RGB color data on vertices (nodes)
C_rgb1=cmaperise(CV,gjet(250));
C_rgb2=cmaperise(CV,viridis(250));
C_rgb3=cmaperise(CV,spectral(250));
cFigure; hold on;
title('RGB data on vertices (interpolated)')
h1= gedge(E,V ,C_rgb1,edgeThickness); h1.EdgeColor='interp';
h2= gedge(E,V2,C_rgb2,edgeThickness); h2.EdgeColor='interp';
h3= gedge(E,V3,C_rgb3,edgeThickness); h3.EdgeColor='interp';
axisGeom; camlight headlight;
gdrawnow;

GIBBON www.gibboncode.org
Kevin Mattheus Moerman, [email protected]
GIBBON footer text
License: https://github.com/gibbonCode/GIBBON/blob/master/LICENSE
GIBBON: The Geometry and Image-based Bioengineering add-On. A toolbox for image segmentation, image-based modeling, meshing, and finite element analysis.
Copyright (C) 2006-2022 Kevin Mattheus Moerman and the GIBBON contributors
This program is free software: you can redistribute it and/or modify it under the terms of the GNU General Public License as published by the Free Software Foundation, either version 3 of the License, or (at your option) any later version.
This program is distributed in the hope that it will be useful, but WITHOUT ANY WARRANTY; without even the implied warranty of MERCHANTABILITY or FITNESS FOR A PARTICULAR PURPOSE. See the GNU General Public License for more details.
You should have received a copy of the GNU General Public License along with this program. If not, see http://www.gnu.org/licenses/.