faceToVertexMeasure
Below is a demonstration of the features of the patchPathAngles function
Contents
clear; close all; clc;
Syntax
[indAngles]=faceToVertexMeasure(F,V,ind,isClosedLoop);
Description
The faceToVertexMeasure function converts data for faces to data on vertices through averaging.
Examples
Plot settings
markerSize=150;
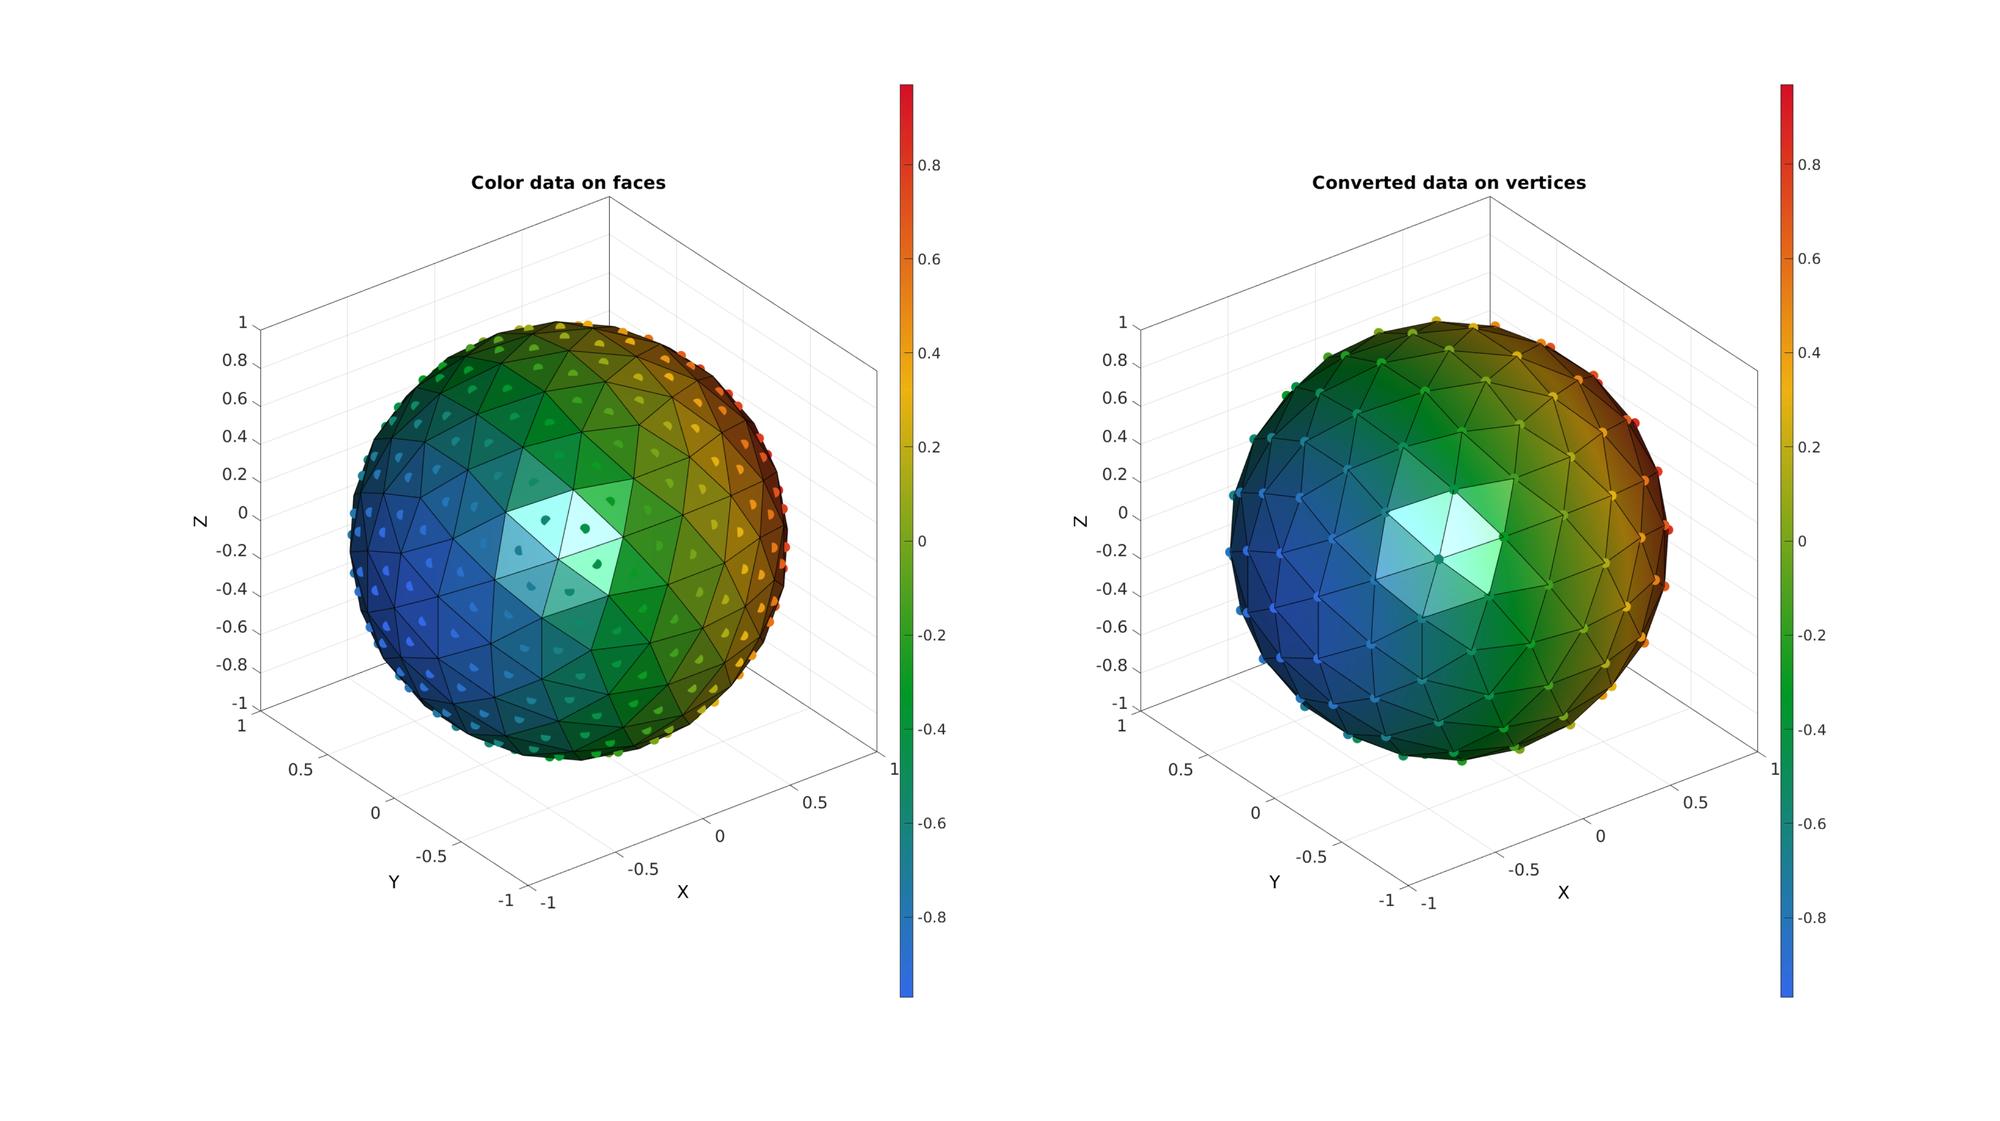
Example 1: Convert face data to vertex data
[F,V]=geoSphere(2,1);
VF=patchCentre(F,V);
CF=VF(:,1);
[CV]=faceToVertexMeasure(F,V,CF);
cFigure;
subplot(1,2,1); hold on;
title('Color data on faces')
gpatch(F,V,CF);
scatterV(VF,markerSize,CF,'filled');
colormap gjet; colorbar;
axisGeom;
camlight headlight;

subplot(1,2,2); hold on;
title('Converted data on vertices')
hp=gpatch(F,V,CV);
hp.FaceColor='Interp';
scatterV(V,markerSize,CV,'filled');
colormap gjet; colorbar;
axisGeom;
camlight headlight;

drawnow;
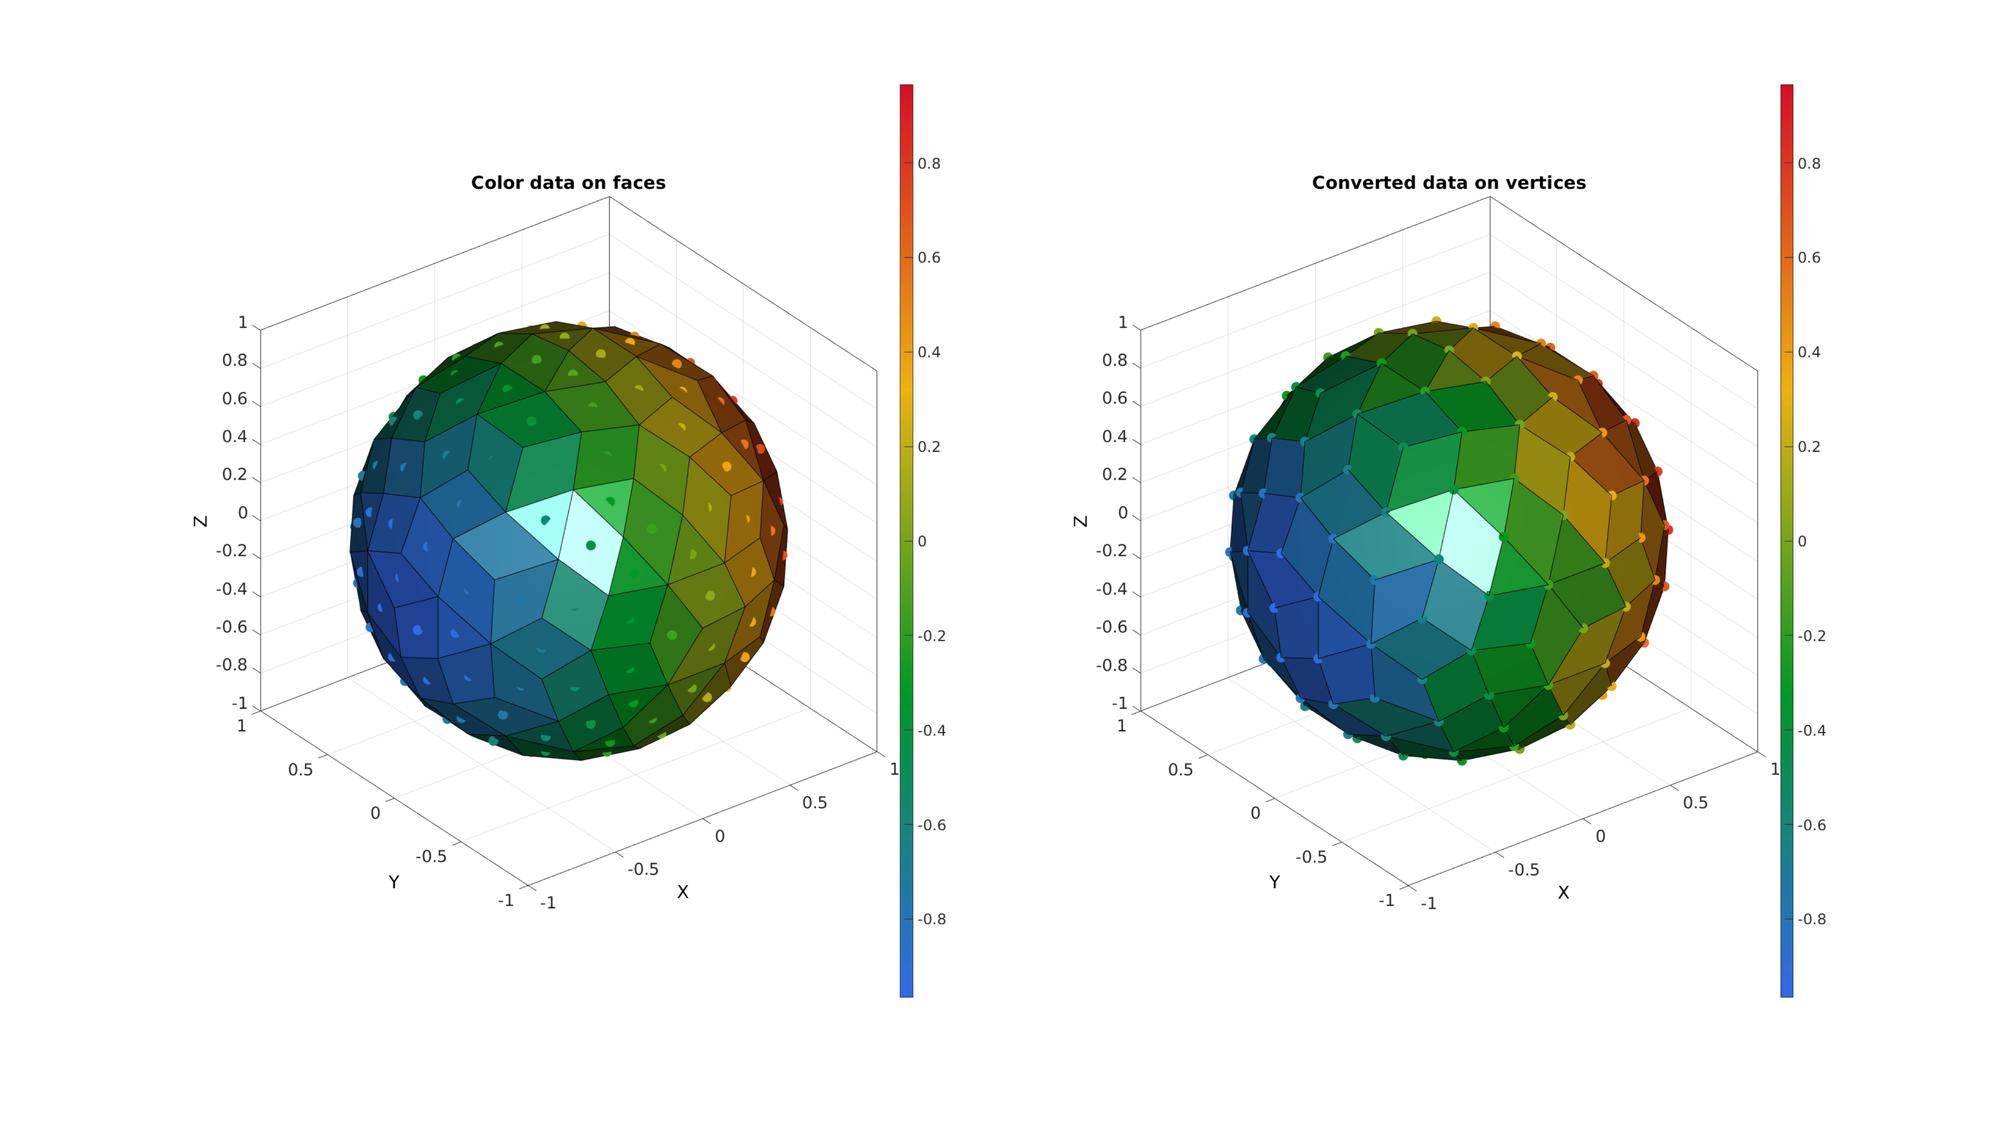
Example 2: Convert face data on a mixed mesh to vertex data
Create an example of a mixed mesh consisting of triangles and quadrilateral faces.
% Create a triangular mesh
[F,V]=geoSphere(2,1);

% Converting to a quadrilateral mesh
optionStruct.maxAngleDeviation=45*(pi/180);
optionStruct.selectionMethod='best';
optionStruct.triangleConvert=0;
optionStruct.fourConnectConvert=0;
[F,V]=tri2quadGroupSplit(F,V,optionStruct);

VF=patchCentre(F,V);
CF=VF;
for q=1:1:numel(VF)
    CF{q}=VF{q}(:,1);
end
[CV]=faceToVertexMeasure(F,V,CF);
cFigure;
subplot(1,2,1); hold on;
title('Color data on faces')
gpatch(F,V,CF);
for q=1:1:numel(VF)
    scatterV(VF{q},markerSize,CF{q},'filled');
end
colormap gjet; colorbar;
axisGeom;
camlight headlight;

subplot(1,2,2); hold on;
title('Converted data on vertices')
hp=gpatch(F,V,CV);
% hp.FaceColor='Interp';
scatterV(V,markerSize,CV,'filled');
colormap gjet; colorbar;
axisGeom;
camlight headlight;
drawnow;
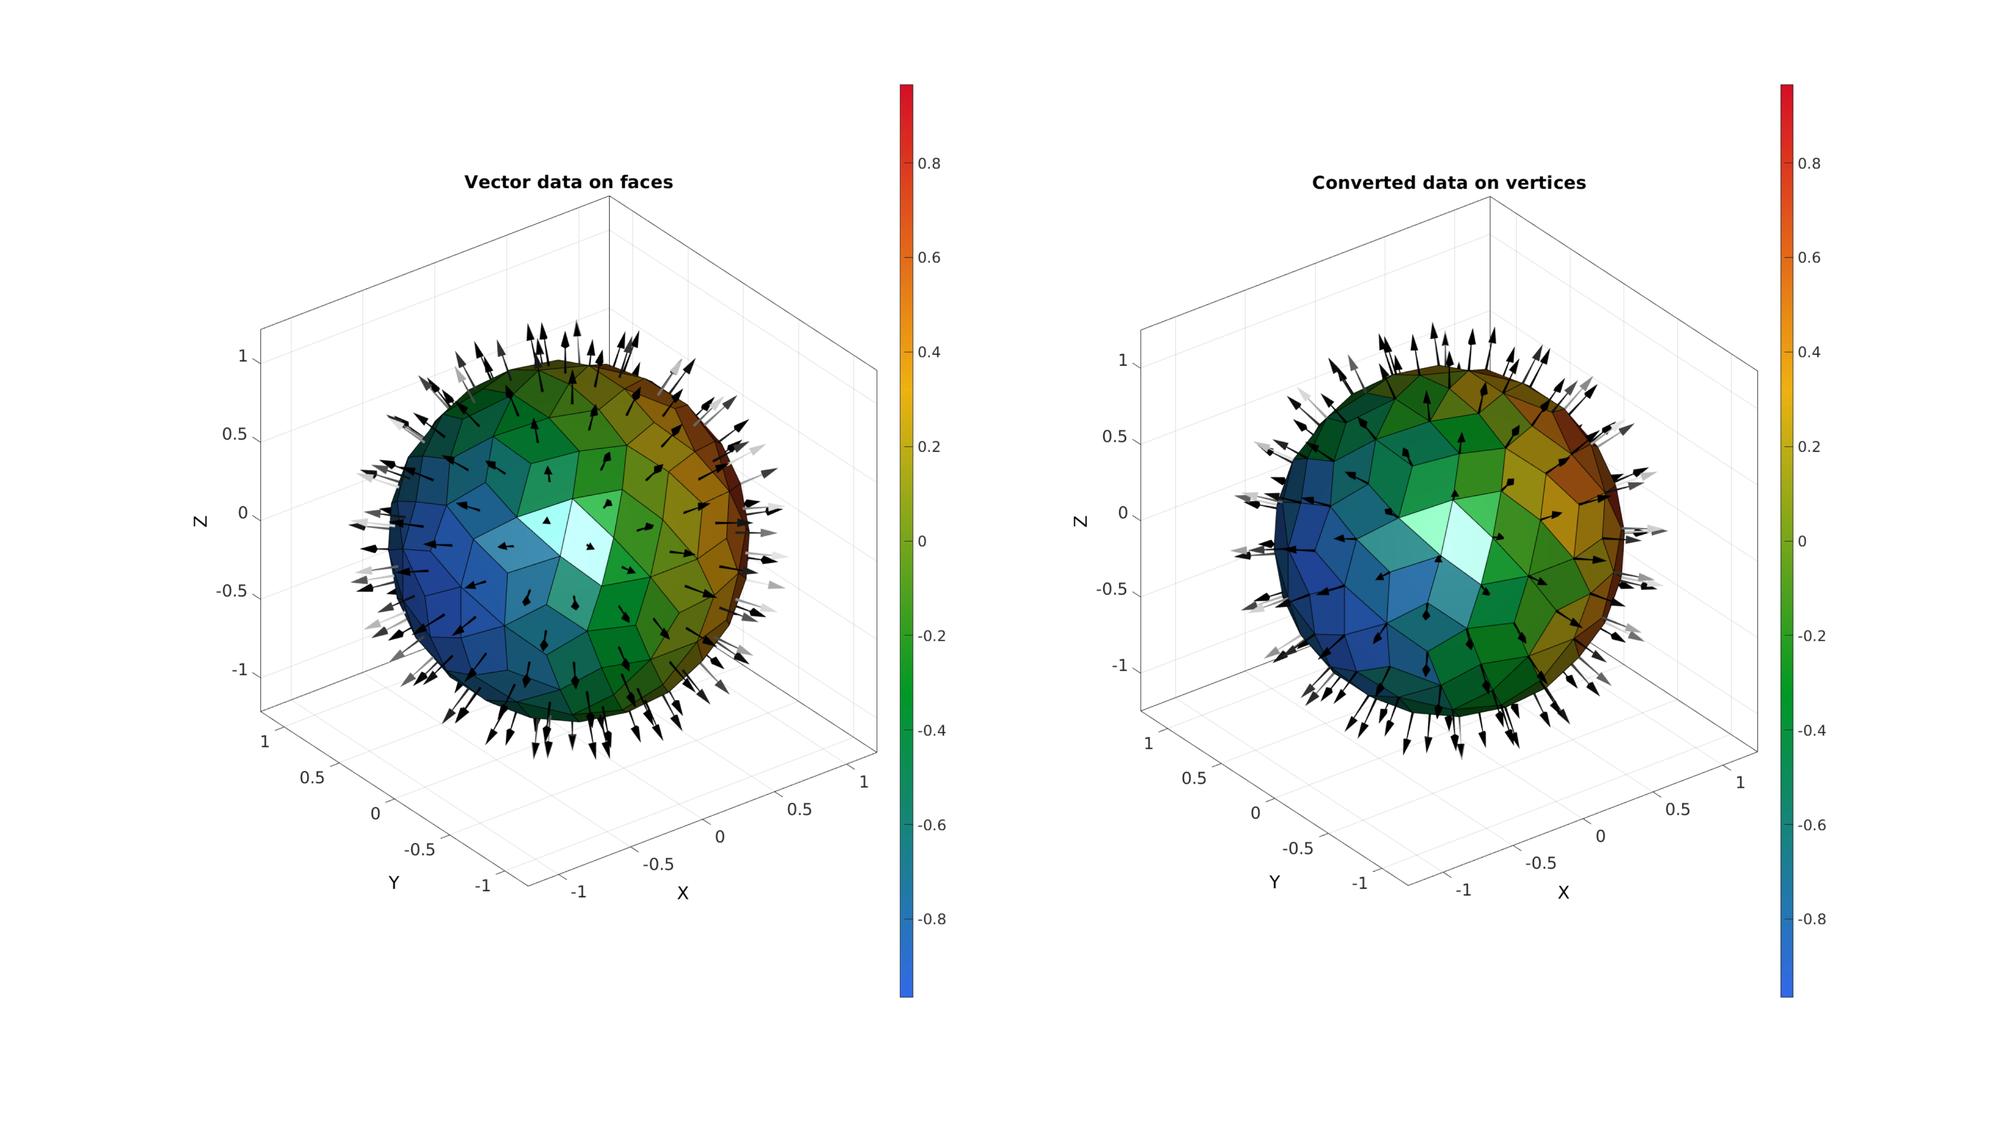
Example 3: Convert multi-dimensional face data (e.g. on a mixed mesh) to vertex data
N=patchNormal(F,V); %get face normals
NV=faceToVertexMeasure(F,V,N); %Convert to vertex normals
VF=patchCentre(F,V); %Get face centres for plotting

cFigure;
subplot(1,2,1); hold on;
title('Vector data on faces')
gpatch(F,V,CF);
for q=1:1:numel(F)
    quiverVec(VF{q},N{q},0.25,'k');
end
colormap gjet; colorbar;
axisGeom;
camlight headlight;

subplot(1,2,2); hold on;
title('Converted data on vertices')
gpatch(F,V,CV);
quiverVec(V,NV,0.25,'k');
colormap gjet; colorbar;
axisGeom;
camlight headlight;
drawnow;

GIBBON www.gibboncode.org
Kevin Mattheus Moerman, [email protected]
GIBBON footer text
License: https://github.com/gibbonCode/GIBBON/blob/master/LICENSE
GIBBON: The Geometry and Image-based Bioengineering add-On. A toolbox for image segmentation, image-based modeling, meshing, and finite element analysis.
Copyright (C) 2019 Kevin Mattheus Moerman
This program is free software: you can redistribute it and/or modify it under the terms of the GNU General Public License as published by the Free Software Foundation, either version 3 of the License, or (at your option) any later version.
This program is distributed in the hope that it will be useful, but WITHOUT ANY WARRANTY; without even the implied warranty of MERCHANTABILITY or FITNESS FOR A PARTICULAR PURPOSE. See the GNU General Public License for more details.
You should have received a copy of the GNU General Public License along with this program. If not, see http://www.gnu.org/licenses/.