element2lattice
Below is a demonstration of the features of the element2lattice function
Contents
- Syntax
- Description
- Examples
- Example: Creating a lattice structure on a hexahedral element
- Example: Different lattice sides
- Example: Refining the lattice structure
- Example: Creating a lattice structure on tetrahedral elements
- Example: Different lattice sides
- Example: Changing lattice strut thickness (and porosity)
- Example: Changing output surface mesh type
- Example: Exporting hexahedral elements instead of surface elements
- Example: Creating lattice structure variations through input mesh conversion/subdevission
- Example: Create lattice structures on arbitry input meshes
clear; close all; clc;
Syntax
[Es,Vs,Cs]=element2lattice(E,V,cPar);
Description
This function converts an element description (elements and vertices i.e nodes into a lattice structure. The lattice structure is returned as a hexahederal mesh.
Examples
Plot settings
cMap=gjet(4);
fontSize=15;
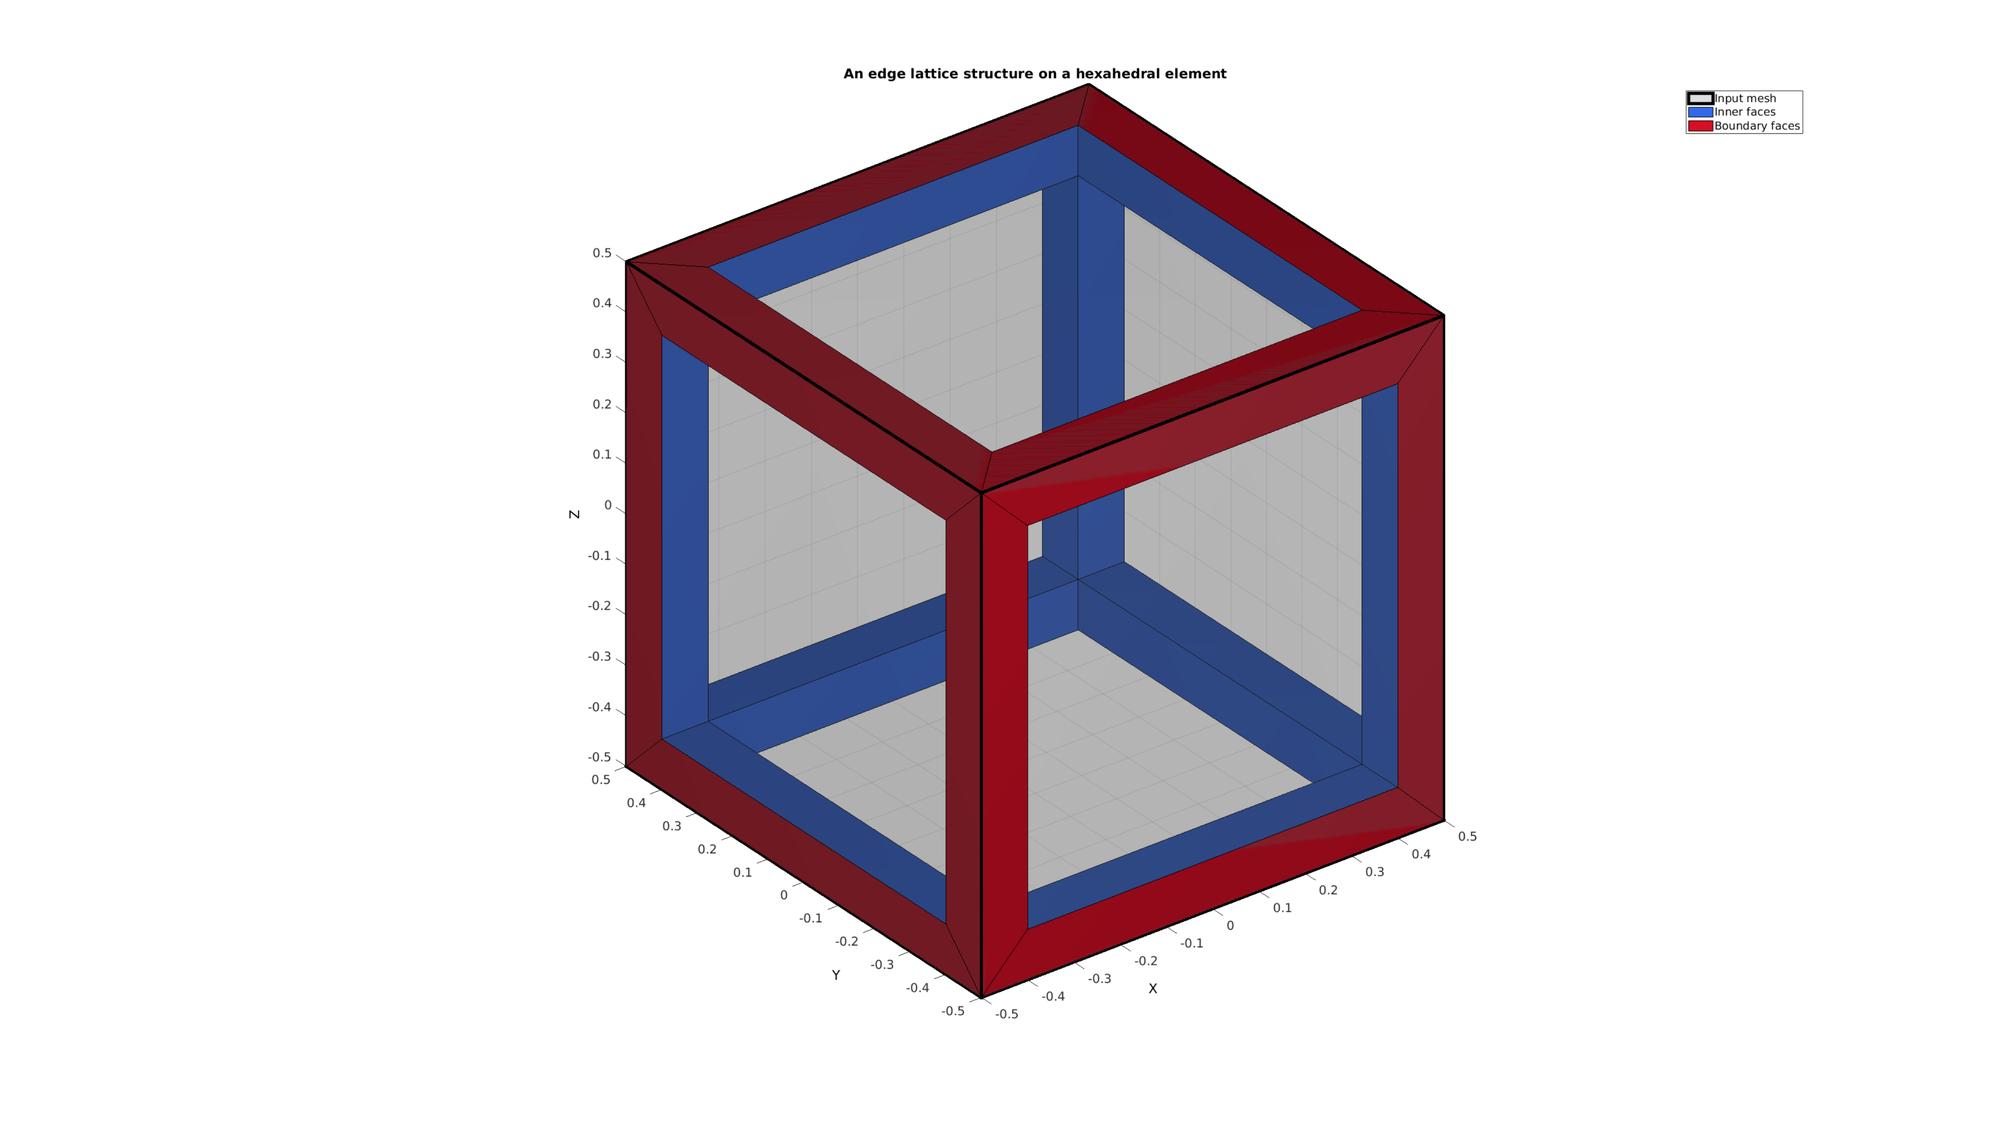
Example: Creating a lattice structure on a hexahedral element
Creating example geometry.
boxDim=[1 1 1];
boxEl=[1 1 1];
[meshStruct]=hexMeshBox(boxDim,boxEl);
E=meshStruct.E;
V=meshStruct.V;
F=meshStruct.F;
[indBoundary]=tesBoundary(F,V);
Create lattice structure
controlParameter.shrinkFactor=0.2; %Strut sides are formed by shrinking the input mesh faces by this factor
controlParameter.numDigitKeep=5; %used for merging nodes
controlParameter.meshType='quad'; %desired output mesh type
controlParameter.indBoundary=indBoundary; %indices of the boundary faces

controlParameter.latticeSide=1; %1=side 1 the edge lattice, 2=side 2 the dual lattice to the edge lattice
[Fs1,Vs1,Cs1]=element2lattice(E,V,controlParameter); %Get lattice structure
Visualizing input mesh and lattice structures
cFigure;
title('An edge lattice structure on a hexahedral element','fontSize',fontSize)
hold on;
hp1=gpatch(F,V,0.5*ones(1,3),'k',0.25,4);
hp2=gpatch(Fs1(Cs1==0,:),Vs1,Cs1(Cs1==0));
hp3=gpatch(Fs1(Cs1==1,:),Vs1,Cs1(Cs1==1));
legend([hp1,hp2,hp3],'Input mesh','Inner faces','Boundary faces')
colormap(cMap);
cLim=caxis;
axisGeom(gca,fontSize);
camlight headlight; lighting flat;

drawnow;

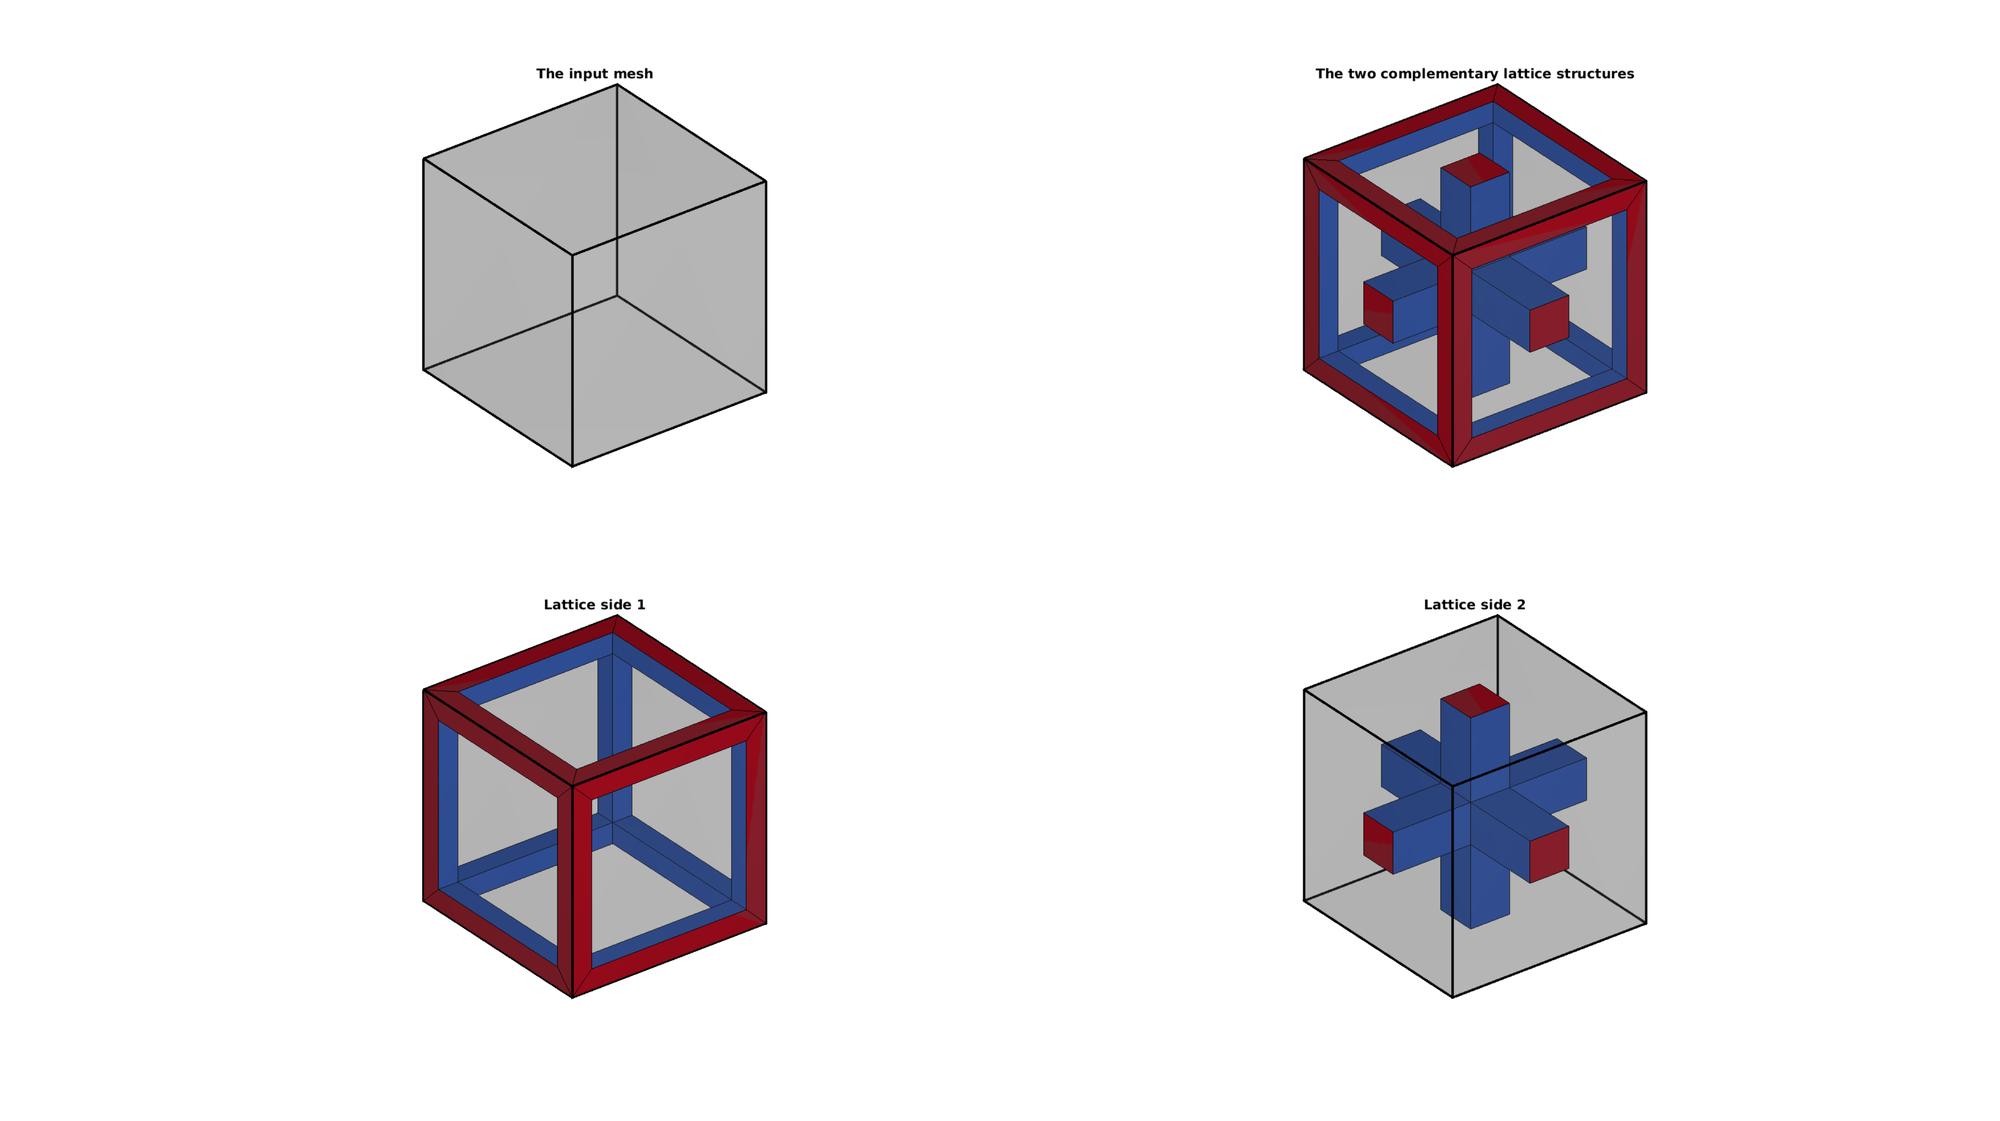
Example: Different lattice sides
Computer other "lattice side"
controlParameter.latticeSide=2; %1=side 1 the edge lattice, 2=side 2 the dual lattice to the edge lattice
[Fs2,Vs2,Cs2]=element2lattice(E,V,controlParameter); %Get lattice structure
Visualizing input mesh and lattice structures
cFigure;
hs=subplot(2,2,1);
title('The input mesh','fontSize',fontSize)
hold on;
gpatch(F,V,0.5*ones(1,3),'k',0.25,3);
axisGeom(gca,fontSize);
camlight headlight; lighting flat;
ha=axis; axis off;

subplot(2,2,2);
title('The two complementary lattice structures','fontSize',fontSize)
hold on;
gpatch(F,V,0.5*ones(1,3),'k',0.25,3);
gpatch(Fs1,Vs1,Cs1);
gpatch(Fs2,Vs2,Cs2);
colormap(cMap);
cLim=caxis;
axisGeom(gca,fontSize);
camlight headlight; lighting flat;
axis(ha); axis off;

subplot(2,2,3);
title('Lattice side 1','fontSize',fontSize)
hold on;
gpatch(F,V,0.5*ones(1,3),'k',0.25,3);
gpatch(Fs1,Vs1,Cs1);
colormap(cMap);
caxis(cLim);
axisGeom(gca,fontSize);
camlight headlight; lighting flat;
axis(ha); axis off;

subplot(2,2,4);
title('Lattice side 2','fontSize',fontSize)
hold on;
gpatch(F,V,0.5*ones(1,3),'k',0.25,3);
gpatch(Fs2,Vs2,Cs2);
colormap(cMap);
caxis(cLim);
axisGeom(gca,fontSize);
camlight headlight; lighting flat;
axis(ha); axis off;

drawnow;
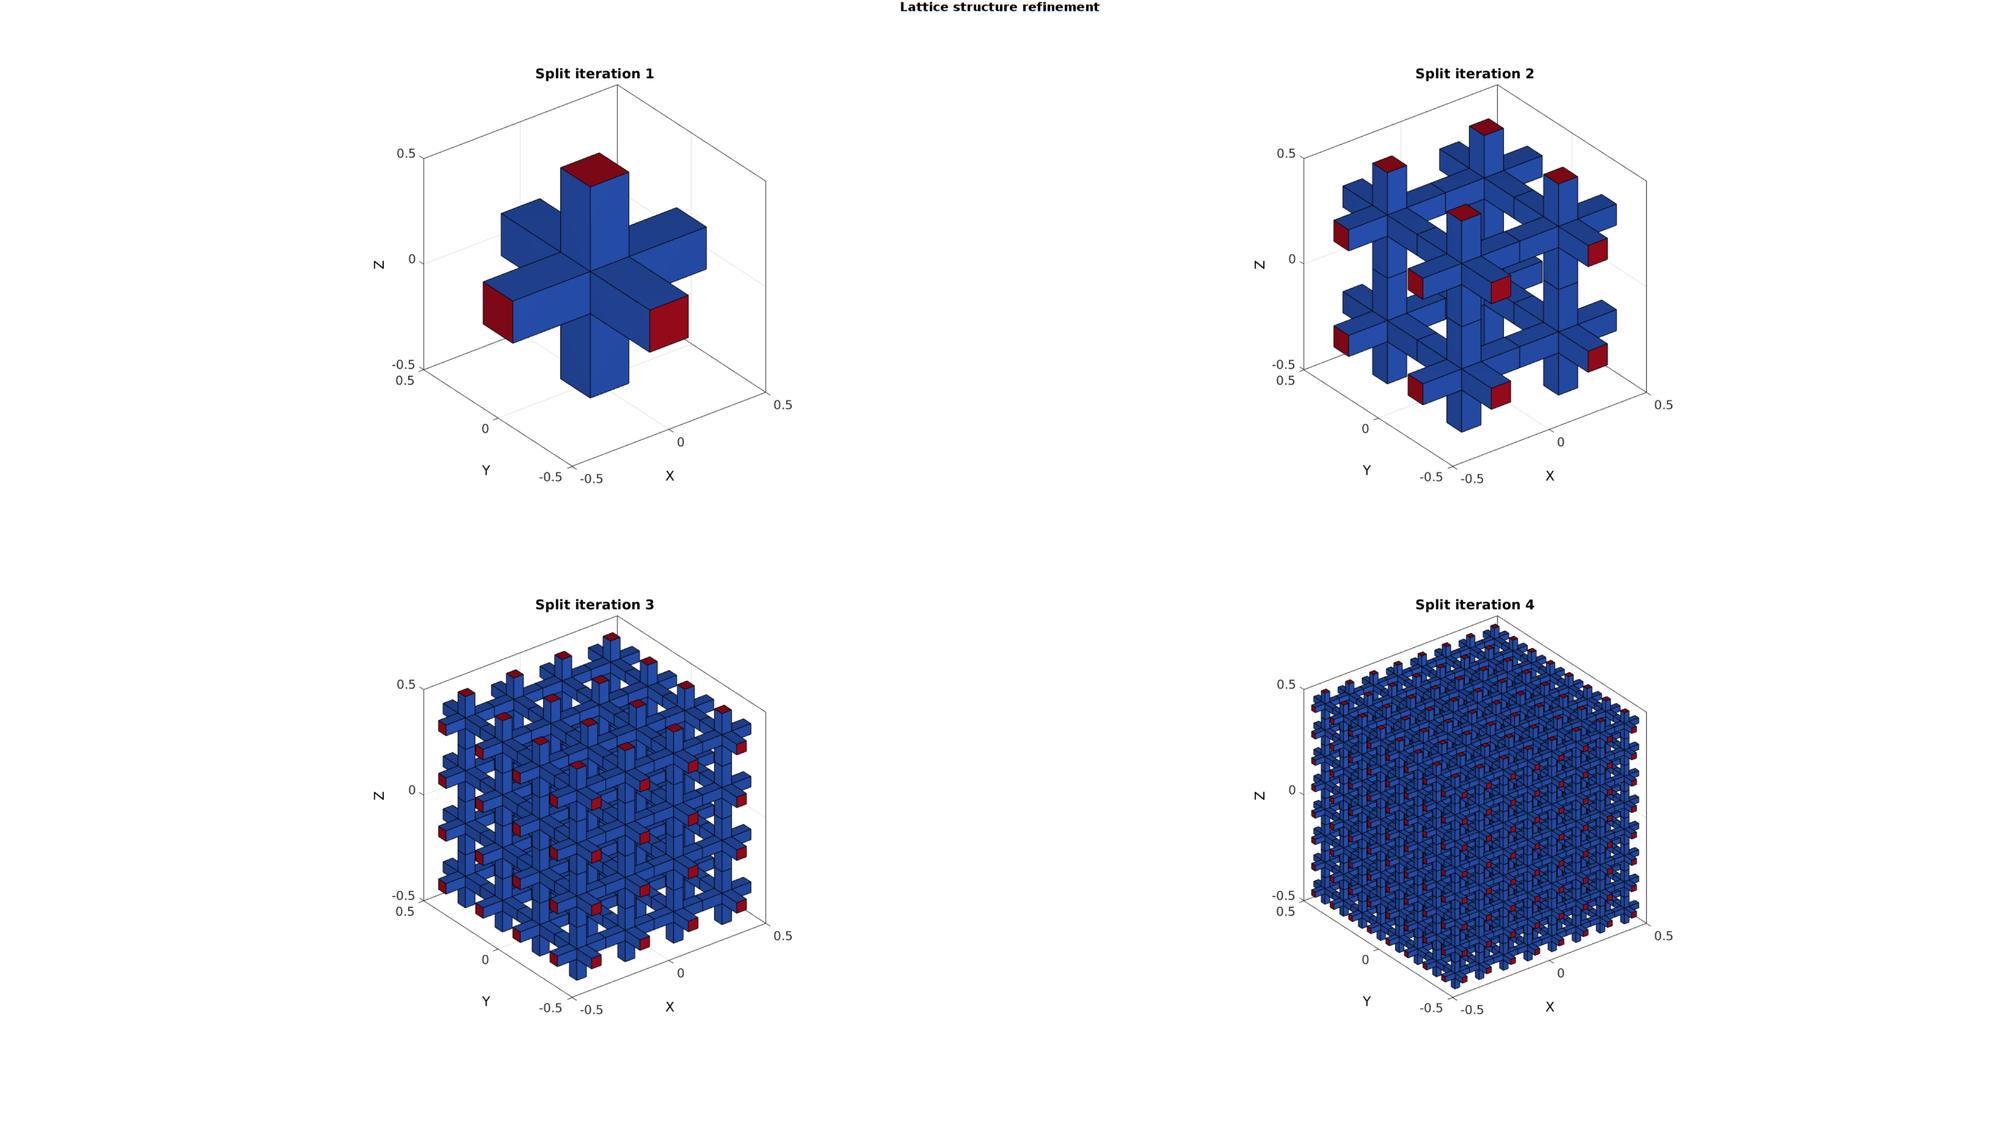
Example: Refining the lattice structure
Refining a lattice structure by first refining the input mesh
cFigure;
gtitle('Lattice structure refinement',fontSize);

for q=1:4
    if q>1
        [E,V]=subHex(E,V,1); %Refine input mesh
        [F]=element2patch(E); %Patch data for plotting
        [indBoundary]=tesBoundary(F,V);
        controlParameter.indBoundary=indBoundary; %indices of the boundary faces
    end

    [Fs1,Vs1,Cs1]=element2lattice(E,V,controlParameter); %Get lattice structure

    % Visualizing input mesh and lattice structures

    subplot(2,2,q);
    hold on; title(['Split iteration ',num2str(q)]);
    gpatch(Fs1,Vs1,Cs1);
    colormap(cMap);
    axisGeom(gca,fontSize);
    camlight headlight; lighting flat;

end
drawnow;

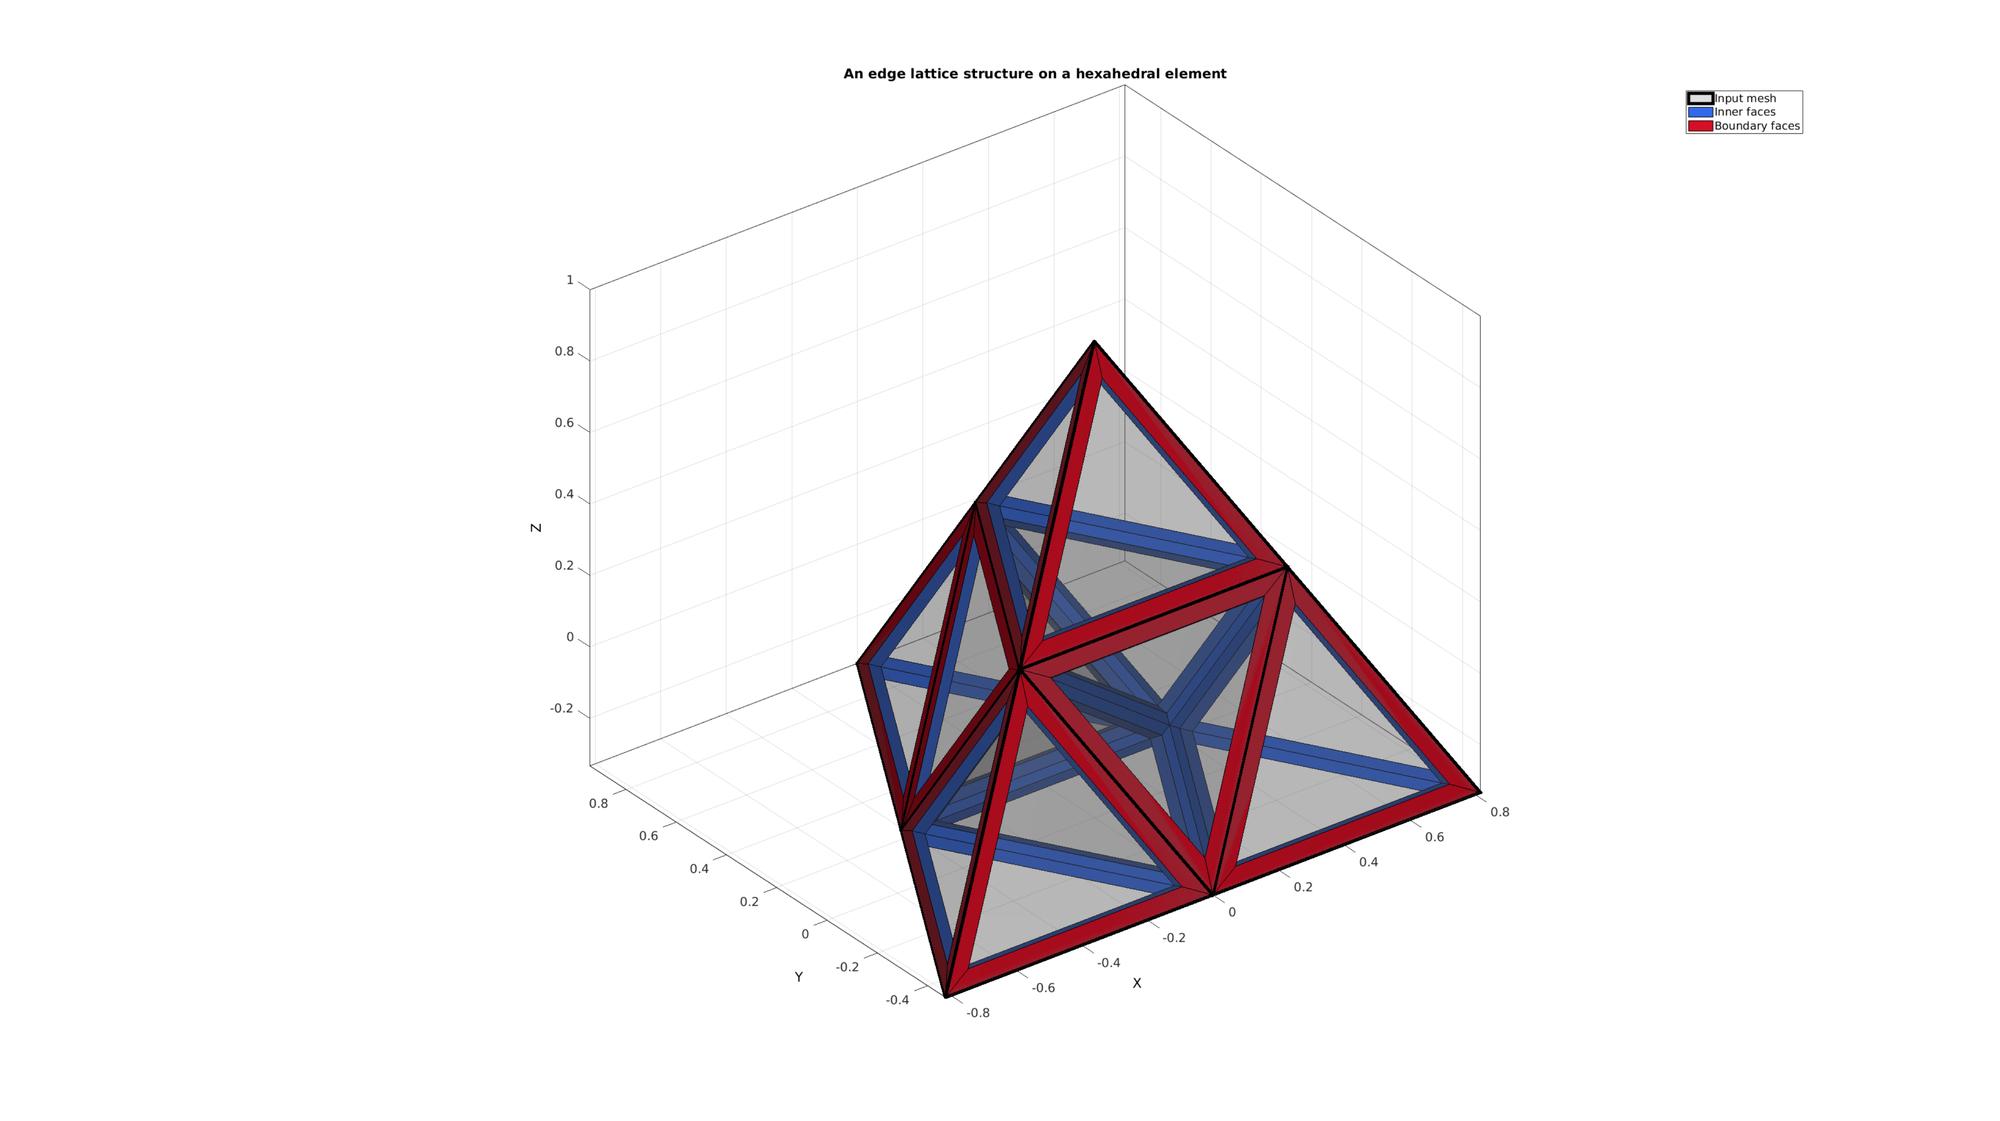
Example: Creating a lattice structure on tetrahedral elements
Creating example geometry.
[V,~]=platonic_solid(1,1); %A single tetrahedron
E=[2 3 4 1]; %The element description
[E,V]=subTet(E,V,1); %Refine the tetrahedron once
[F]=element2patch(E); %Patch data for plotting
[indBoundary]=tesBoundary(F,V); %Get boundary face indices
Create lattice structure
controlParameter.shrinkFactor=0.2; %Strut sides are formed by shrinking the input mesh faces by this factor
controlParameter.numDigitKeep=5; %used for merging nodes
controlParameter.meshType='quad'; %desired output mesh type
controlParameter.indBoundary=indBoundary; %indices of the boundary faces

controlParameter.latticeSide=1; %1=side 1 the edge lattice, 2=side 2 the dual lattice to the edge lattice
[Fs1,Vs1,Cs1]=element2lattice(E,V,controlParameter); %Get lattice structure
Visualizing input mesh and lattice structures
cFigure;
title('An edge lattice structure on a hexahedral element','fontSize',fontSize)
hold on;
hp1=gpatch(F,V,0.5*ones(1,3),'k',0.25,4);
hp2=gpatch(Fs1(Cs1==0,:),Vs1,Cs1(Cs1==0));
hp3=gpatch(Fs1(Cs1==1,:),Vs1,Cs1(Cs1==1));
legend([hp1,hp2,hp3],'Input mesh','Inner faces','Boundary faces')
colormap(cMap);
cLim=caxis;
axisGeom(gca,fontSize);
camlight headlight; lighting flat;

drawnow;
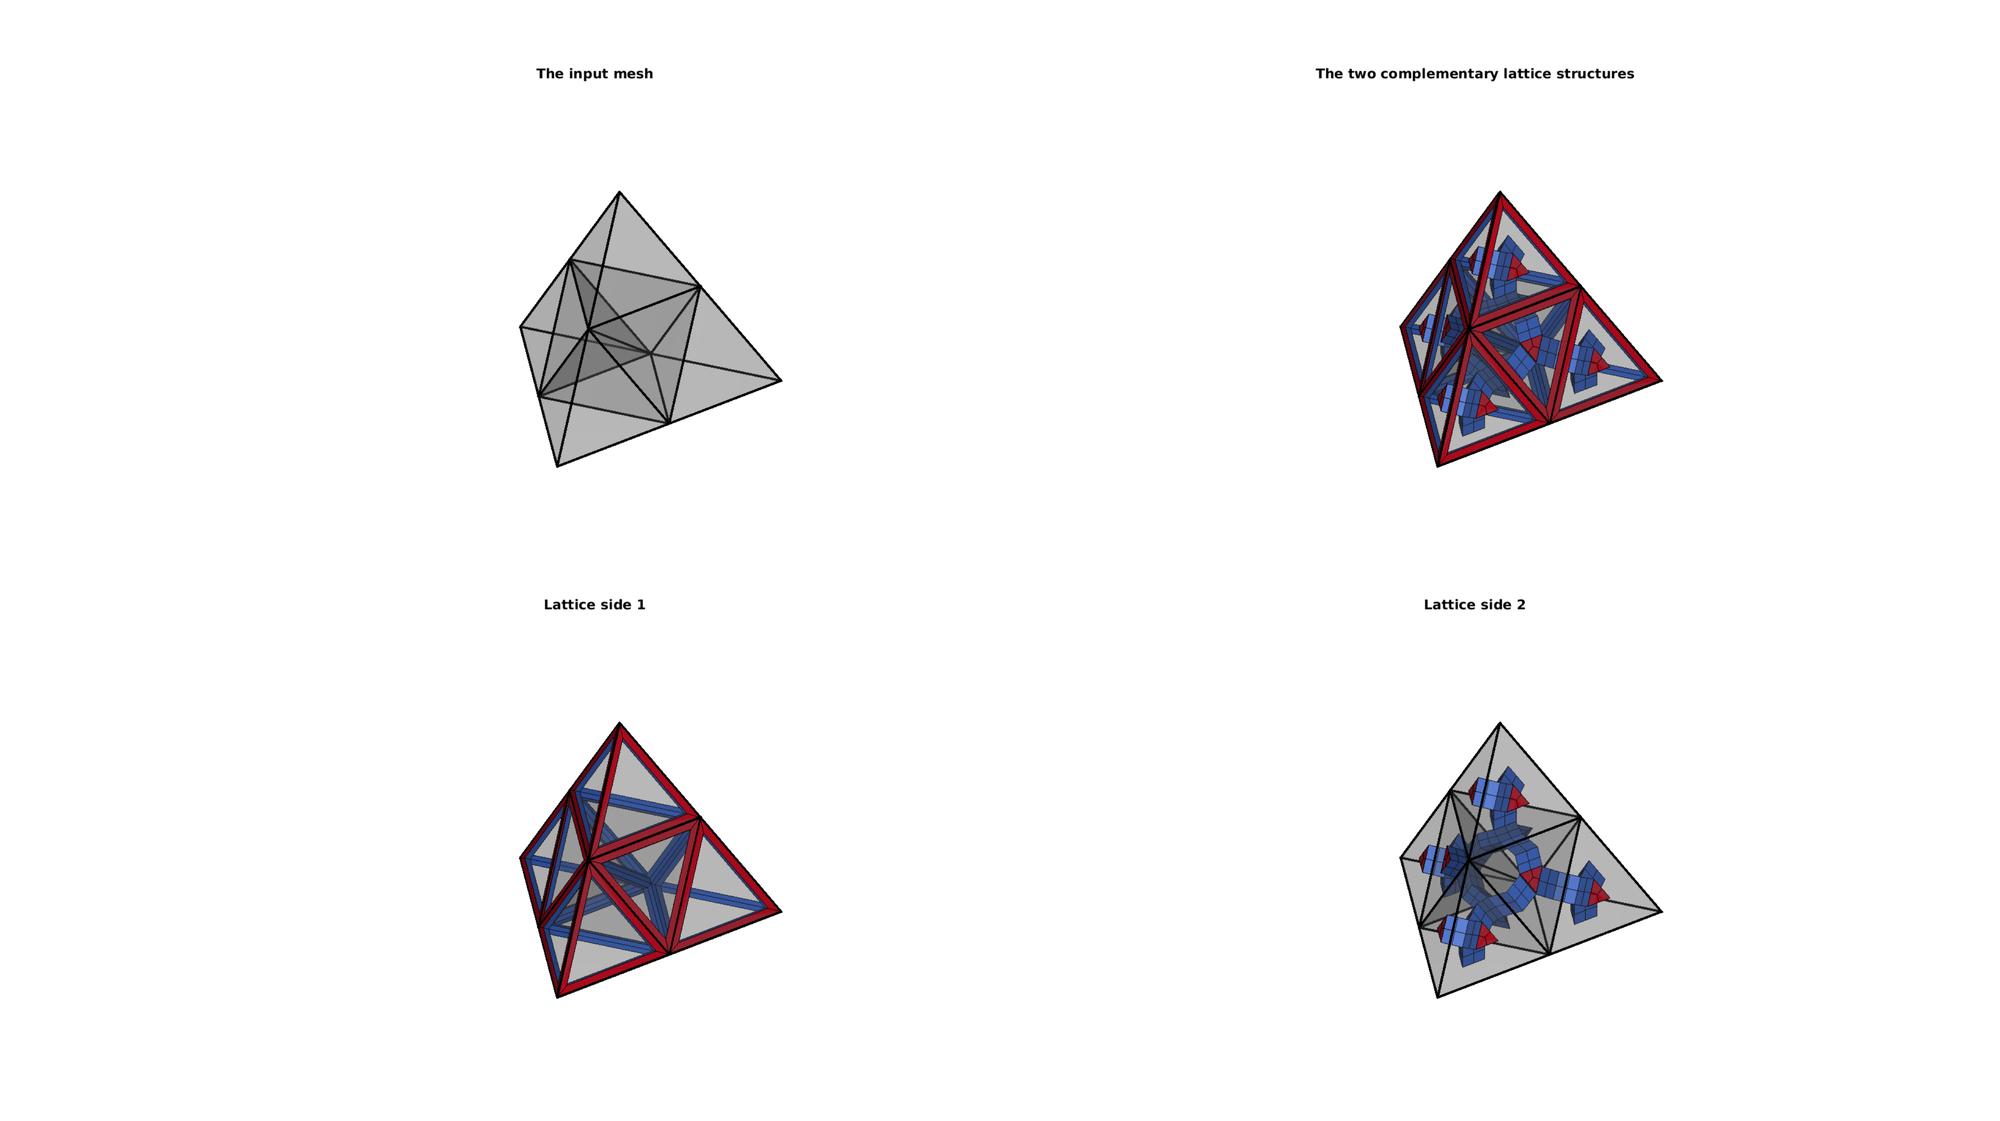
Example: Different lattice sides
Computer other "lattice side"
controlParameter.latticeSide=2; %1=side 1 the edge lattice, 2=side 2 the dual lattice to the edge lattice
[Fs2,Vs2,Cs2]=element2lattice(E,V,controlParameter); %Get lattice structure
Visualizing input mesh and lattice structures
cFigure;
hs=subplot(2,2,1);
title('The input mesh','fontSize',fontSize)
hold on;
gpatch(F,V,0.5*ones(1,3),'k',0.25,3);
axisGeom(gca,fontSize);
camlight headlight; lighting flat;
ha=axis; axis off;

subplot(2,2,2);
title('The two complementary lattice structures','fontSize',fontSize)
hold on;
gpatch(F,V,0.5*ones(1,3),'k',0.25,3);
gpatch(Fs1,Vs1,Cs1);
gpatch(Fs2,Vs2,Cs2);
colormap(cMap);
cLim=caxis;
axisGeom(gca,fontSize);
camlight headlight; lighting flat;
axis(ha); axis off;

subplot(2,2,3);
title('Lattice side 1','fontSize',fontSize)
hold on;
gpatch(F,V,0.5*ones(1,3),'k',0.25,3);
gpatch(Fs1,Vs1,Cs1);
colormap(cMap);
caxis(cLim);
axisGeom(gca,fontSize);
camlight headlight; lighting flat;
axis(ha); axis off;

subplot(2,2,4);
title('Lattice side 2','fontSize',fontSize)
hold on;
gpatch(F,V,0.5*ones(1,3),'k',0.25,3);
gpatch(Fs2,Vs2,Cs2);
colormap(cMap);
caxis(cLim);
axisGeom(gca,fontSize);
camlight headlight; lighting flat;
axis(ha); axis off;

drawnow;

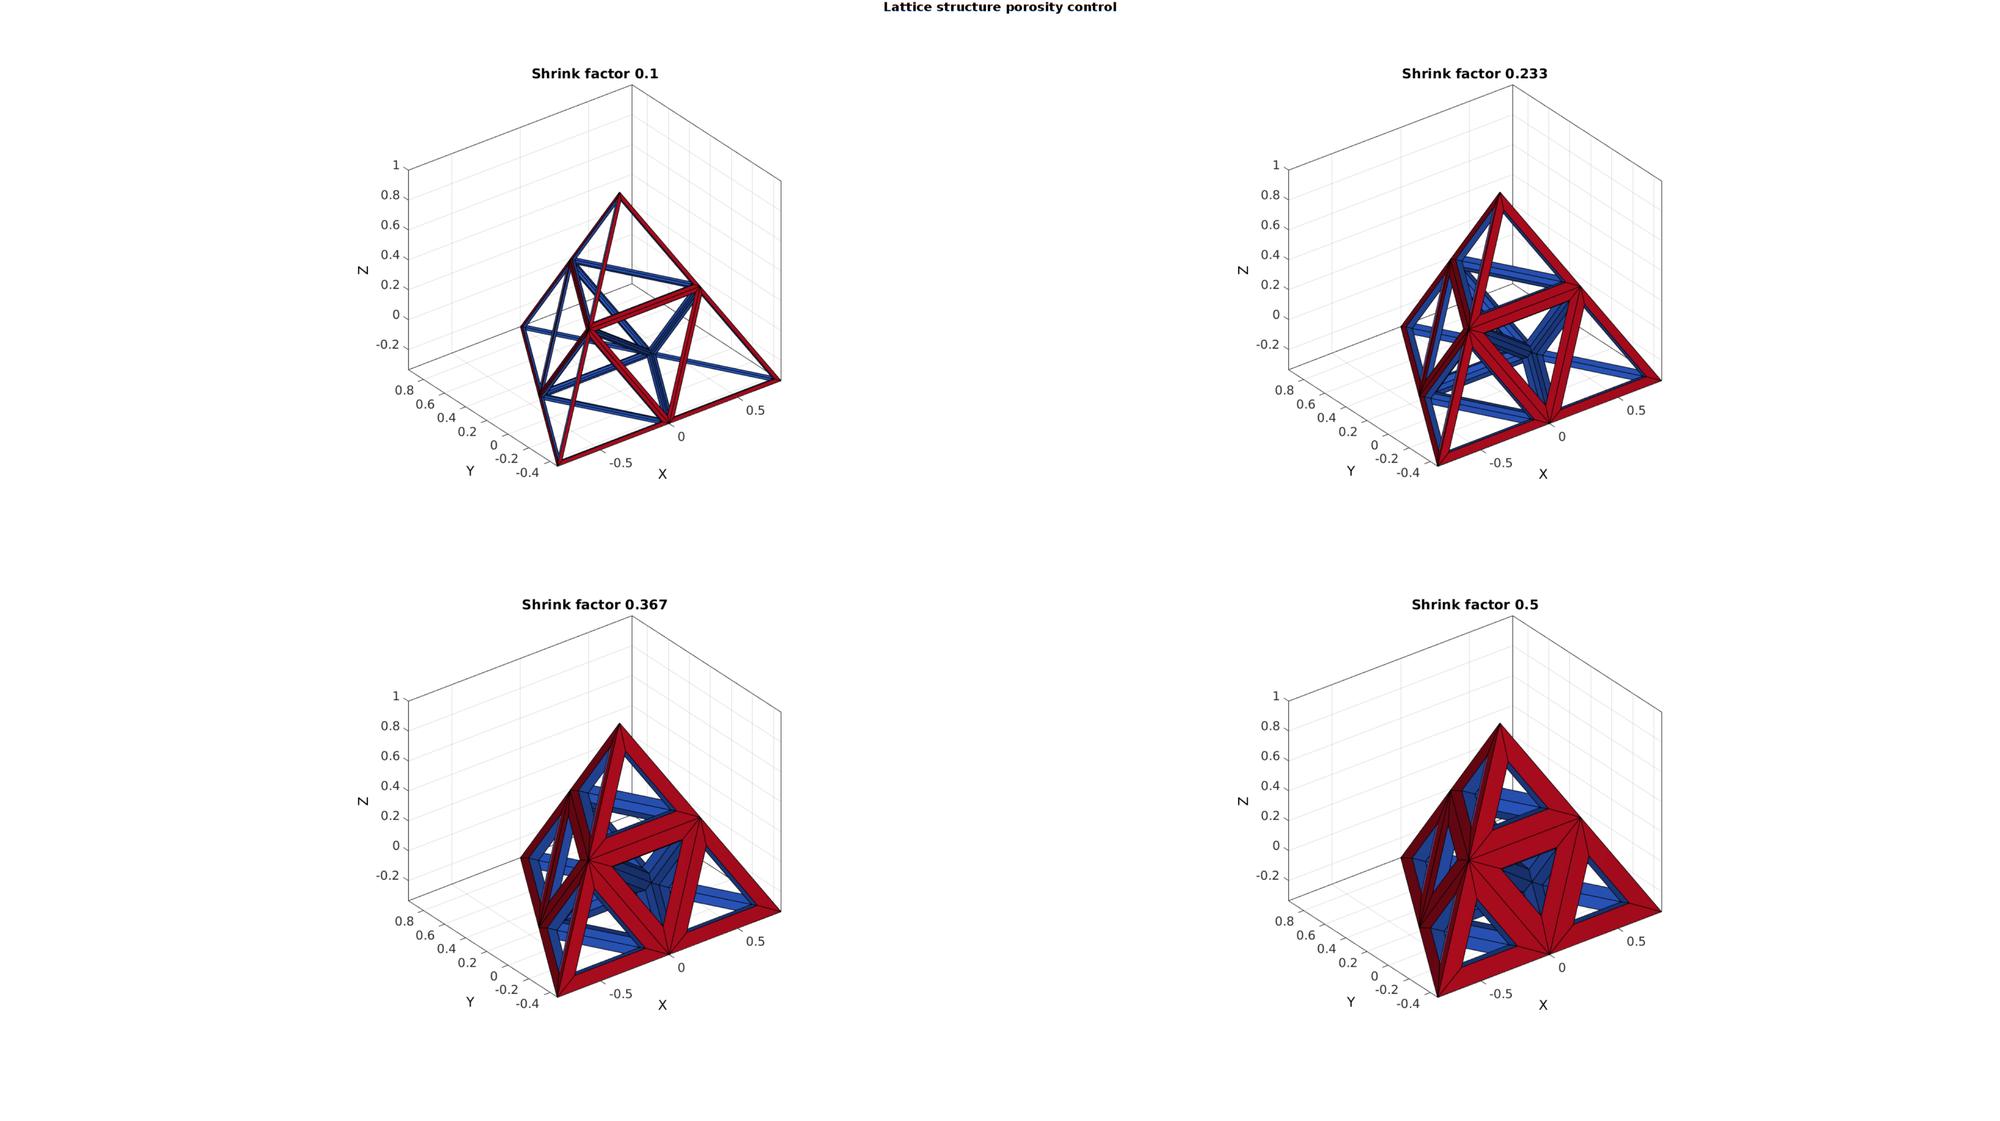
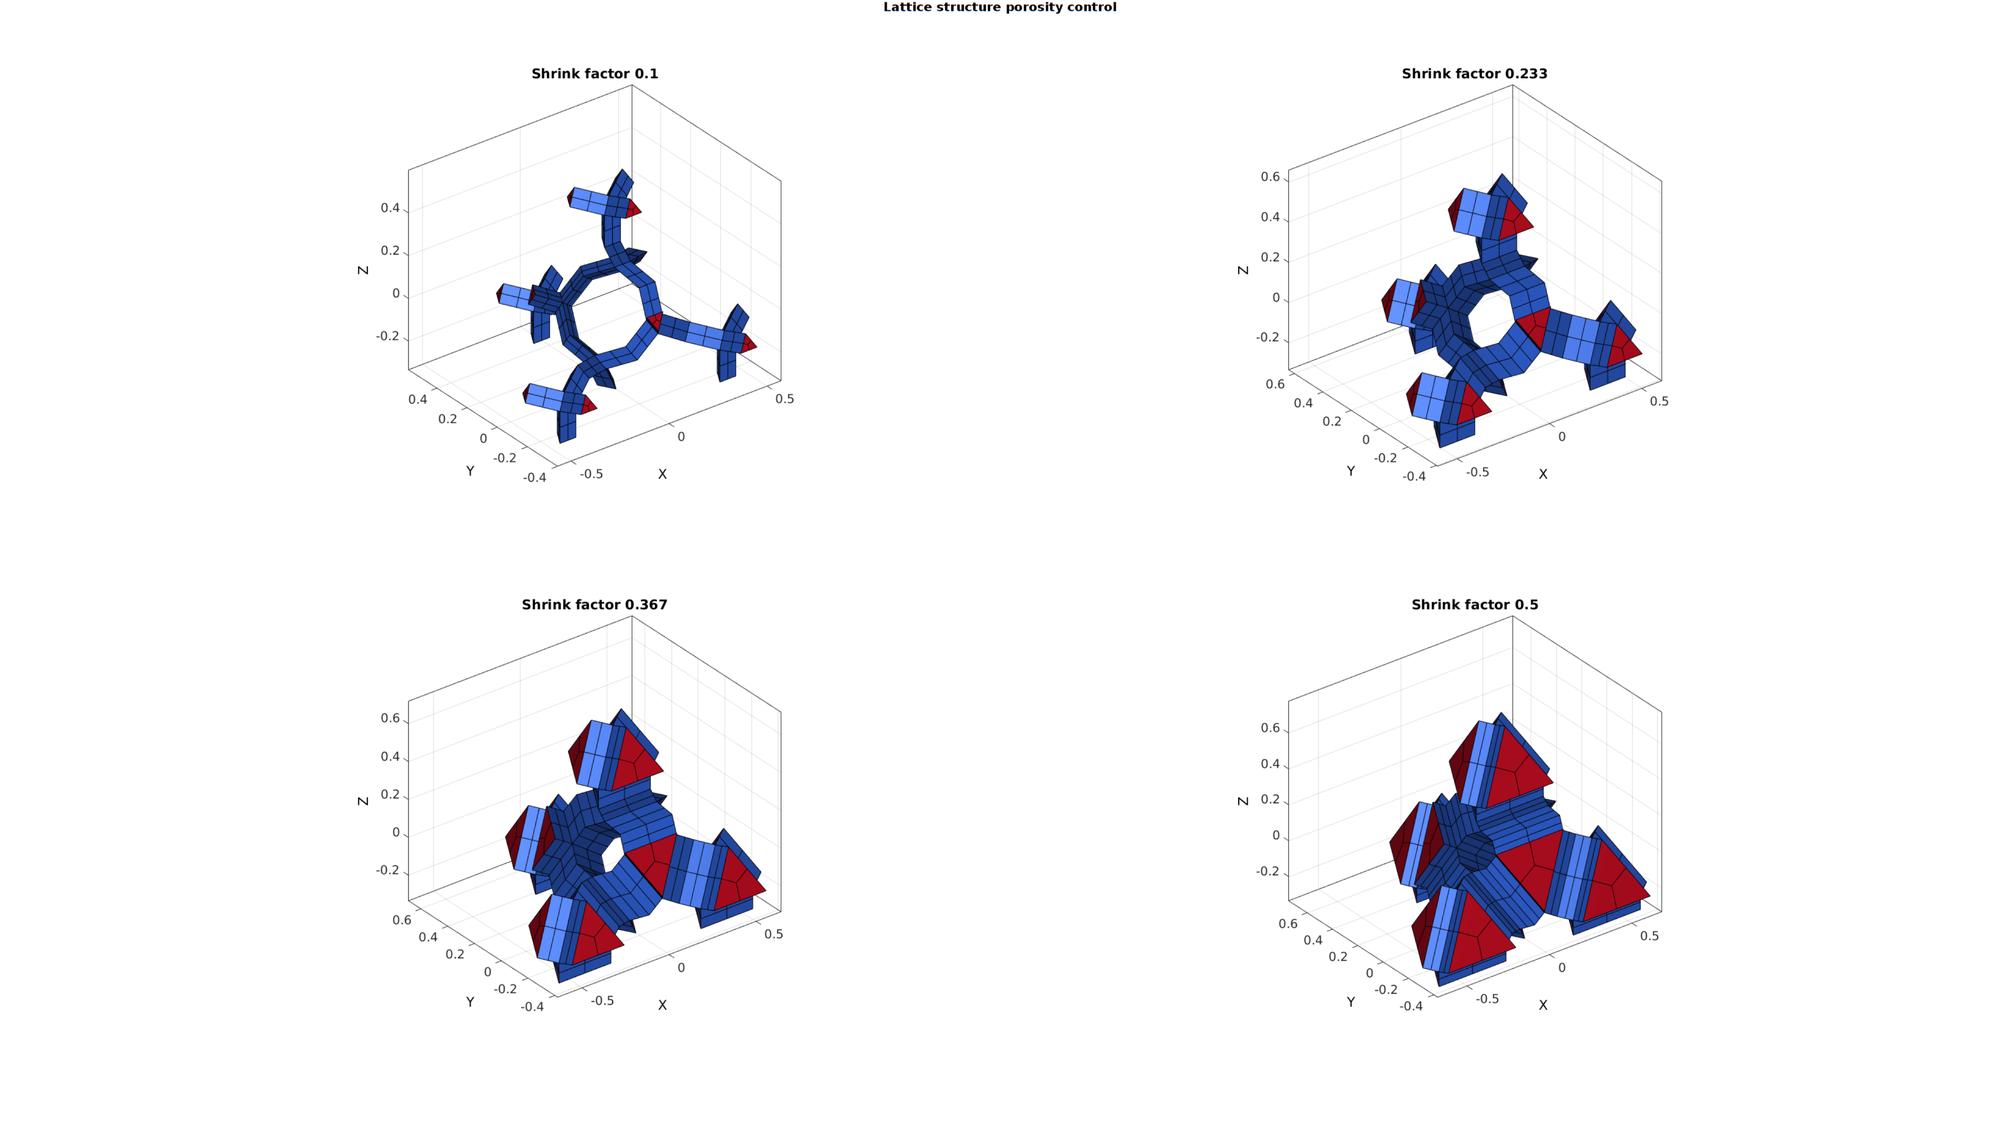
Example: Changing lattice strut thickness (and porosity)
The strut thickness of the lattice depends on the shrinkfactor.
% Create lattice structure
controlParameter.numDigitKeep=5; %used for merging nodes
controlParameter.meshType='quad'; %desired output mesh type
controlParameter.indBoundary=indBoundary; %indices of the boundary faces

shrinkFactorSet=linspace(0.1,0.5,4);

for latticeSide=1:2
    controlParameter.latticeSide=latticeSide;
    cFigure;
    gtitle('Lattice structure porosity control',fontSize);

    for q=1:4
        controlParameter.shrinkFactor=shrinkFactorSet(q); %Strut sides are formed by shrinking the input mesh faces by this facto

        [Fs1,Vs1,Cs1]=element2lattice(E,V,controlParameter); %Get lattice structure

        % Visualizing input mesh and lattice structures
        subplot(2,2,q);
        hold on; title(['Shrink factor ',num2str(pround(shrinkFactorSet(q),3))]);
        gpatch(Fs1,Vs1,Cs1);
        colormap(cMap);
        axisGeom(gca,fontSize);
        camlight headlight; lighting flat;
    end
    drawnow;
end


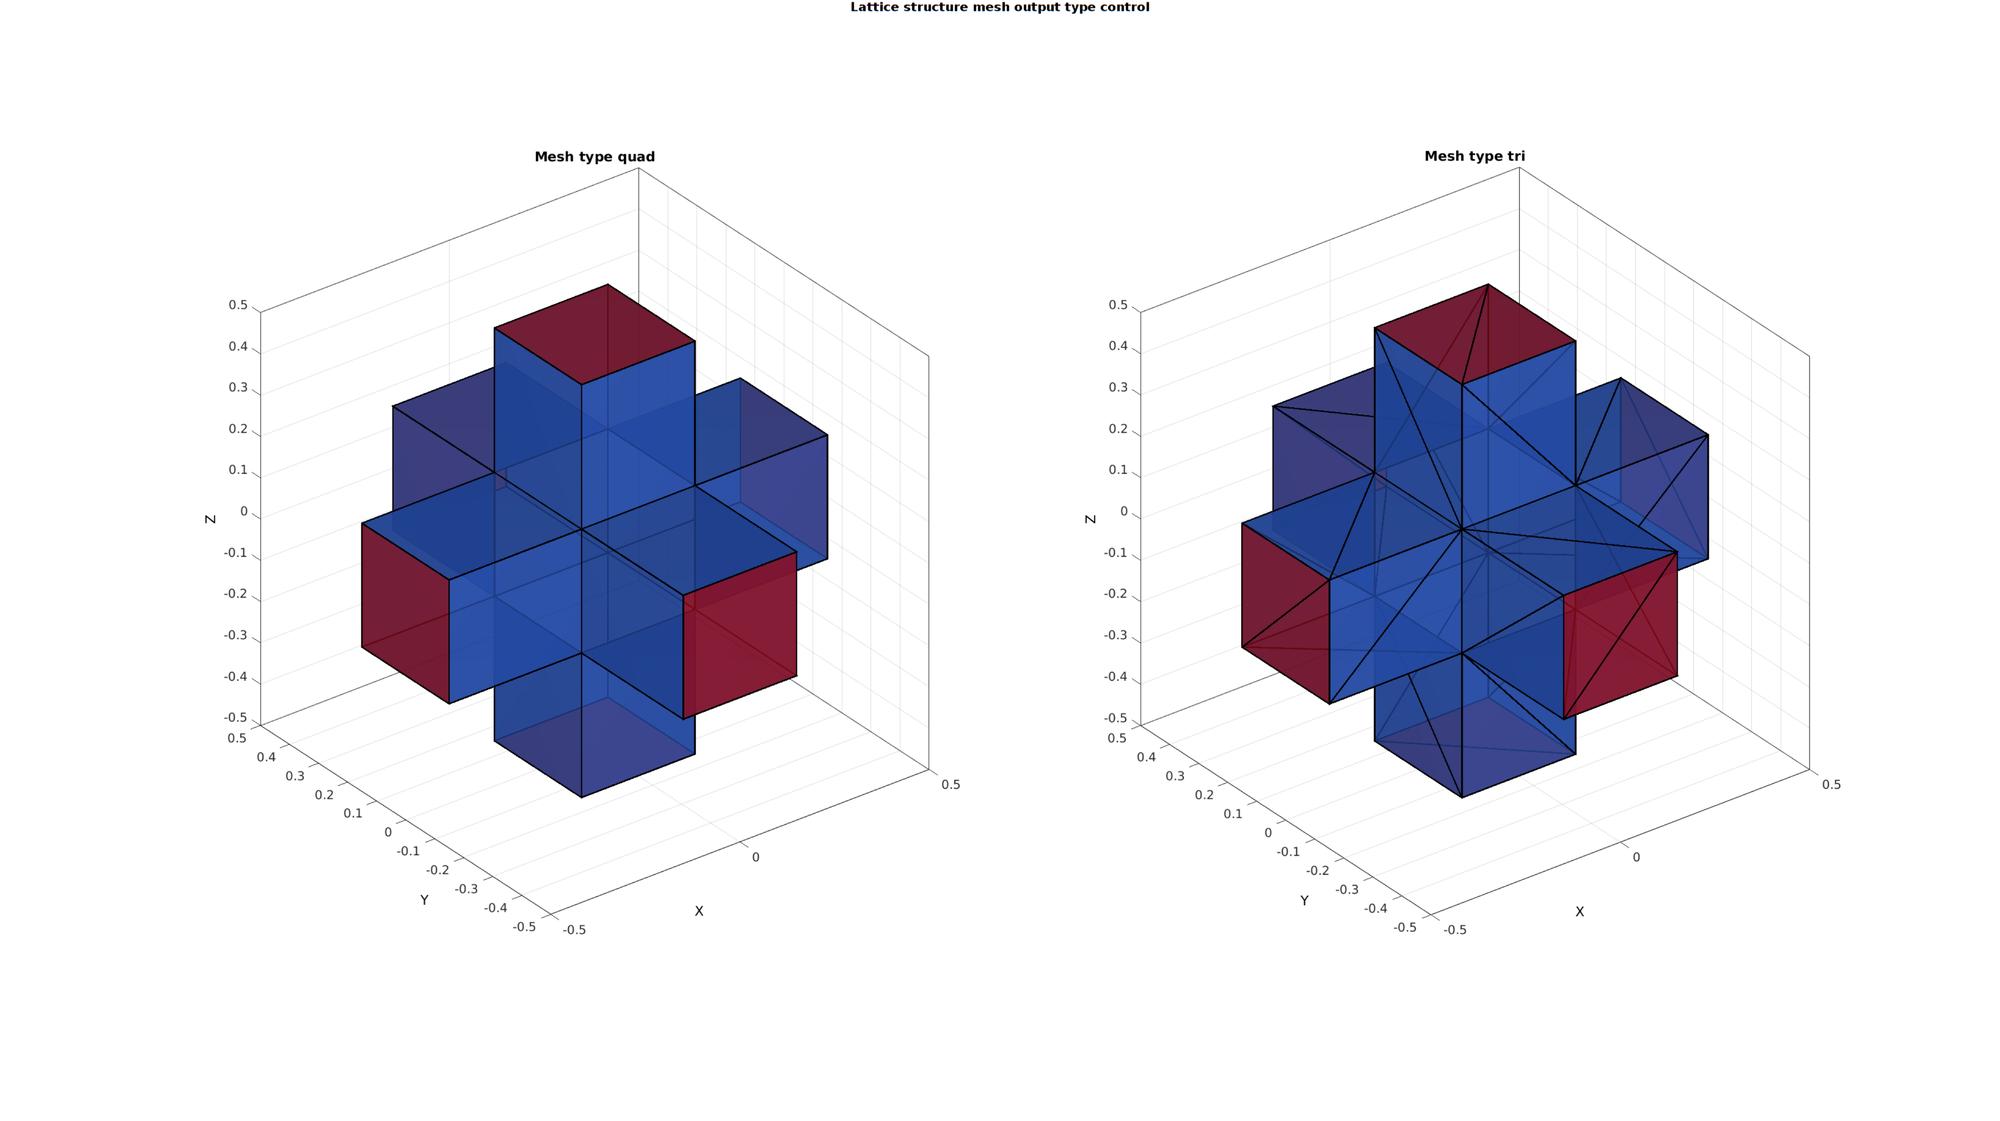
Example: Changing output surface mesh type
Different output mesh types are available i.e. quadrilateral and triangular faces and also hexahedral elements.
meshTypeSet={'quad','tri'};

boxDim=[1 1 1];
boxEl=[1 1 1];
[meshStruct]=hexMeshBox(boxDim,boxEl);
E=meshStruct.E;
V=meshStruct.V;
F=meshStruct.F;
[indBoundary]=tesBoundary(F,V);

clear controlParameter

% Create lattice structure
controlParameter.latticeSide=2;
controlParameter.numDigitKeep=5; %used for merging nodes
controlParameter.indBoundary=indBoundary; %indices of the boundary faces
controlParameter.shrinkFactor=0.3;

cFigure;
gtitle('Lattice structure mesh output type control',fontSize);

for q=1:numel(meshTypeSet)
    controlParameter.meshType=meshTypeSet{q}; %The current mesh type

    [Fs1,Vs1,Cs1]=element2lattice(E,V,controlParameter); %Get lattice structure

    % Visualizing input mesh and lattice structures
    subplot(1,numel(meshTypeSet),q);
    hold on; title(['Mesh type ',meshTypeSet{q}]);
    gpatch(Fs1,Vs1,Cs1,'k',0.8,2);
    colormap(gjet(250));
    axisGeom(gca,fontSize);
    camlight headlight; lighting flat;
end
drawnow;


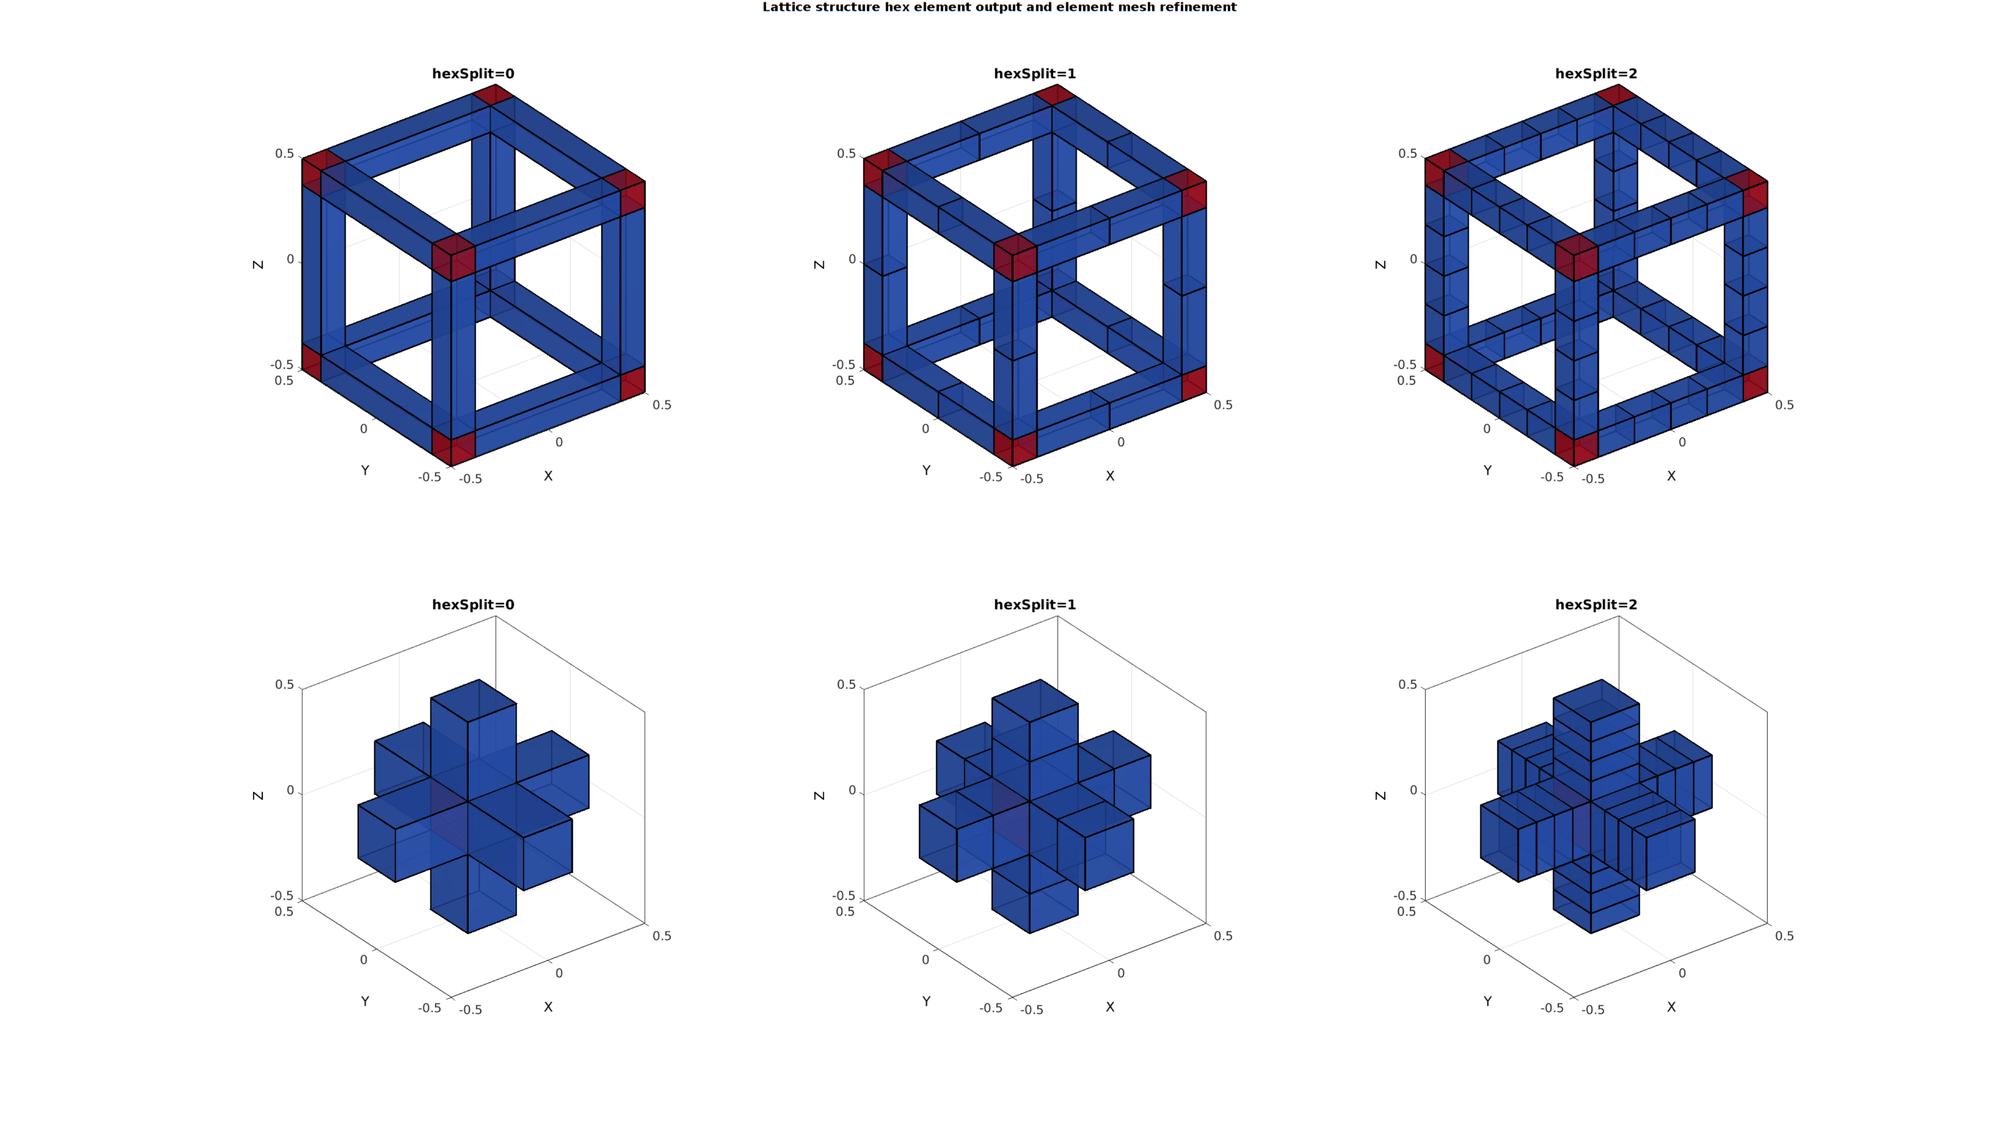
Example: Exporting hexahedral elements instead of surface elements
The element2patch function can also be used to export hexahedral elements directly by setting the meshType parameter to 'hex'. Furthermore, it is possible to subdevide the ellongated hexahedral elements using a certain number of split iterations. Below is an example of hexahedral element output with increasing number of split iterations used for the ellongated hexahedral elements.
boxDim=[1 1 1];
boxEl=[1 1 1];
[meshStruct]=hexMeshBox(boxDim,boxEl);
E=meshStruct.E;
V=meshStruct.V;
F=meshStruct.F;
[indBoundary]=tesBoundary(F,V);

clear controlParameter

% Create lattice structure
controlParameter.latticeSide=2;
controlParameter.numDigitKeep=5; %used for merging nodes
controlParameter.indBoundary=indBoundary; %indices of the boundary faces
controlParameter.shrinkFactor=0.25;
controlParameter.meshType='hex';

hexSplitSet=[0 1 2];
cFigure;
gtitle('Lattice structure hex element output and element mesh refinement',fontSize);

c=1; %counter for plotting
for latticeSide=1:2
    controlParameter.latticeSide=latticeSide;
    for q=1:numel(hexSplitSet)
        controlParameter.hexSplit=hexSplitSet(q); %The current mesh type

        [Es1,Vs1,Cs1]=element2lattice(E,V,controlParameter); %Get lattice structure

        [Fs1,Cs1F]=element2patch(Es1,Cs1); %Patch data for plotting

        % Visualizing input mesh and lattice structures
        subplot(2,numel(hexSplitSet),c);
        hold on; title(['hexSplit=',num2str(hexSplitSet(q))]);
        gpatch(Fs1,Vs1,Cs1F,'k',0.8,2);
        colormap(gjet(250));
        axisGeom(gca,fontSize);
        camlight headlight; lighting flat;
        c=c+1;
    end
end
drawnow;
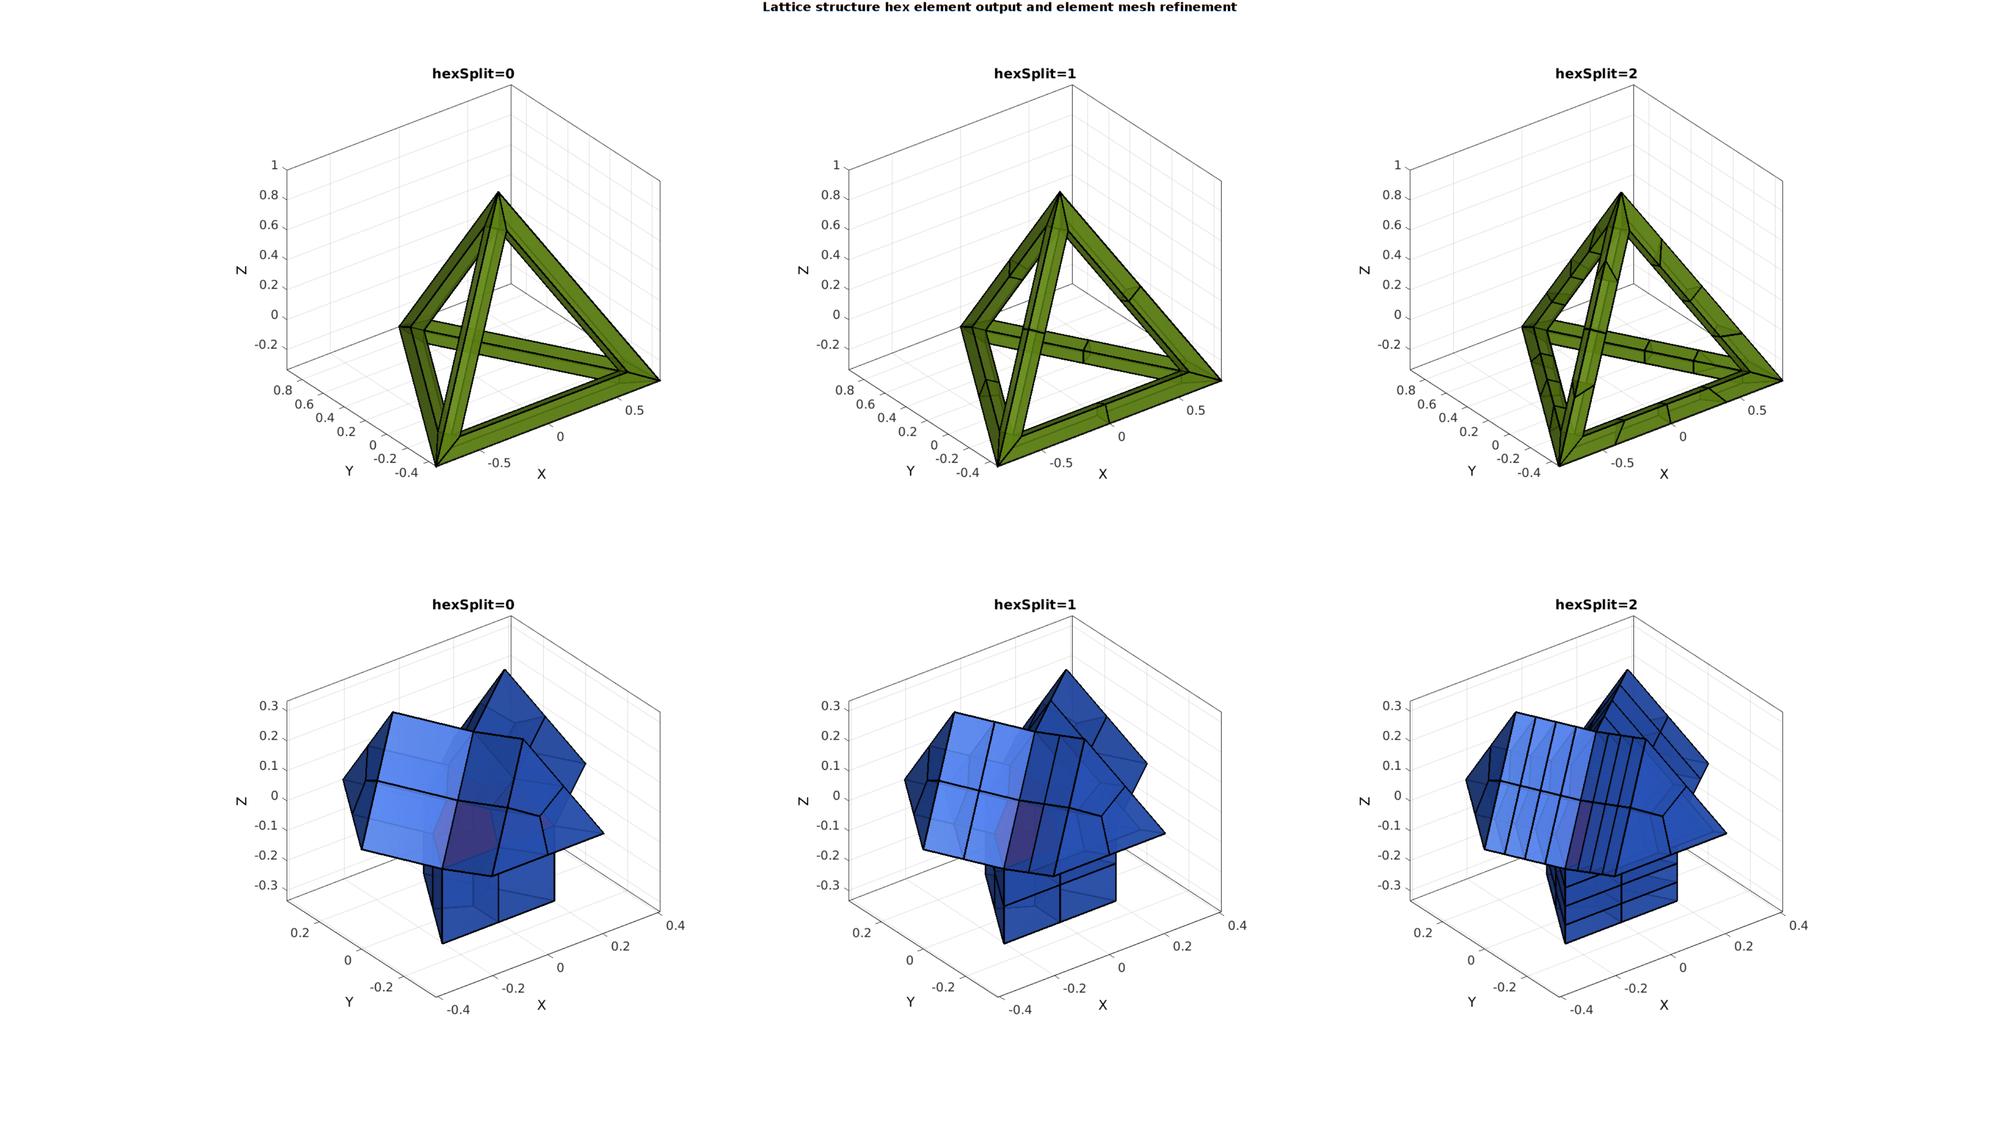
[V,F]=platonic_solid(1,1);
E=[1 2 4 3];

%
% boxDim=[1 1 1];
% boxEl=[1 1 1];
% [meshStruct]=hexMeshBox(boxDim,boxEl);
% E=meshStruct.E;
% V=meshStruct.V;
% F=meshStruct.F;
[indBoundary]=tesBoundary(F,V);

clear controlParameter

% Create lattice structure
controlParameter.latticeSide=2;
controlParameter.numDigitKeep=5; %used for merging nodes
controlParameter.indBoundary=indBoundary; %indices of the boundary faces
controlParameter.shrinkFactor=0.25;
controlParameter.meshType='hex';

hexSplitSet=[0 1 2];
cFigure;
gtitle('Lattice structure hex element output and element mesh refinement',fontSize);

c=1; %counter for plotting
for latticeSide=1:2
    controlParameter.latticeSide=latticeSide;
    for q=1:numel(hexSplitSet)
        controlParameter.hexSplit=hexSplitSet(q); %The current mesh type

        [Es1,Vs1,Cs1]=element2lattice(E,V,controlParameter); %Get lattice structure

        [Fs1,Cs1F]=element2patch(Es1,Cs1); %Patch data for plotting

        % Visualizing input mesh and lattice structures
        subplot(2,numel(hexSplitSet),c);
        hold on; title(['hexSplit=',num2str(hexSplitSet(q))]);
        gpatch(Fs1,Vs1,Cs1F,'k',0.8,2);
        colormap(gjet(250));
        axisGeom(gca,fontSize);
        camlight headlight; lighting flat;
        c=c+1;
    end
end
drawnow;

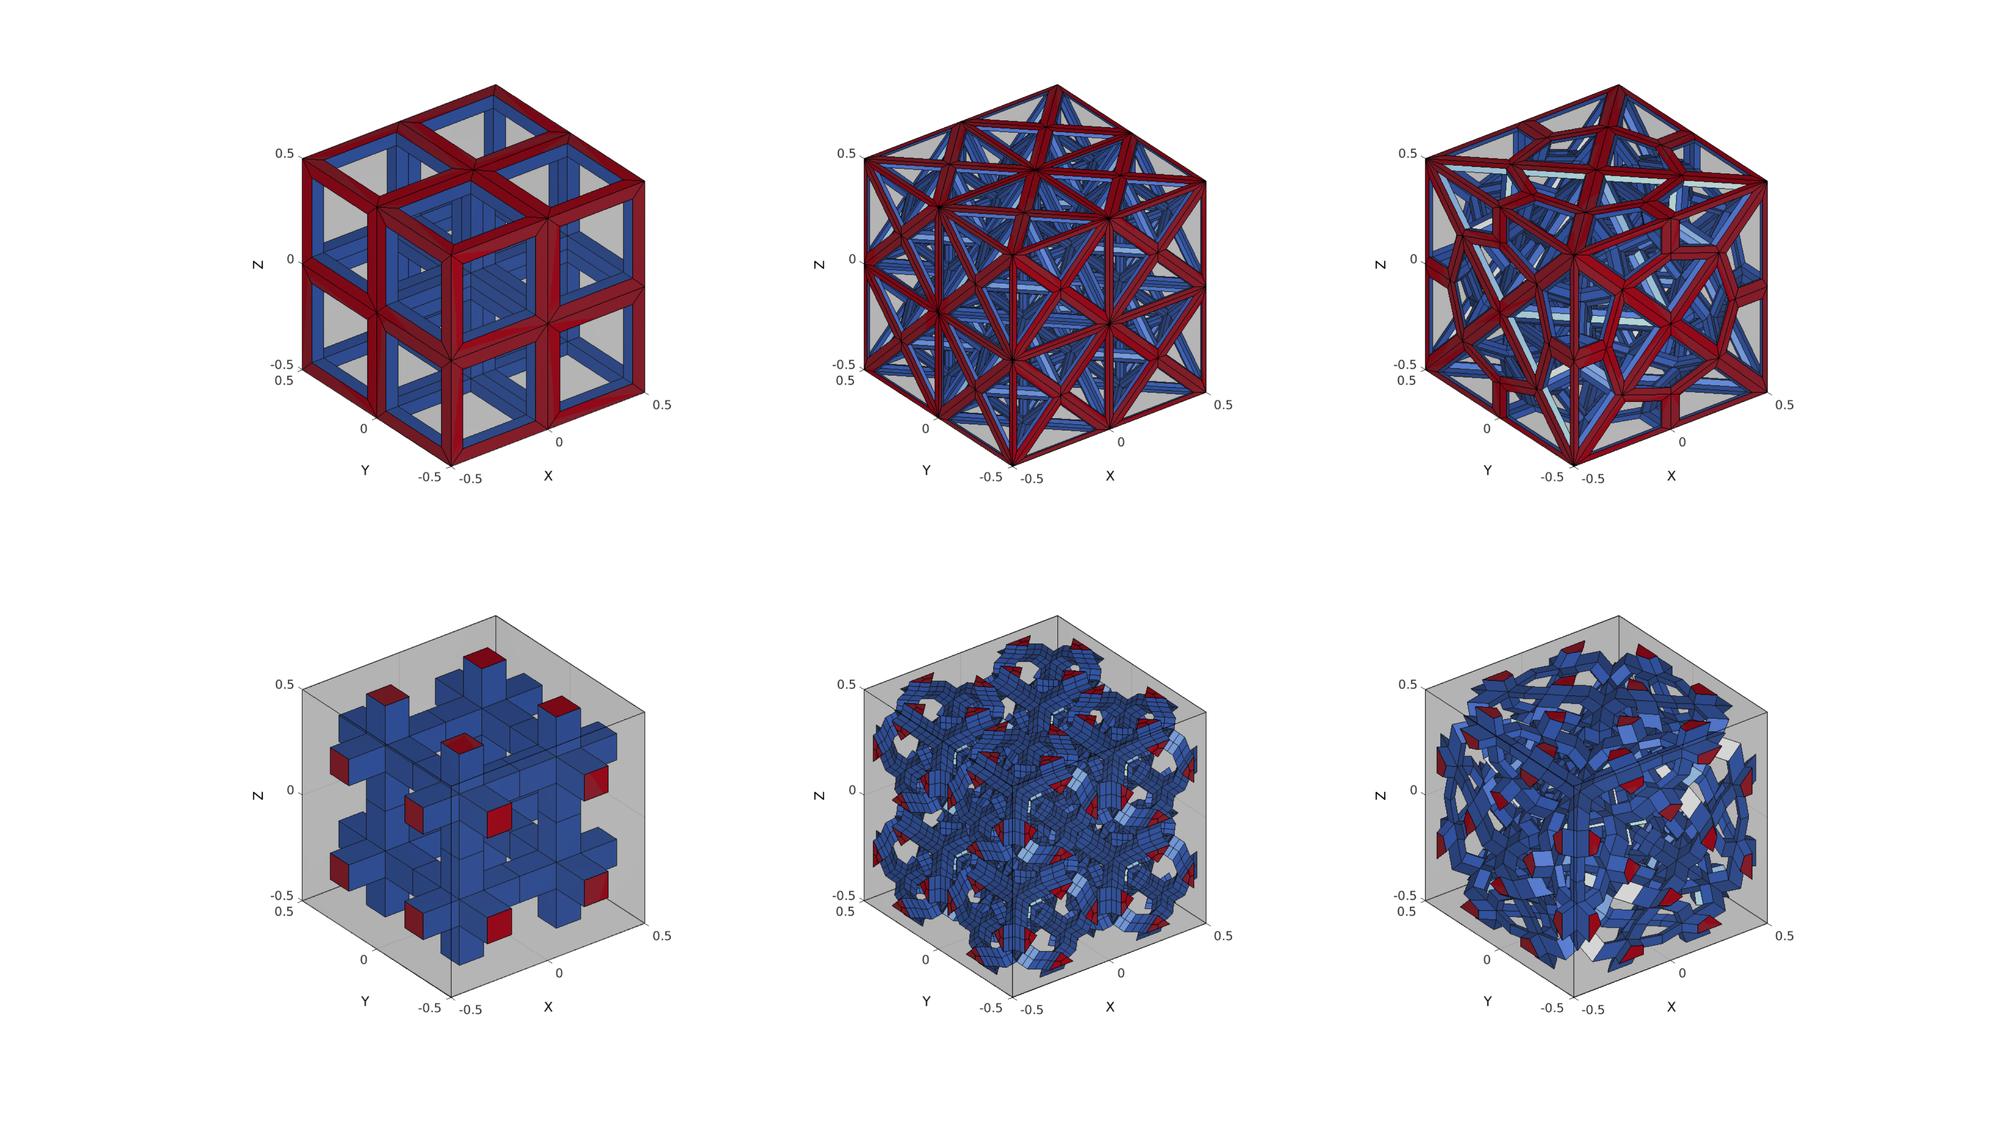
Example: Creating lattice structure variations through input mesh conversion/subdevission
cPar.shrinkFactor=0.25;
cPar.numDigitKeep=5;
cPar.meshType='quad';

cParSmooth.Method='HC';
cParSmooth.n=10;

cFigure;
c=1;
for latticeSide=1:2
    for testCase=1:3

        switch testCase
            case 1
                boxEl=[1 1 1];
                [meshStruct]=hexMeshBox(boxDim,boxEl);
                E=meshStruct.E;
                V=meshStruct.V;
                F=meshStruct.F;
                Ft=F;
                Vt=V;
                [E,V]=subHex(E,V,1,1);
            case 2
                boxEl=[1 1 1];
                [meshStruct]=hexMeshBox(boxDim,boxEl);
                E=meshStruct.E;
                V=meshStruct.V;
                F=meshStruct.F;
                Ft=F;
                Vt=V;
                [E,V]=subHex(E,V,1,1);
                [E,V,~]=hex2tet(E,V,[],1);
            case 3
                boxEl=[1 1 1];
                [meshStruct]=hexMeshBox(boxDim,boxEl);
                E=meshStruct.E;
                V=meshStruct.V;
                F=meshStruct.F;
                Ft=F;
                Vt=V;
                [E,V,~]=hex2tet(E,V,[],1);
                [E,V]=tet2hex(E,V);
        end

        %Get boundary indices
        [F]=element2patch(E); %Patch data for plotting
        [indBoundary]=tesBoundary(F,V); %Boundary indices

        %Compute lattice
        cPar.latticeSide=latticeSide;
        cPar.indBoundary=indBoundary;
        [Fn,Vn,Cn]=element2lattice(E,V,cPar);

%         %Refine mesh
%         [Fn,Vn]=subQuad(Fn,Vn,1);
%         Cn=repmat(Cn,[4 1]); %Replicate color info
%
%         %Smoothen
%         indRigid=Fn(Cn==1,:);
%         indRigid=unique(indRigid(:)); %Indices for boundary elements to hold on to
%         cParSmooth.RigidConstraints=indRigid;
%         if cParSmooth.n>0
%             [Vn]=tesSmooth(Fn,Vn,[],cParSmooth); %Smoothen mesh
%         end

        %Visualize
        subplot(2,3,c); hold on;
        gpatch(Ft,Vt,0.5*ones(1,3),'k',0.25);
        gpatch(Fn,Vn,Cn,'k',1);
        colormap(cMap);
        axisGeom(gca,fontSize);
        camlight headlight;
        lighting flat;

        c=c+1;
    end
end
drawnow;
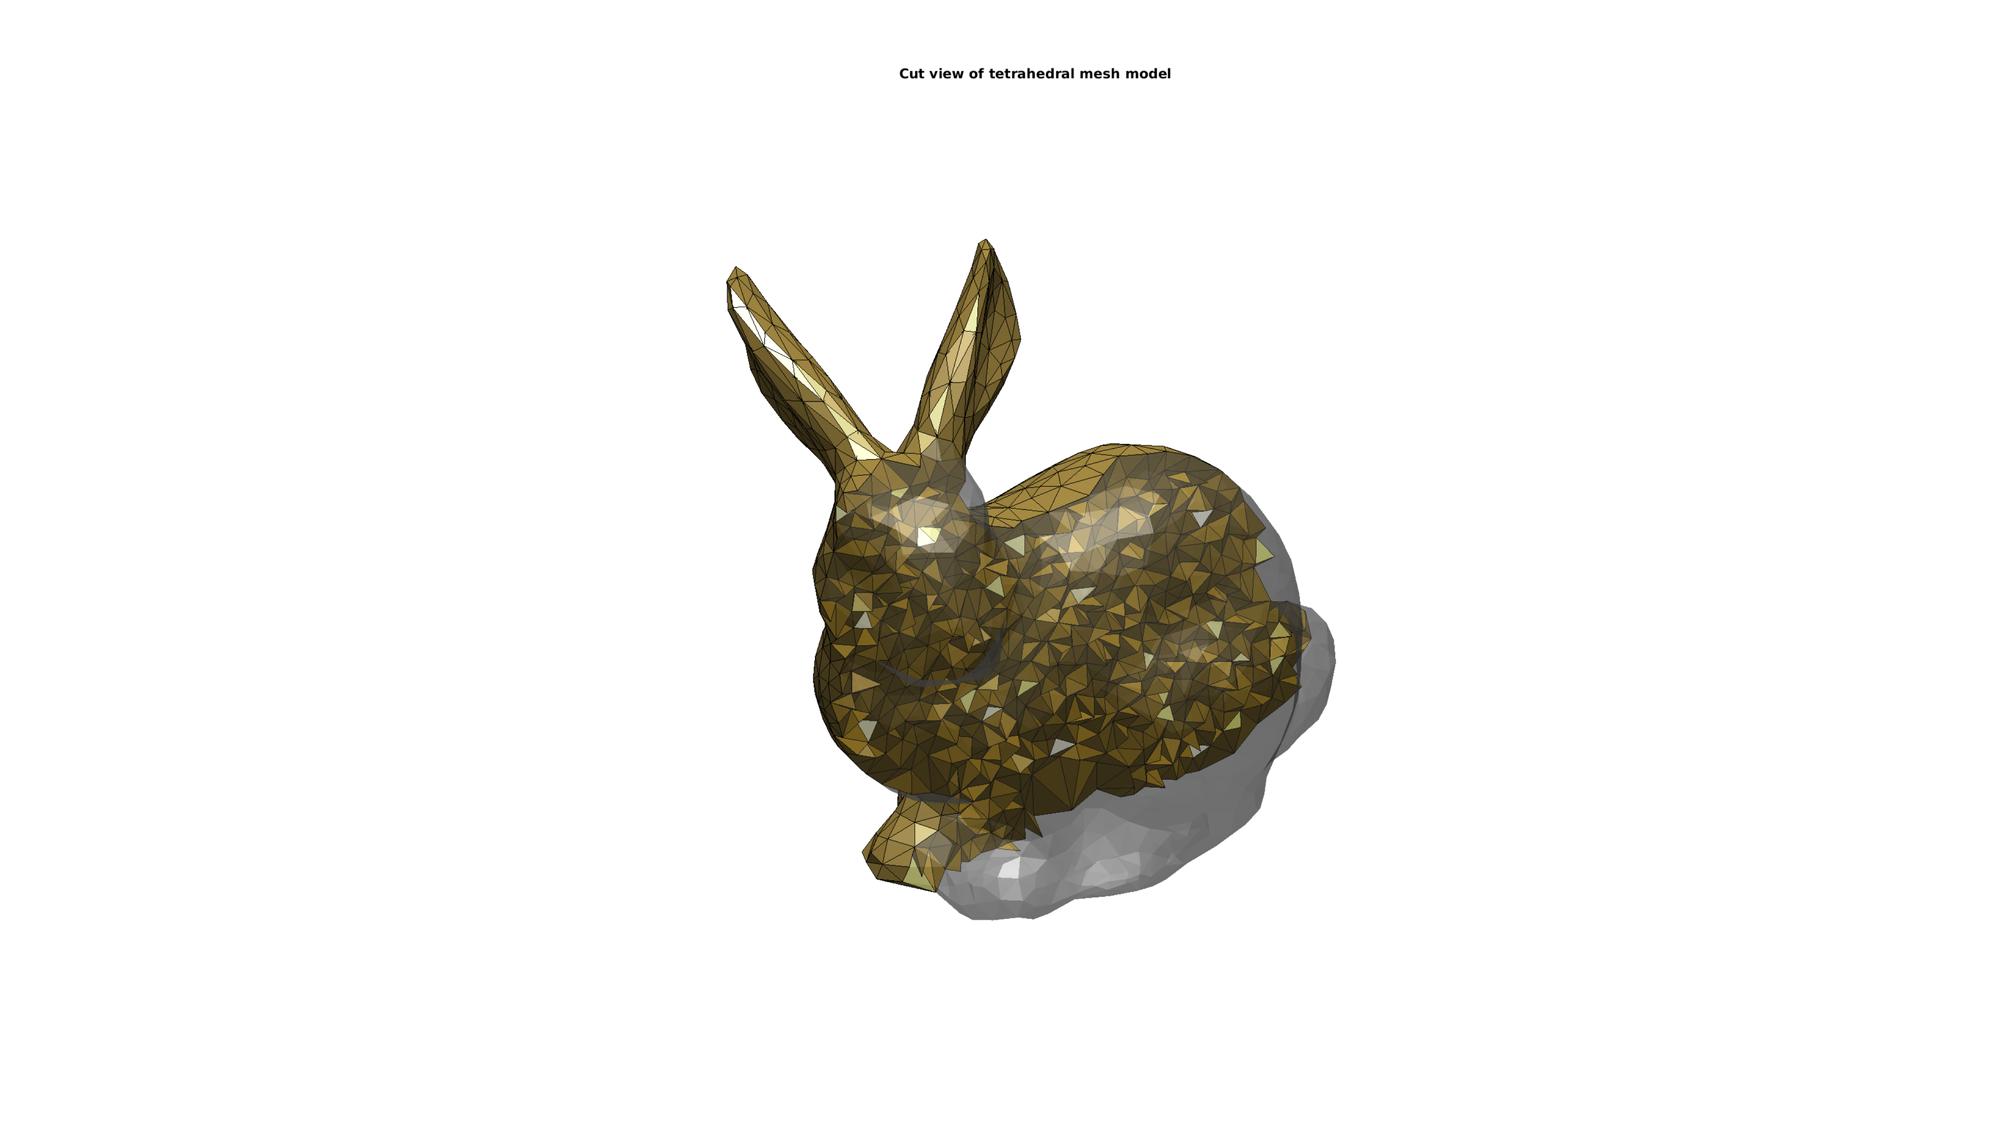
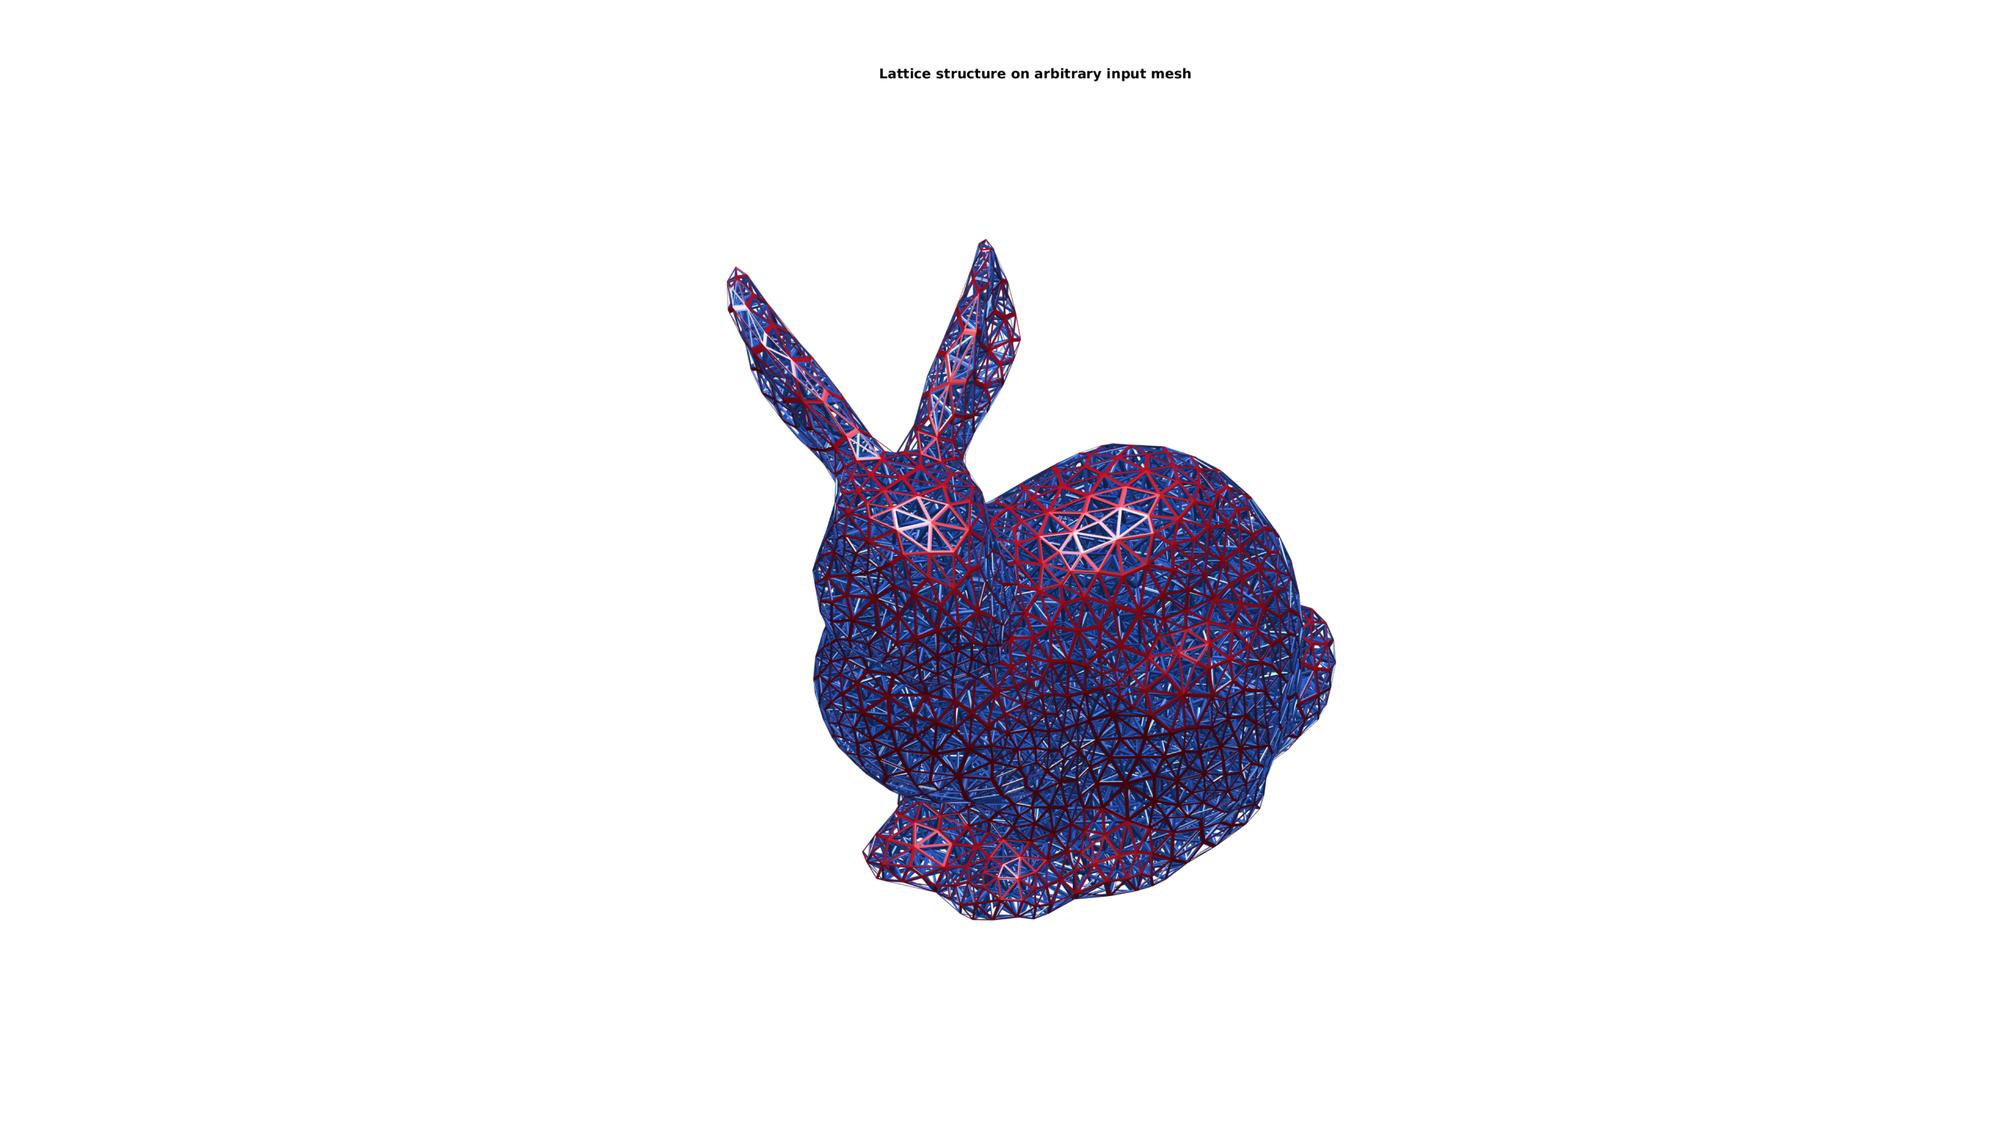
Example: Create lattice structures on arbitry input meshes
Below is an example of a general tetrahedral mesh
testCase=2;
switch testCase
    case 1
        [F,V,~]=geoSphere(2,1); % Building a geodesic dome surface model
    case 2
        [F,V]=stanford_bunny('g'); %Bunny
        V_mean=mean(V,1);
        V=V-V_mean(ones(size(V,1),1),:);
end
Using tetgen to create a tetrahedral mesh (see HELP_runTetGen)
stringOpt='-pq1.2AaY';

inputStruct.stringOpt=stringOpt;
inputStruct.Faces=fliplr(F);
inputStruct.Nodes=V;
inputStruct.holePoints=[];
inputStruct.faceBoundaryMarker=ones(size(F,1),1); %Face boundary markers
inputStruct.regionPoints=getInnerPoint(F,V); %region points
inputStruct.regionA=tetVolMeanEst(F,V);
inputStruct.minRegionMarker=2; %Minimum region marker

[meshOutput]=runTetGen(inputStruct); %Run tetGen

Fb=meshOutput.facesBoundary;
Cb=meshOutput.boundaryMarker;
V=meshOutput.nodes;
CE=meshOutput.elementMaterialID;
E=meshOutput.elements;
F=meshOutput.faces;
[indBoundary]=tesBoundary(F,V); %Boundary indices
%%%%%%%%%%%%%%%%%%%%%%%%%%%%%%%%%%%%%%%%%%%%%
--- TETGEN Tetrahedral meshing --- 20-Jun-2019 14:47:13

%%%%%%%%%%%%%%%%%%%%%%%%%%%%%%%%%%%%%%%%%%%%%
--- Writing SMESH file --- 20-Jun-2019 14:47:13
----> Adding node field
----> Adding facet field
----> Adding holes specification
----> Adding region specification
--- Done --- 20-Jun-2019 14:47:13
--- Running TetGen to mesh input boundary--- 20-Jun-2019 14:47:13
Opening /mnt/data/MATLAB/GIBBON/data/temp/temp.smesh.
Delaunizing vertices...
Delaunay seconds:  0.008246
Creating surface mesh ...
Surface mesh seconds:  0.002539
Recovering boundaries...
Boundary recovery seconds:  0.003694
Removing exterior tetrahedra ...
Spreading region attributes.
Exterior tets removal seconds:  0.002078
Recovering Delaunayness...
Delaunay recovery seconds:  0.00194
Refining mesh...
Refinement seconds:  0.074847
Optimizing mesh...
Optimization seconds:  0.005915

Writing /mnt/data/MATLAB/GIBBON/data/temp/temp.1.node.
Writing /mnt/data/MATLAB/GIBBON/data/temp/temp.1.ele.
Writing /mnt/data/MATLAB/GIBBON/data/temp/temp.1.face.
Writing /mnt/data/MATLAB/GIBBON/data/temp/temp.1.edge.

Output seconds:  0.065301
Total running seconds:  0.1647

Statistics:

  Input points: 1520
  Input facets: 3036
  Input segments: 4554
  Input holes: 0
  Input regions: 1

  Mesh points: 5861
  Mesh tetrahedra: 32563
  Mesh faces: 66644
  Mesh faces on exterior boundary: 3036
  Mesh faces on input facets: 3036
  Mesh edges on input segments: 4554
  Steiner points inside domain: 4341

--- Done --- 20-Jun-2019 14:47:14

%%%%%%%%%%%%%%%%%%%%%%%%%%%%%%%%%%%%%%%%%%%%%
--- Importing TetGen files --- 20-Jun-2019 14:47:14
--- Done --- 20-Jun-2019 14:47:14
Create lattice structure
clear controlParameter
controlParameter.shrinkFactor=0.2; %Strut sides are formed by shrinking the input mesh faces by this factor
controlParameter.numDigitKeep=5; %used for merging nodes
controlParameter.meshType='quad'; %desired output mesh type
controlParameter.indBoundary=indBoundary; %indices of the boundary faces
controlParameter.latticeSide=1; %1=side 1 the edge lattice, 2=side 2 the dual lattice to the edge lattice

[Fs1,Vs1,Cs1]=element2lattice(E,V,controlParameter); %Get lattice structure
PLOTTING MODEL
%Selecting half of the model to see interior
Y=V(:,2); YE=mean(Y(E),2);
logicCutView=YE>mean(Y);
[Fs,Cs]=element2patch(E(logicCutView,:),CE(logicCutView),'tet4');

cFigure;
hold on;
title('Cut view of tetrahedral mesh model','FontSize',fontSize);
gpatch(Fb,V,0.5*ones(1,3),'none',0.5);
gpatch(Fs,V,Cs,'k',1);
camlight headlight;
axisGeom(gca,fontSize);
axis off;
colormap(cMap);
drawnow;
Visualize lattice structure
cFigure;
hold on;
title('Lattice structure on arbitrary input mesh','FontSize',fontSize);
% gpatch(Fb,V,0.5*ones(1,3),'none',0.5);
gpatch(Fs1,Vs1,Cs1,'none',1);
camlight headlight; lighting flat;
axisGeom(gca,fontSize);
axis off;
colormap(cMap);
drawnow;

GIBBON www.gibboncode.org
Kevin Mattheus Moerman, [email protected]
GIBBON footer text
License: https://github.com/gibbonCode/GIBBON/blob/master/LICENSE
GIBBON: The Geometry and Image-based Bioengineering add-On. A toolbox for image segmentation, image-based modeling, meshing, and finite element analysis.
Copyright (C) 2019 Kevin Mattheus Moerman
This program is free software: you can redistribute it and/or modify it under the terms of the GNU General Public License as published by the Free Software Foundation, either version 3 of the License, or (at your option) any later version.
This program is distributed in the hope that it will be useful, but WITHOUT ANY WARRANTY; without even the implied warranty of MERCHANTABILITY or FITNESS FOR A PARTICULAR PURPOSE. See the GNU General Public License for more details.
You should have received a copy of the GNU General Public License along with this program. If not, see http://www.gnu.org/licenses/.