element2HexLattice
Below is a demonstration of the features of the element2HexLattice function
Contents
clear; close all; clc;
Syntax
[Es,Vs,Cs]=element2HexLattice(E,V,cPar);
Description
This function converts an element description (elements and vertices i.e nodes into a lattice structure. The lattice structure is returned as a hexahederal mesh.
Examples
Plot settings
cMap=gjet(4);
fontSize=15;
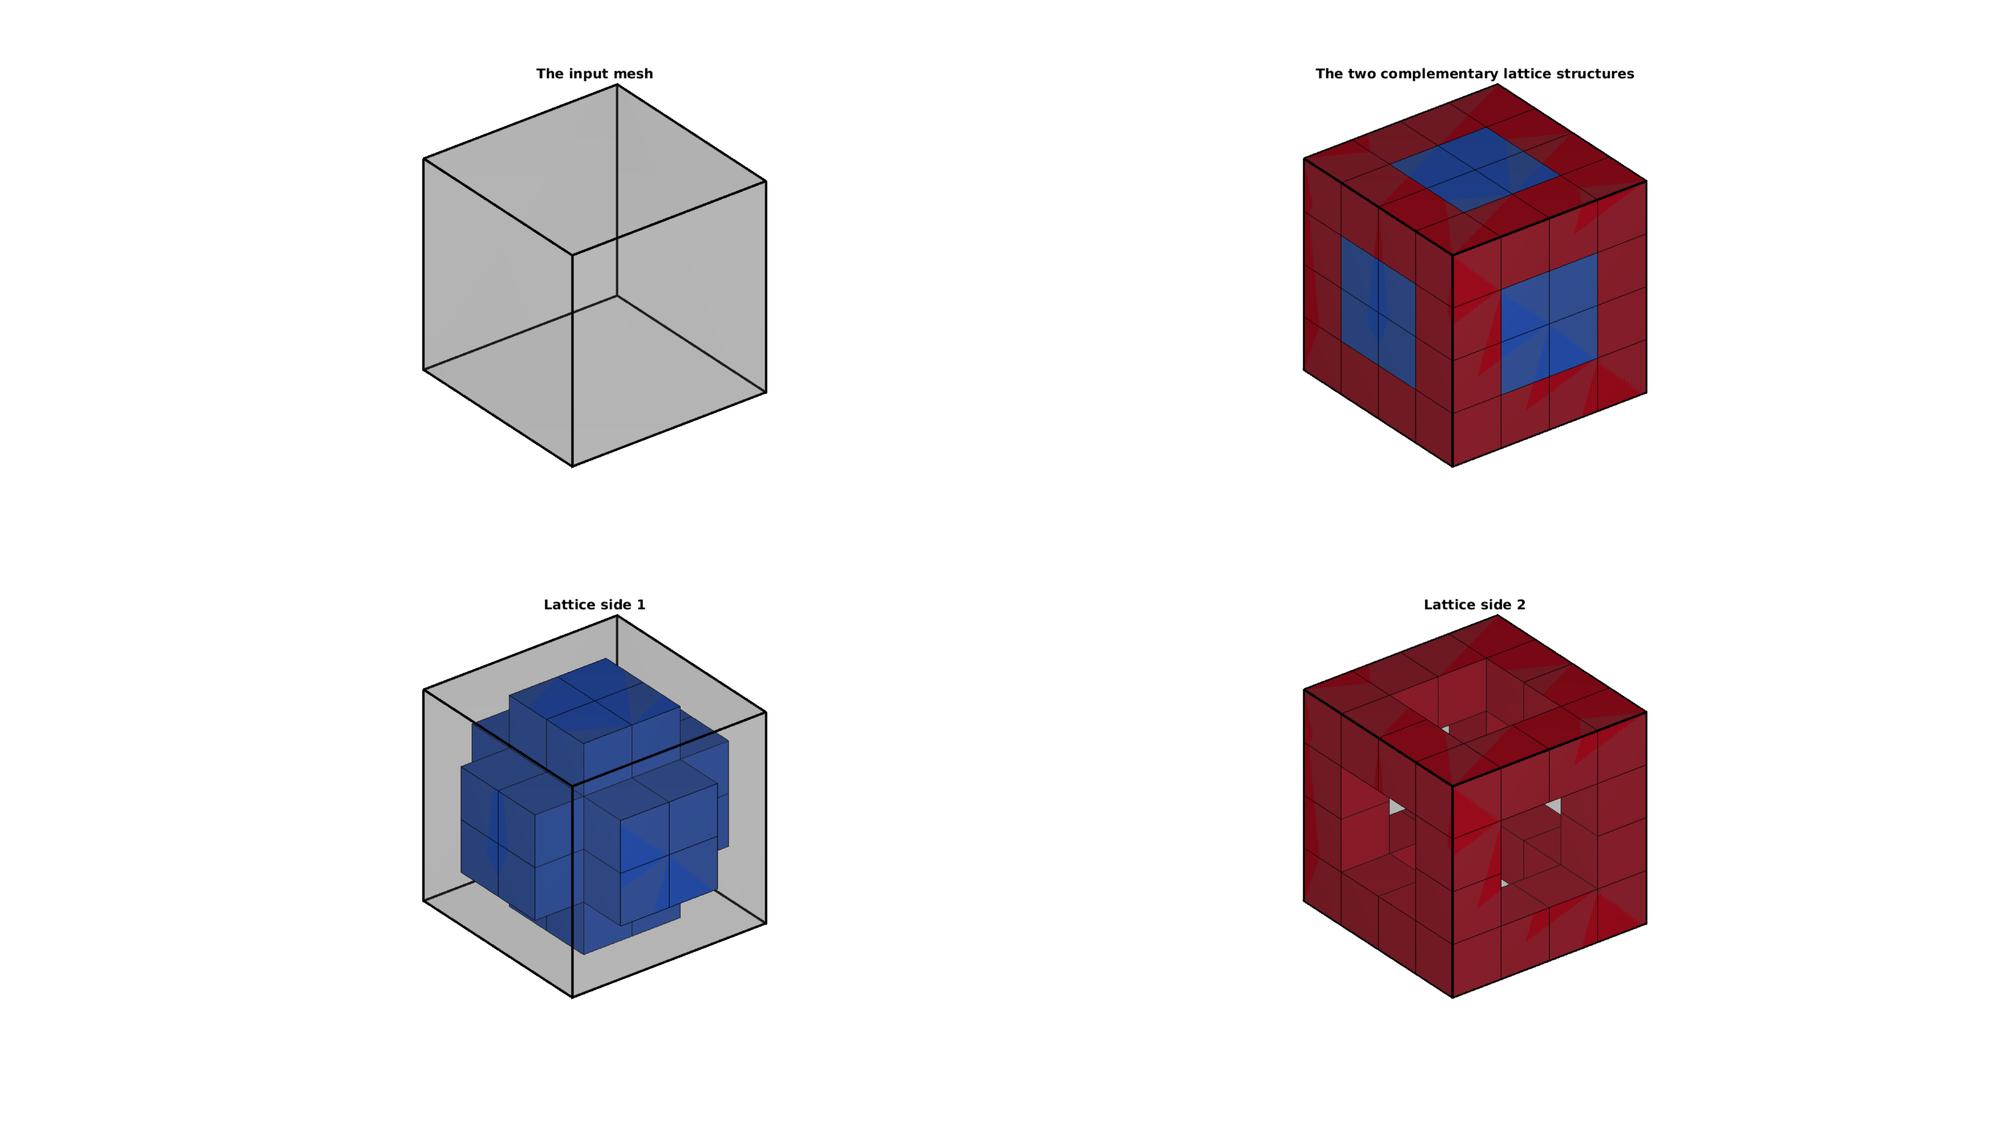
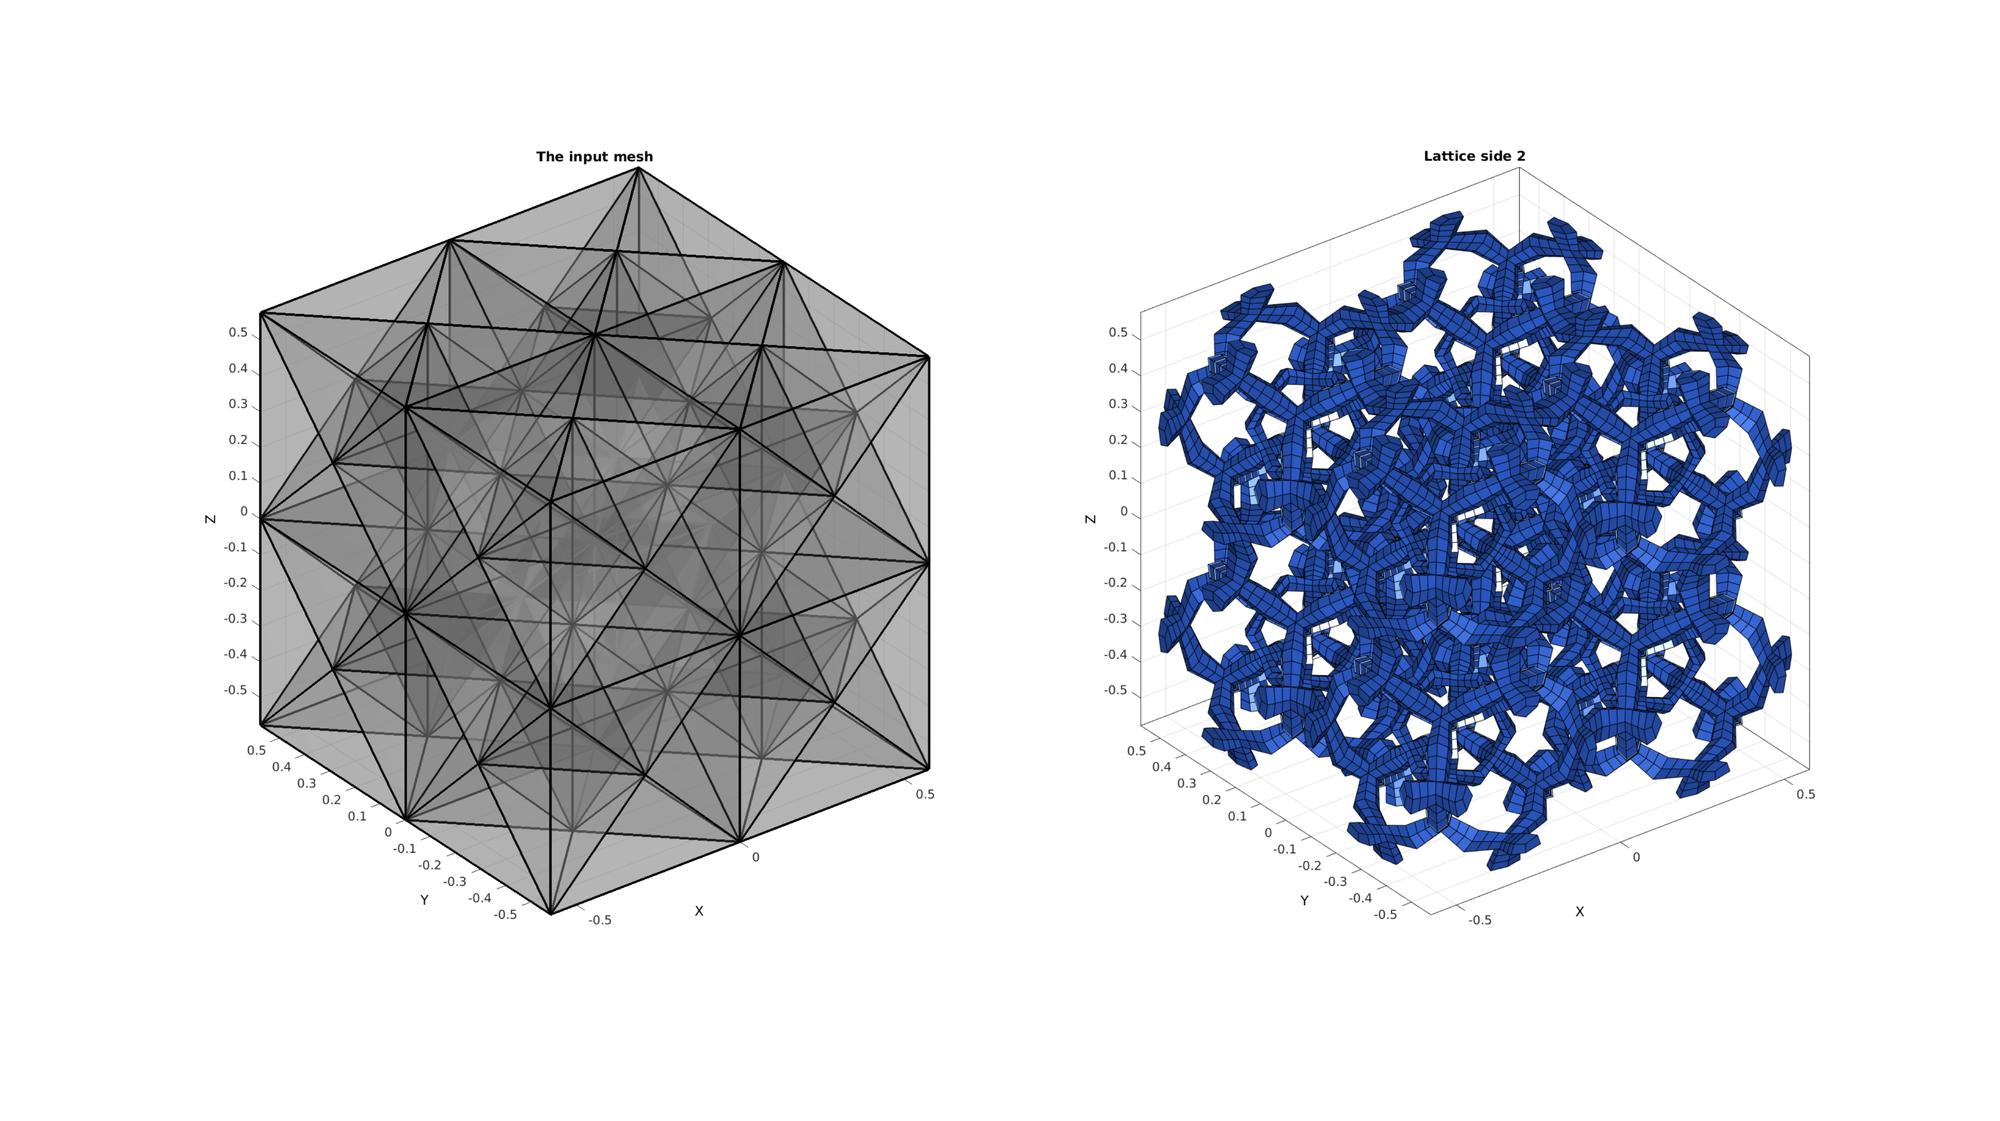
Example 1 Creating a lattice structure on hexahedral meshes
Creating example geometry.
[V,~]=platonic_solid(2,1); %Vertices of cube
E=1:8; %Element description of the 8-node cube (hexahedral element)
C=(1:size(E,1))'; %color (e.g. material) labels for all elements
[F,~]=element2patch(E,C); %Patch data for plotting
Create lattice structure
controlParameter.growSteps=0; %0 is normal, positive or negative integers increase or decrease the edge lattice thickness respectively
controlParameter.latticeSide=[]; %Empty outputs both, 1=side 1 the edge lattice, 2=side 2 the dual lattice to the edge lattice
[Es,Vs,Cs]=element2HexLattice(E,V,controlParameter); %Get lattice structure
Visualizing input mesh and lattic structures
% Create patch Data for visualization
[Fs,CsF]=element2patch(Es,Cs); %Patch data for plotting
[Fs1,CsF1]=element2patch(Es(Cs==1,:),Cs(Cs==1,:)); %Patch data for plotting
[Fs2,CsF2]=element2patch(Es(Cs==2,:),Cs(Cs==2,:)); %Patch data for plotting

cFigure;
hs=subplot(2,2,1);
title('The input mesh','fontSize',fontSize)
hold on;
gpatch(F,V,0.5*ones(1,3),'k',0.25,3);
axisGeom(gca,fontSize);
camlight headlight; lighting flat;
ha=axis; axis off;

subplot(2,2,2);
title('The two complementary lattice structures','fontSize',fontSize)
hold on;
gpatch(F,V,0.5*ones(1,3),'k',0.25,3);
gpatch(Fs,Vs,CsF);
colormap(cMap);
cLim=caxis; caxis([1 2]);
axisGeom(gca,fontSize);
camlight headlight; lighting flat;
axis(ha); axis off;

subplot(2,2,3);
title('Lattice side 1','fontSize',fontSize)
hold on;
gpatch(F,V,0.5*ones(1,3),'k',0.25,3);
gpatch(Fs1,Vs,cMap(1,:));
colormap(cMap);
caxis(cLim);
axisGeom(gca,fontSize);
camlight headlight; lighting flat;
axis(ha); axis off;

subplot(2,2,4);
title('Lattice side 2','fontSize',fontSize)
hold on;
gpatch(F,V,0.5*ones(1,3),'k',0.25,3);
gpatch(Fs2,Vs,CsF2);
colormap(cMap);
caxis(cLim);
axisGeom(gca,fontSize);
camlight headlight; lighting flat;
axis(ha); axis off;

drawnow;
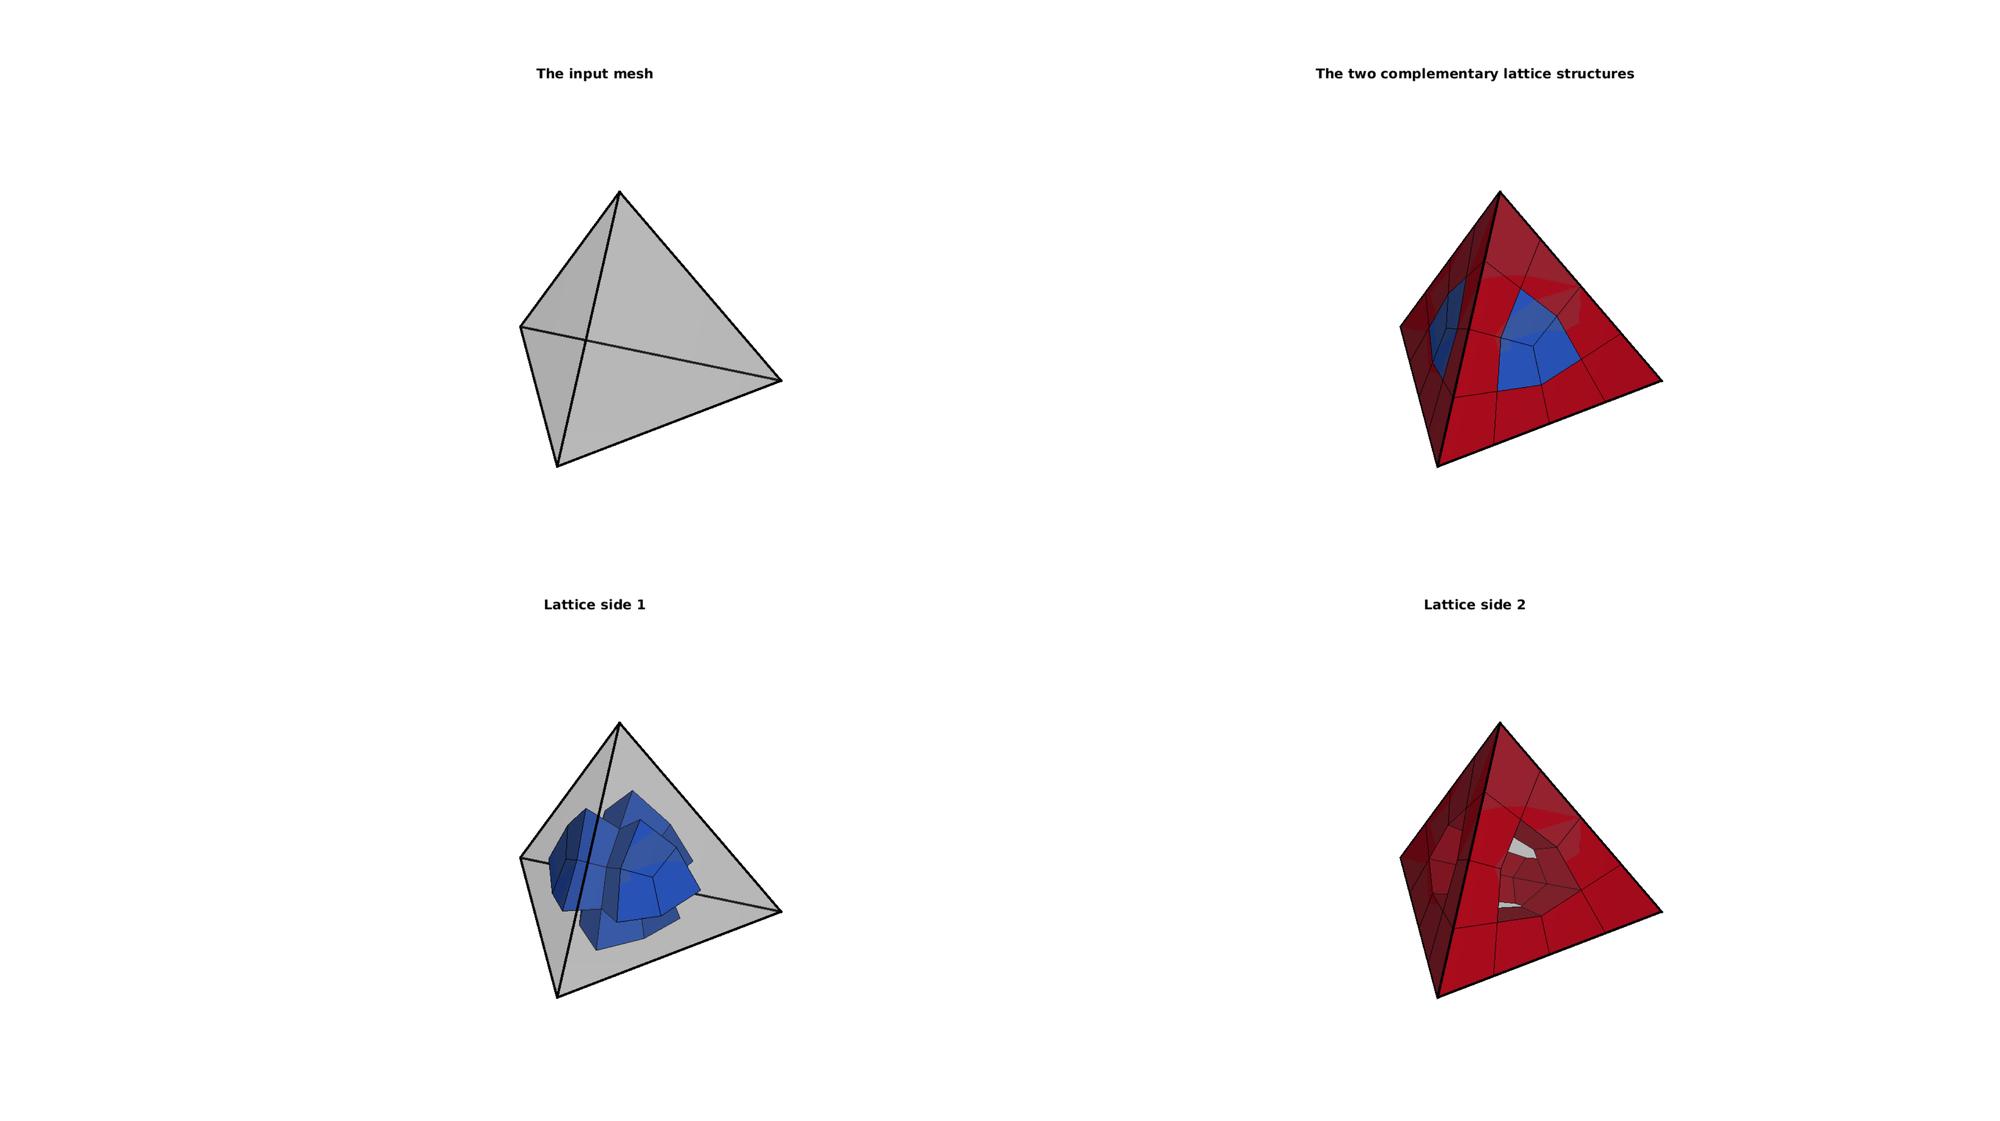
Example 2 Creating a lattice structure on tetrahedral meshes
Creating example geometry.
[V,~]=platonic_solid(1,1); %Vertices of tetrahedron
E=1:4; %Element description of the 4-node tetrahedron
C=(1:size(E,1))'; %color (e.g. material) labels for all elements
[F,~]=element2patch(E,C); %Patch data for plotting
Create lattice structure
controlParameter.growSteps=0; %0 is normal, positive or negative integers increase or decrease the edge lattice thickness respectively
controlParameter.latticeSide=[]; %Empty outputs both, 1=side 1 the edge lattice, 2=side 2 the dual lattice to the edge lattice
[Es,Vs,Cs]=element2HexLattice(E,V,controlParameter); %Get lattice structure
Visualizing input mesh and lattic structures
% Create patch Data for visualization
[Fs,CsF]=element2patch(Es,Cs); %Patch data for plotting
[Fs1,CsF1]=element2patch(Es(Cs==1,:),Cs(Cs==1,:)); %Patch data for plotting
[Fs2,CsF2]=element2patch(Es(Cs==2,:),Cs(Cs==2,:)); %Patch data for plotting

cFigure;
hs=subplot(2,2,1);
title('The input mesh','fontSize',fontSize)
hold on;
gpatch(F,V,0.5*ones(1,3),'k',0.25,3);
axisGeom(gca,fontSize);
camlight headlight; lighting flat;
ha=axis; axis off;

subplot(2,2,2);
title('The two complementary lattice structures','fontSize',fontSize)
hold on;
gpatch(F,V,0.5*ones(1,3),'k',0.25,3);
gpatch(Fs,Vs,CsF);
colormap(cMap);
cLim=caxis; caxis([1 2]);
axisGeom(gca,fontSize);
camlight headlight; lighting flat;
axis(ha); axis off;

subplot(2,2,3);
title('Lattice side 1','fontSize',fontSize)
hold on;
gpatch(F,V,0.5*ones(1,3),'k',0.25,3);
gpatch(Fs1,Vs,cMap(1,:));
colormap(cMap);
caxis(cLim);
axisGeom(gca,fontSize);
camlight headlight; lighting flat;
axis(ha); axis off;

subplot(2,2,4);
title('Lattice side 2','fontSize',fontSize)
hold on;
gpatch(F,V,0.5*ones(1,3),'k',0.25,3);
gpatch(Fs2,Vs,CsF2);
colormap(cMap);
caxis(cLim);
axisGeom(gca,fontSize);
camlight headlight; lighting flat;
axis(ha); axis off;

drawnow;
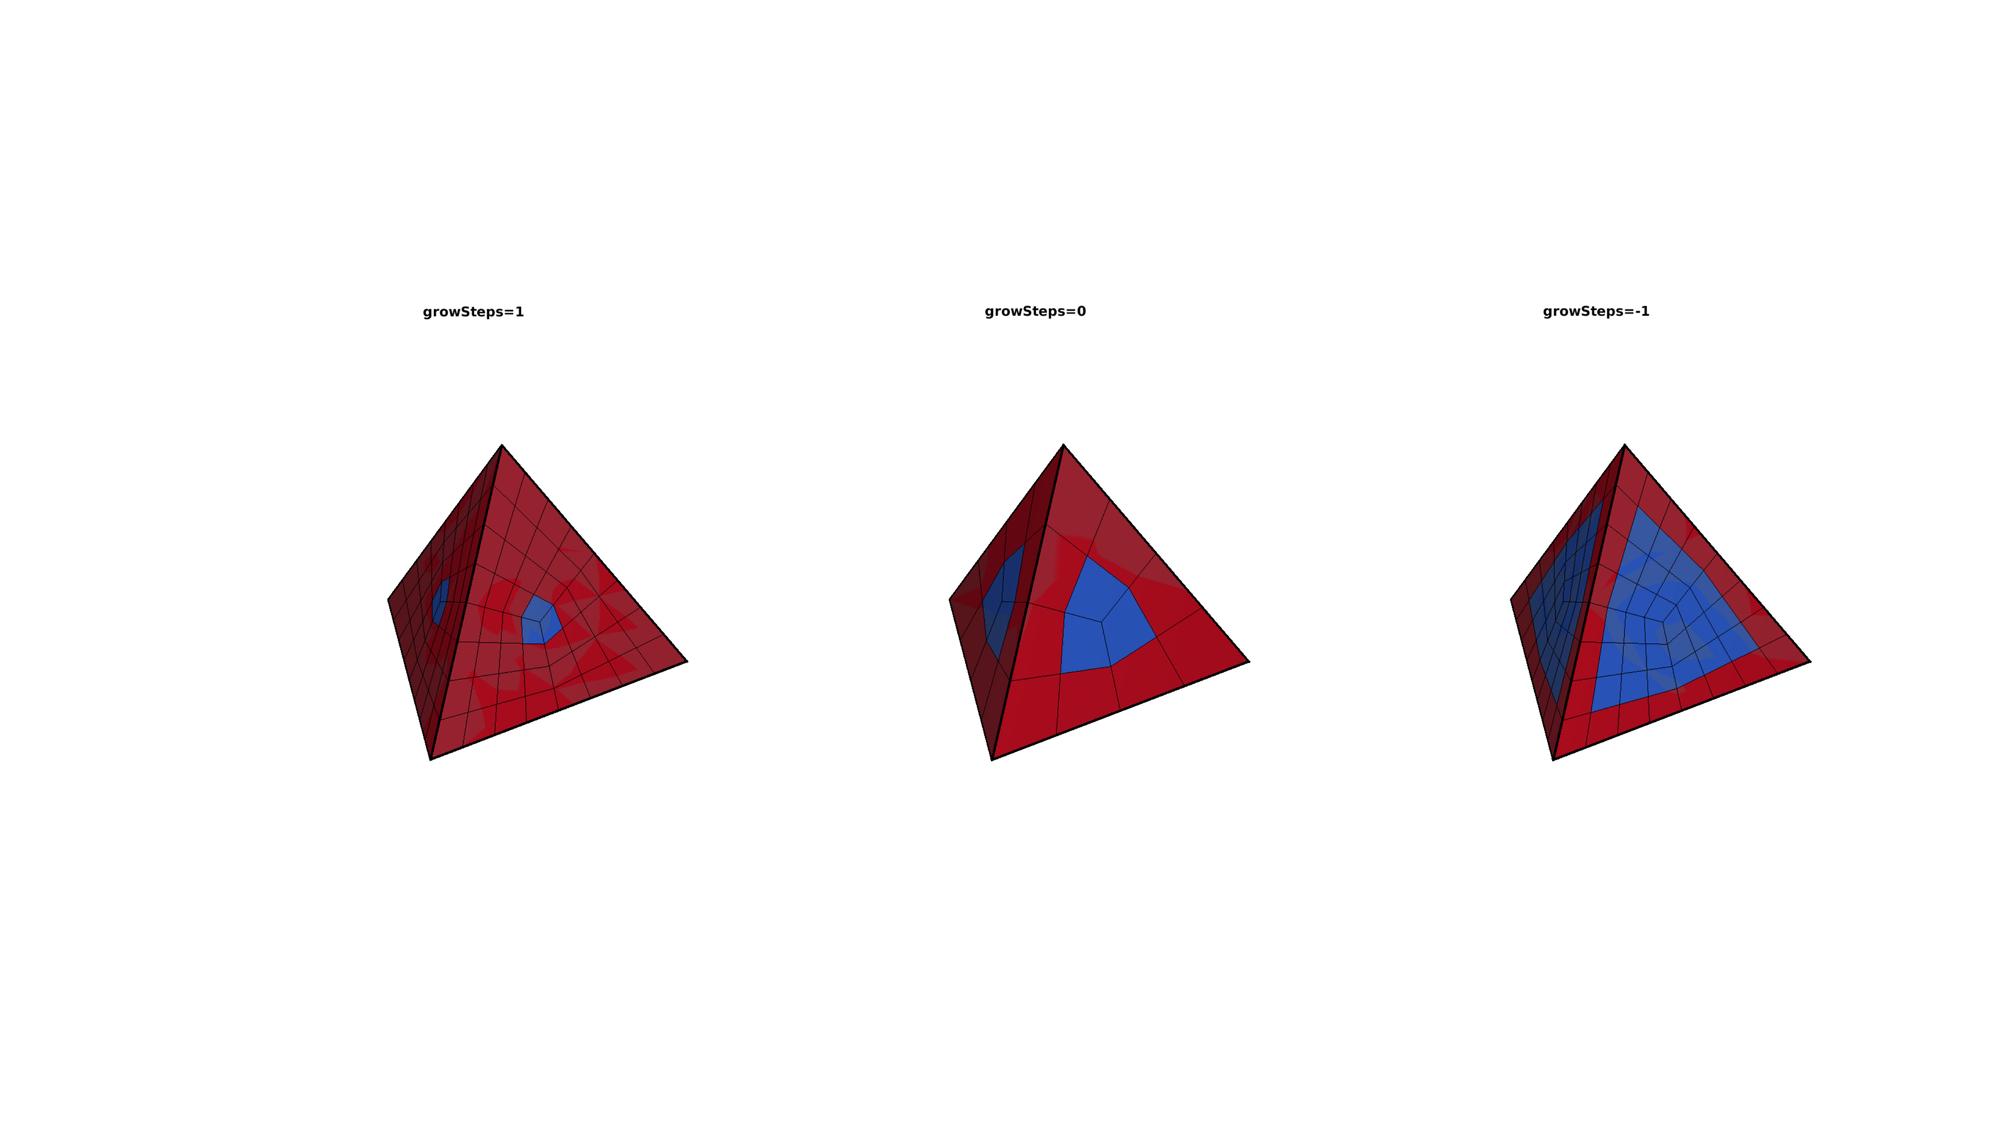
Example 3 Changing lattice structure thickness
Creating example geometry.
[V,~]=platonic_solid(1,1); %Vertices of tetrahedron
E=1:4; %Element description of the 4-node tetrahedron
C=(1:size(E,1))'; %color (e.g. material) labels for all elements
[F,~]=element2patch(E,C); %Patch data for plotting
Create lattice structure
controlParameter.latticeSide=[]; %Empty outputs both, 1=side 1 the edge lattice, 2=side 2 the dual lattice to the edge lattice
lattice structure for 0 growth steps
controlParameter.growSteps=0; %0 is normal, positive or negative integers increase or decrease the edge lattice thickness respectively
[Es_0,Vs_0,Cs_0]=element2HexLattice(E,V,controlParameter); %Get lattice structure

controlParameter.growSteps=1; %0 is normal, positive or negative integers increase or decrease the edge lattice thickness respectively
[Es_1,Vs_1,Cs_1]=element2HexLattice(E,V,controlParameter); %Get lattice structure

controlParameter.growSteps=-1; %0 is normal, positive or negative integers increase or decrease the edge lattice thickness respectively
[Es_n1,Vs_n1,Cs_n1]=element2HexLattice(E,V,controlParameter); %Get lattice structure
Visualizing input mesh and lattic structures
% Create patch Data for visualization
[Fs_0,CsF_0]=element2patch(Es_0,Cs_0); %Patch data for plotting
[Fs_1,CsF_1]=element2patch(Es_1,Cs_1); %Patch data for plotting
[Fs_n1,CsF_n1]=element2patch(Es_n1,Cs_n1); %Patch data for plotting

cFigure;
subplot(1,3,1);
title('growSteps=1','fontSize',fontSize)
hold on;
gpatch(F,V,0.5*ones(1,3),'k',0.25,3);
gpatch(Fs_1,Vs_1,CsF_1);
colormap(cMap);
cLim=caxis; caxis([1 2]);
axisGeom(gca,fontSize);
camlight headlight; lighting flat;
axis off;

subplot(1,3,2);
title('growSteps=0','fontSize',fontSize)
hold on;
gpatch(F,V,0.5*ones(1,3),'k',0.25,3);
gpatch(Fs_0,Vs_0,CsF_0);
colormap(cMap);
cLim=caxis; caxis([1 2]);
axisGeom(gca,fontSize);
camlight headlight; lighting flat;
axis off;

subplot(1,3,3);
title('growSteps=-1','fontSize',fontSize)
hold on;
gpatch(F,V,0.5*ones(1,3),'k',0.25,3);
gpatch(Fs_n1,Vs_n1,CsF_n1);
colormap(cMap);
cLim=caxis; caxis([1 2]);
axisGeom(gca,fontSize);
camlight headlight; lighting flat;
axis off;

drawnow;
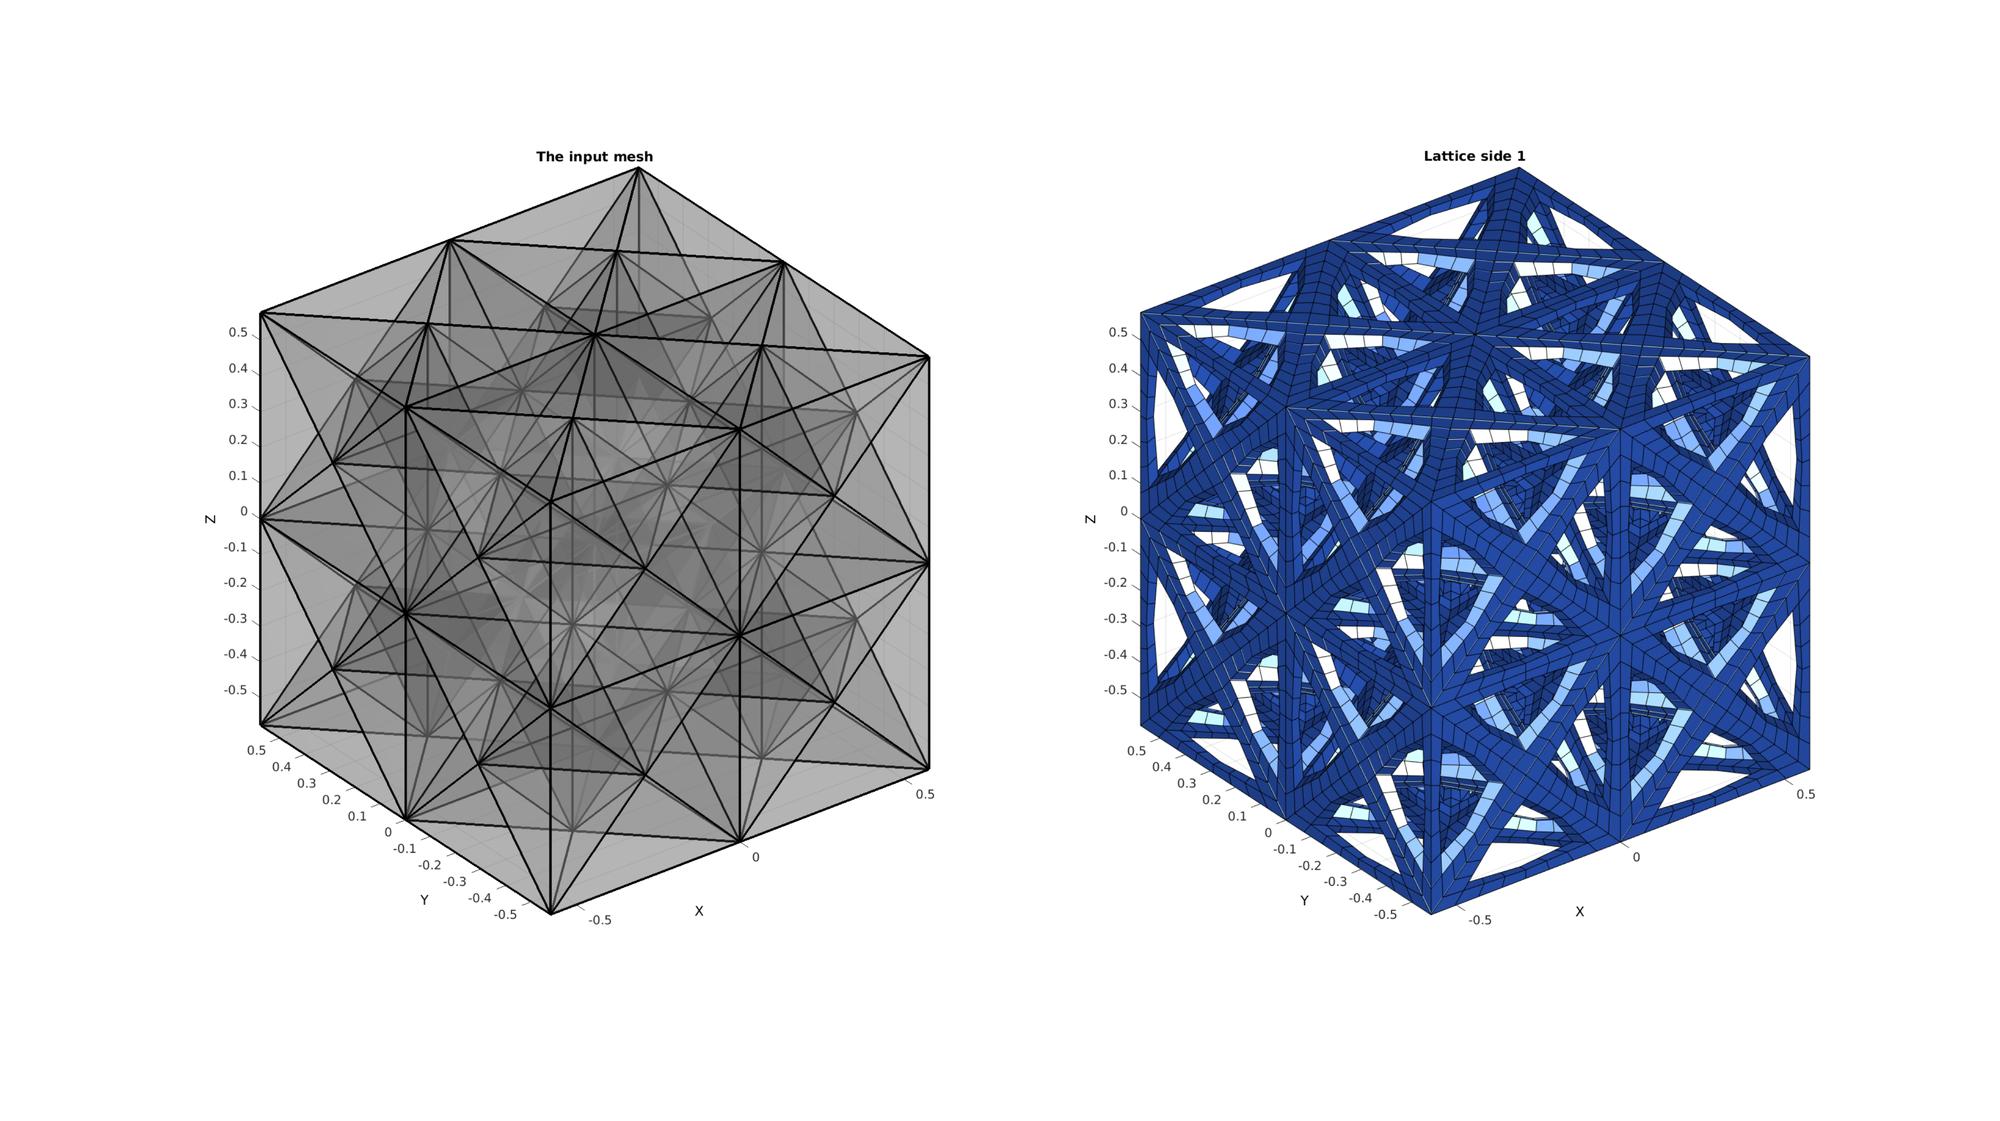
Example 4 Lattices on multiple elements, adjusting lattice type
Creating example geometry.
[V,~]=platonic_solid(2,1); %Vertices of cube
E=1:8; %Element description of the 8-node cube (hexahedral element)
[E,V,C]=subHex(E,V); %Subdevide into 8 sub-cubes
[E,V,C]=hex2tet(E,V,C,1); %Convert to tetrahedral elements

[F,~]=element2patch(E,C); %Patch data for plotting
Create lattice structure
controlParameter.growSteps=-1; %0 is normal, positive or negative integers increase or decrease the edge lattice thickness respectively
controlParameter.latticeSide=1; %Empty outputs both, 1=side 1 the edge lattice, 2=side 2 the dual lattice to the edge lattice
[Es,Vs,Cs]=element2HexLattice(E,V,controlParameter); %Get lattice structure
Visualizing input mesh and lattic structures
% Create patch Data for visualization
[Fs,CsF]=element2patch(Es,Cs); %Patch data for plotting

cFigure;
hs=subplot(1,2,1);
title('The input mesh','fontSize',fontSize)
hold on;
gpatch(F,V,0.5*ones(1,3),'k',0.25,3);
axisGeom(gca,fontSize);
camlight headlight; lighting flat;

subplot(1,2,2);
title('Lattice side 1','fontSize',fontSize)
hold on;
gpatch(Fs,Vs,cMap(1,:));
colormap(cMap);
caxis(cLim);
axisGeom(gca,fontSize);
camlight headlight; lighting flat;

drawnow;
Create lattice structure
controlParameter.growSteps=1; %0 is normal, positive or negative integers increase or decrease the edge lattice thickness respectively
controlParameter.latticeSide=2; %Empty outputs both, 1=side 1 the edge lattice, 2=side 2 the dual lattice to the edge lattice
[Es,Vs,Cs]=element2HexLattice(E,V,controlParameter); %Get lattice structure
Visualizing input mesh and lattic structures
% Create patch Data for visualization
[Fs,CsF]=element2patch(Es,Cs); %Patch data for plotting

cFigure;
hs=subplot(1,2,1);
title('The input mesh','fontSize',fontSize)
hold on;
gpatch(F,V,0.5*ones(1,3),'k',0.25,3);
axisGeom(gca,fontSize);
camlight headlight; lighting flat;

subplot(1,2,2);
title('Lattice side 2','fontSize',fontSize)
hold on;
gpatch(Fs,Vs,cMap(1,:));
colormap(cMap);
caxis(cLim);
axisGeom(gca,fontSize);
camlight headlight; lighting flat;

drawnow;
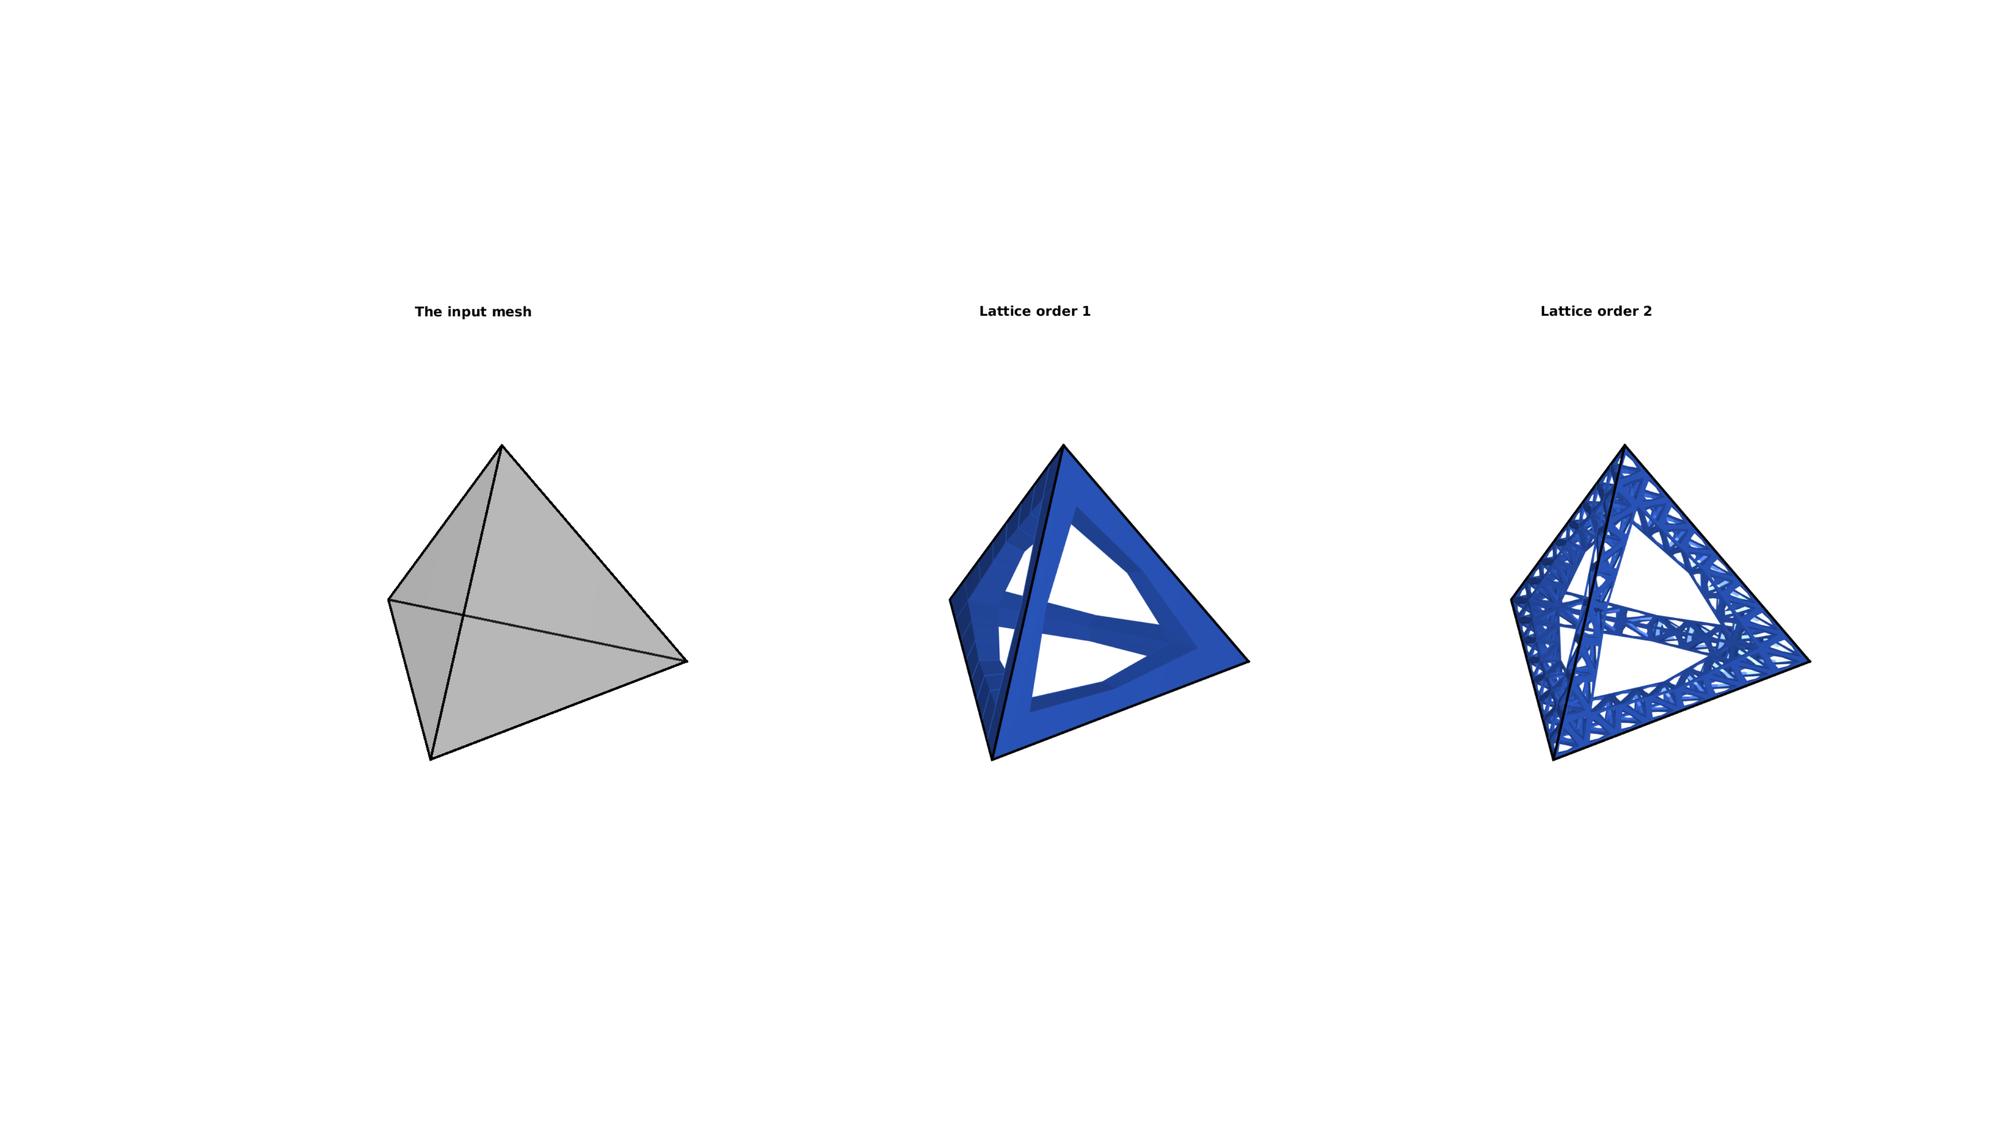
Example 5 Hierarchical lattice structures
Creating example geometry.
% [V,~]=platonic_solid(2,1); %Vertices of cube
% E=1:8; %Element description of the 8-node cube (hexahedral element)
% C=(1:size(E,1))'; %color (e.g. material) labels for all elements
% [F,~]=element2patch(E,C); %Patch data for plotting

[V,~]=platonic_solid(1,1); %Vertices of tetrahedron
E=1:4; %Element description of the 4-node tetrahedron
C=(1:size(E,1))'; %color (e.g. material) labels for all elements
[F,~]=element2patch(E,C); %Patch data for plotting
Create first order lattice structure
controlParameter.growSteps=-1; %0 is normal, positive or negative integers increase or decrease the edge lattice thickness respectively
controlParameter.latticeSide=1; %Empty outputs both, 1=side 1 the edge lattice, 2=side 2 the dual lattice to the edge lattice
[Es1,Vs1,Cs1]=element2HexLattice(E,V,controlParameter); %Get lattice structure
Uncomment to create more complex structure
[Es1,Vs1,Cs1]=hex2tet(Es1,Vs1,Cs1,5); %Convert to tetrahedral elements
% [Es1,Vs1,Cs1]=tet2hex(Es1,Vs1,1); %Convert to tetrahedral elements
Create second order lattice structure
controlParameter.growSteps=-1; %0 is normal, positive or negative integers increase or decrease the edge lattice thickness respectively
controlParameter.latticeSide=1; %Empty outputs both, 1=side 1 the edge lattice, 2=side 2 the dual lattice to the edge lattice
[Es2,Vs2,Cs2]=element2HexLattice(Es1,Vs1,controlParameter); %Get lattice structure
Visualizing input mesh and lattic structures
% Create patch Data for visualization
[Fs1,CsF1]=element2patch(Es1,Cs1); %Patch data for plotting
[Fs2,CsF2]=element2patch(Es2,Cs2); %Patch data for plotting

[indBounary]=tesBoundary(Fs2,Vs2);
Fs2_b=Fs2(indBounary,:);

[indBounary]=tesBoundary(Fs1,Vs1);
Fs1_b=Fs1(indBounary,:);
cFigure;
hs=subplot(1,3,1);
title('The input mesh','fontSize',fontSize)
hold on;
gpatch(F,V,0.5*ones(1,3),'k',0.25,3);
axisGeom(gca,fontSize);
camlight headlight; lighting flat;
ha=axis; axis off;

subplot(1,3,2);
title('Lattice order 1','fontSize',fontSize)
hold on;
gpatch(F,V,0.5*ones(1,3),'k',0,3);
gpatch(Fs1_b,Vs1,cMap(1,:),'none');
colormap(cMap);
caxis(cLim);
axisGeom(gca,fontSize);
camlight headlight; lighting flat;
axis(ha); axis off;

subplot(1,3,3);
title('Lattice order 2','fontSize',fontSize)
hold on;
gpatch(F,V,0.5*ones(1,3),'k',0,3);
gpatch(Fs2_b,Vs2,cMap(1,:),'none');
colormap(cMap);
caxis(cLim);
axisGeom(gca,fontSize);
camlight headlight; lighting flat;
axis(ha); axis off;

drawnow;

GIBBON www.gibboncode.org
Kevin Mattheus Moerman, [email protected]
GIBBON footer text
License: https://github.com/gibbonCode/GIBBON/blob/master/LICENSE
GIBBON: The Geometry and Image-based Bioengineering add-On. A toolbox for image segmentation, image-based modeling, meshing, and finite element analysis.
Copyright (C) 2019 Kevin Mattheus Moerman
This program is free software: you can redistribute it and/or modify it under the terms of the GNU General Public License as published by the Free Software Foundation, either version 3 of the License, or (at your option) any later version.
This program is distributed in the hope that it will be useful, but WITHOUT ANY WARRANTY; without even the implied warranty of MERCHANTABILITY or FITNESS FOR A PARTICULAR PURPOSE. See the GNU General Public License for more details.
You should have received a copy of the GNU General Public License along with this program. If not, see http://www.gnu.org/licenses/.