curveToEdgeList
Below is a demonstration of the features of the curveToEdgeList function
Contents
clear; close all; clc;
Syntax
[E]=curveToEdgeList(N);
Description
This function creates an edge array E for the input curve defined by N. The input parameter N can be of the following type: * A single scalar In this case it is assumed N defines the number of points on the curve * An nxm array representing n points and m dimensions, in this case it is assumed N represents the vertex array for the curve * A row or column array, in this case it is assumed that N defines the indices for the points defining the curve.
If closeCurveOpt=1 it is assumed the start and end of the curve should be attached.
Examples
Plot settings
lineWidth=2;
markerSize=15;
fontSize=15;
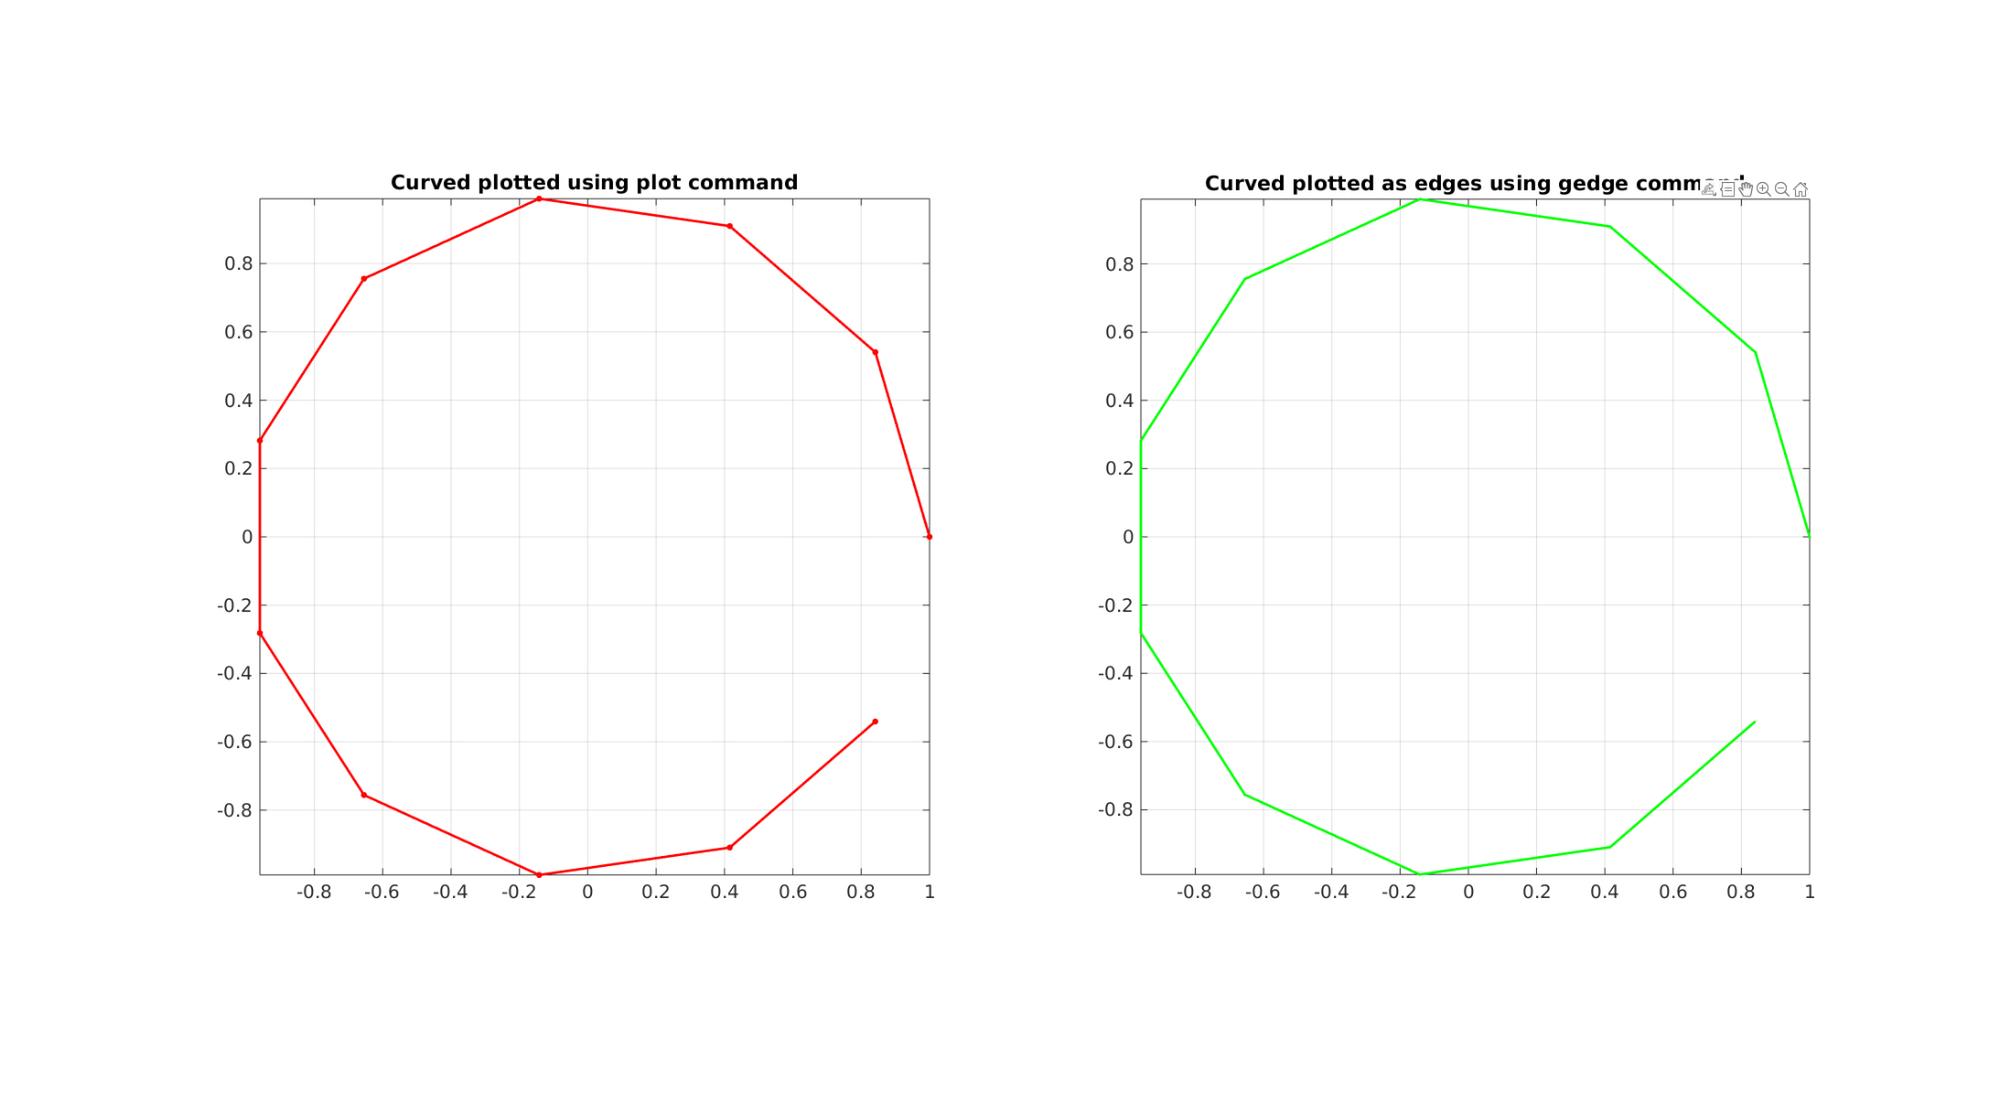
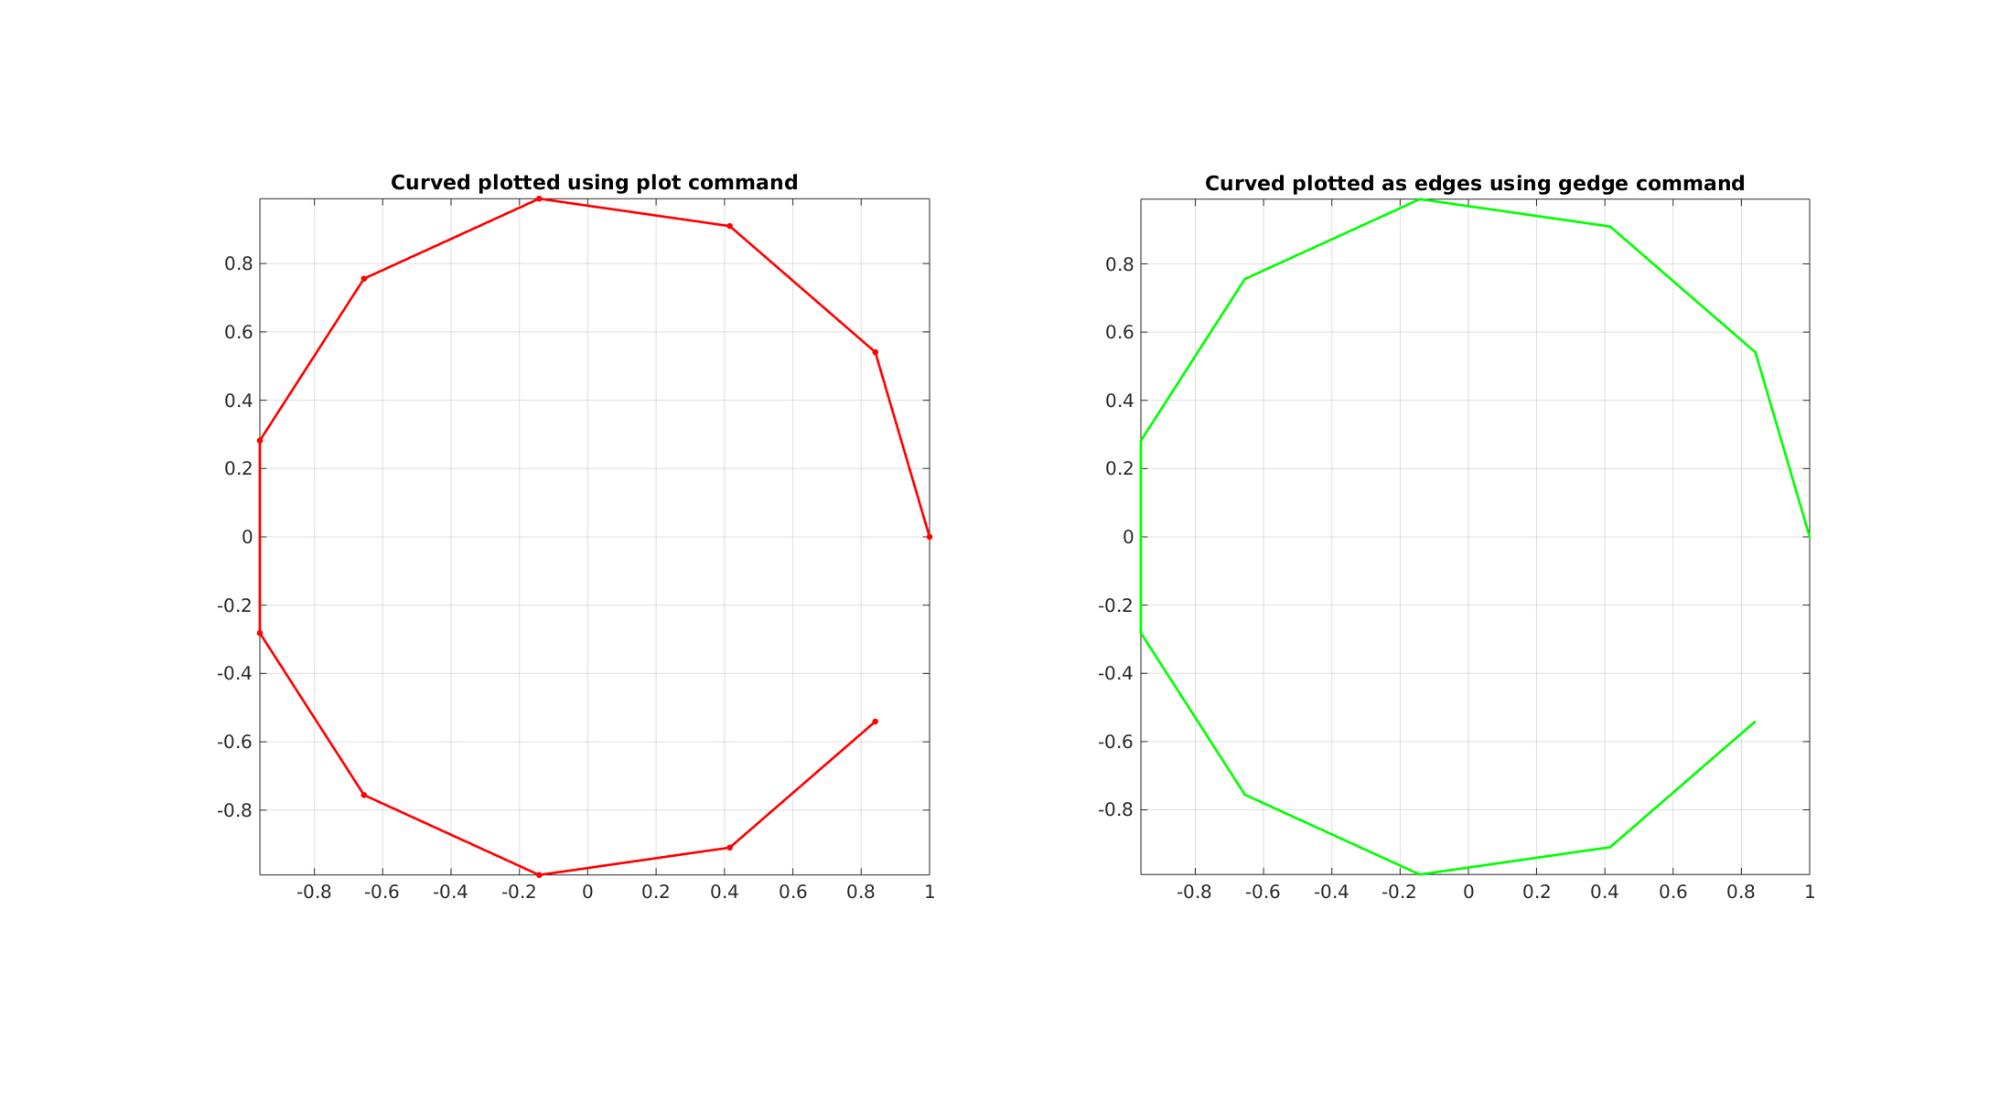
Example 1: Creating an edge array for a curve
Create example curve data
t=linspace(0,2*pi,12)';
t=t(1:end-1);
V=[cos(t) sin(t) zeros(size(t))]; %Curve vertices
n=size(V,1); %Number of points in curve
ind=1:1:n; %Curve point indices
Get curve edge array
% Use vertices
[E]=curveToEdgeList(V)

% Use number of points
[E]=curveToEdgeList(n)

% Use curve indices
[E]=curveToEdgeList(ind)
E =

     1     2
     2     3
     3     4
     4     5
     5     6
     6     7
     7     8
     8     9
     9    10
    10    11


E =

     1     2
     2     3
     3     4
     4     5
     5     6
     6     7
     7     8
     8     9
     9    10
    10    11


E =

     1     2
     2     3
     3     4
     4     5
     5     6
     6     7
     7     8
     8     9
     9    10
    10    11
Visualization
cFigure;
subplot(1,2,1); hold on;
title('Curved plotted using plot command');
plotV(V,'r.-','LineWidth',lineWidth,'MarkerSize',markerSize);
axis tight; axis equal; grid on; box on; view(2);
set(gca,'FontSize',fontSize);
subplot(1,2,2); hold on;
title('Curved plotted as edges using gedge command');
gedge(E,V,'g',2);
axis tight; axis equal; grid on; box on; view(2);
set(gca,'FontSize',fontSize);
drawnow;
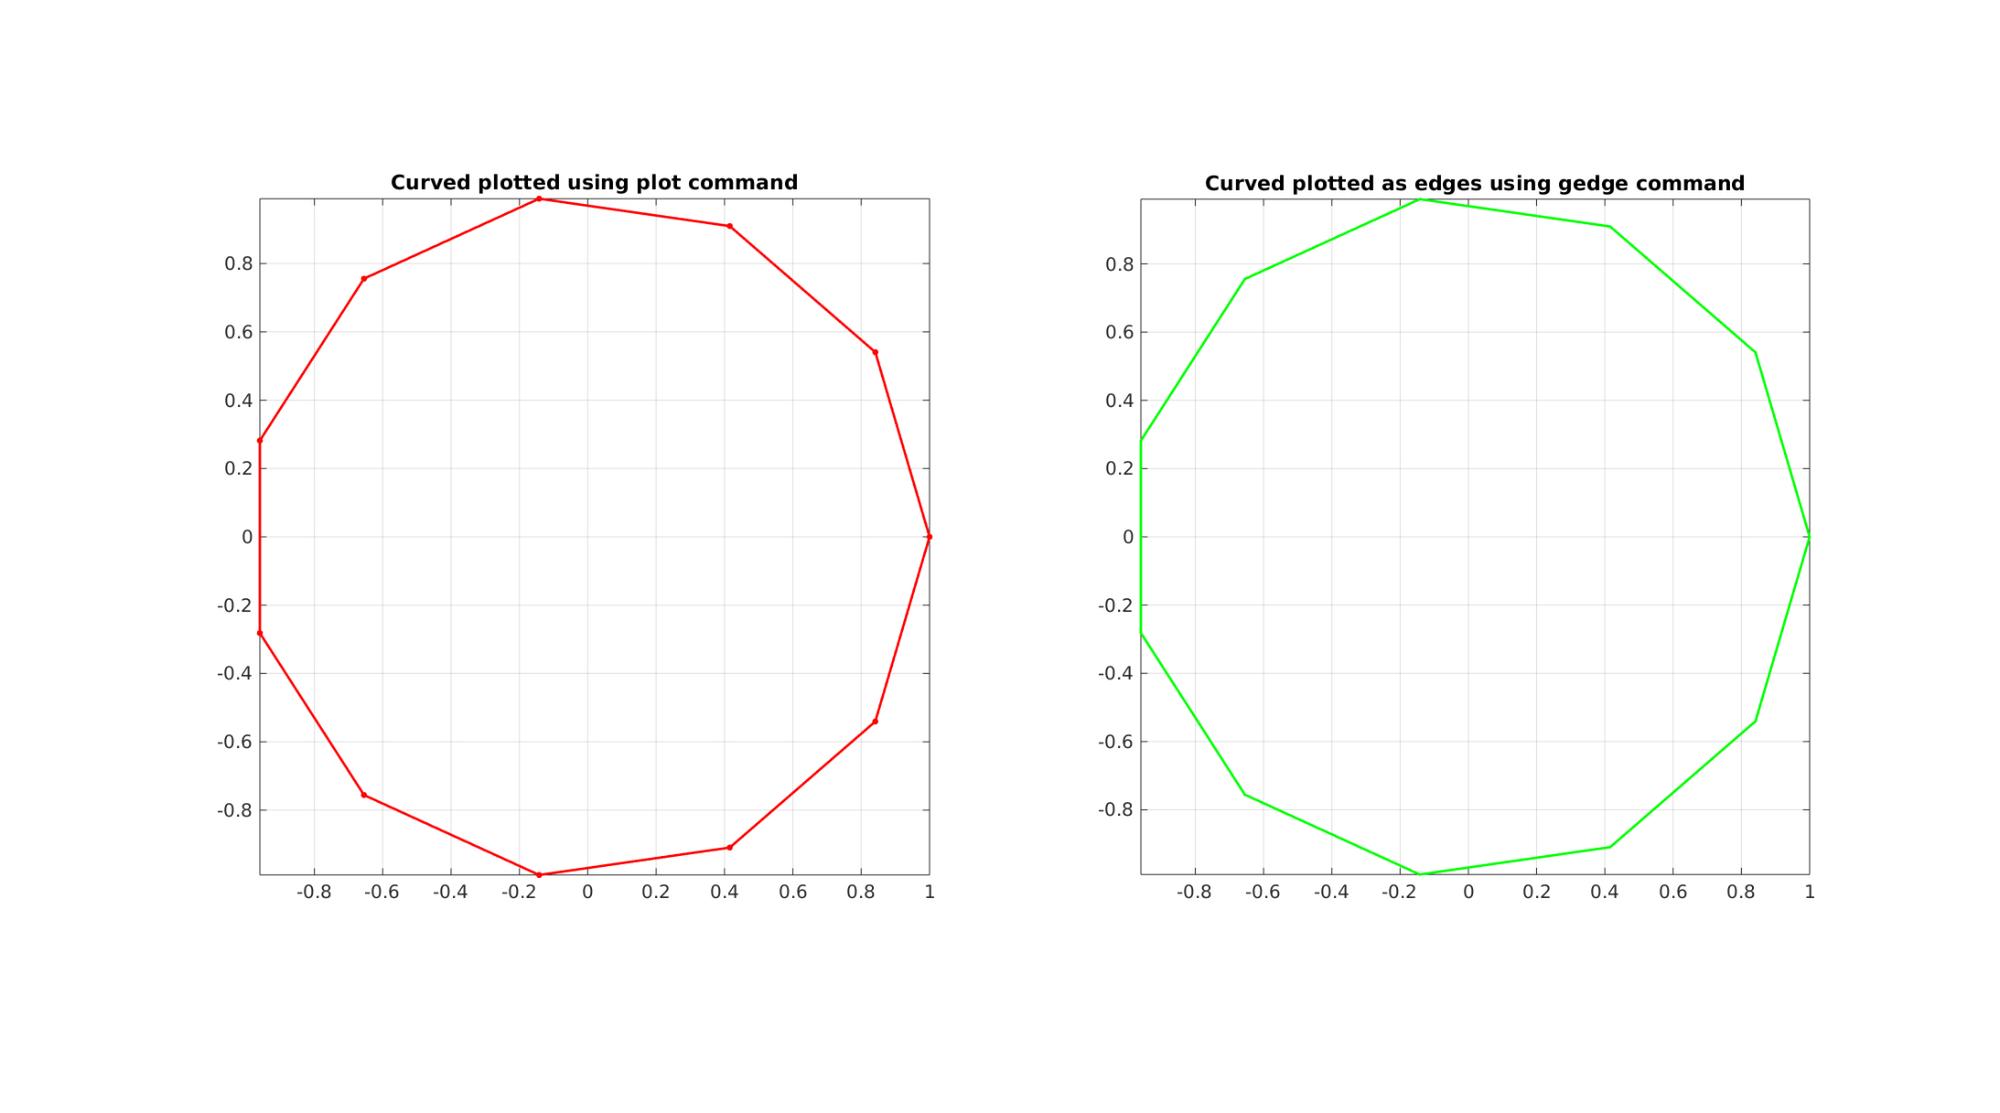
Example 2: Using closeCurveOpt
Use closeCurveOpt
closeCurveOpt=1;
[E]=curveToEdgeList(ind,closeCurveOpt)
E =

     1     2
     2     3
     3     4
     4     5
     5     6
     6     7
     7     8
     8     9
     9    10
    10    11
    11     1
Visualization
cFigure;
subplot(1,2,1); hold on;
title('Curved plotted using plot command');
plotV(V([1:end 1],:),'r.-','LineWidth',lineWidth,'MarkerSize',markerSize);
axis tight; axis equal; grid on; box on; view(2);
set(gca,'FontSize',fontSize);
subplot(1,2,2); hold on;
title('Curved plotted as edges using gedge command');
gedge(E,V,'g',2);
axis tight; axis equal; grid on; box on; view(2);
set(gca,'FontSize',fontSize);
drawnow;

GIBBON www.gibboncode.org
Kevin Mattheus Moerman, [email protected]
GIBBON footer text
License: https://github.com/gibbonCode/GIBBON/blob/master/LICENSE
GIBBON: The Geometry and Image-based Bioengineering add-On. A toolbox for image segmentation, image-based modeling, meshing, and finite element analysis.
Copyright (C) 2006-2023 Kevin Mattheus Moerman and the GIBBON contributors
This program is free software: you can redistribute it and/or modify it under the terms of the GNU General Public License as published by the Free Software Foundation, either version 3 of the License, or (at your option) any later version.
This program is distributed in the hope that it will be useful, but WITHOUT ANY WARRANTY; without even the implied warranty of MERCHANTABILITY or FITNESS FOR A PARTICULAR PURPOSE. See the GNU General Public License for more details.
You should have received a copy of the GNU General Public License along with this program. If not, see http://www.gnu.org/licenses/.