DEMO_febio_0020_vessel_balloon_inflate
Below is a demonstration for:
- Building geometry for a cylindrical vessel with tetrahedral elements
- Defining the boundary conditions
- Coding the febio structure
- Running the model
- Importing and visualizing the displacement results
Contents
- Keywords
- Plot settings
- Control parameters
- Creating model boundary polygons
- Creating model boundary surfaces
- Defining the boundary conditions
- Create node set for a ring at the centre
- Setup structure to define an Abaqus inp file
- Run the job using Abaqus
- Creating the INP file
- Run the job using Abaqus
- Import and visualize abaqus results
- Calculate segment area change as a function of time and pressure
Keywords
- febio_spec version 2.5
- febio, FEBio
- vessel, cylinder, balloon
- prescribed displacement
- contact, sliding
- hexahedral elements, hex8
- tube, cylindrical
- static, solid, multistep
- hyperelastic, Ogden
- displacement logfile
- stress logfile
clear; close all; clc;
Plot settings
fontSize=20;
faceAlpha1=0.8;
markerSize=40;
lineWidth=3;
Control parameters
% Path names
defaultFolder = fileparts(fileparts(mfilename('fullpath')));
savePath=fullfile(defaultFolder,'data','temp');

% Defining file names
abaqusInpFileNamePart='tempModel';
abaqusInpFileName=fullfile(savePath,[abaqusInpFileNamePart,'.inp']); %INP file name
abaqusDATFileName=fullfile(savePath,[abaqusInpFileNamePart,'.dat']); %DAT file name

%Specifying geometry parameters vessel (mm)***
pointSpacing=2;
radiusOuter1=14;
radiusInner1=12;
radiusOuter2=14;
radiusInner2=12;
vesselLength=100;

%Loads
pressureValue=5e-3;

%Material
materialName='Ogden';
kFactor=25;
muOgden_1=0.06/2;
alphaOgden_1=36;
k=muOgden_1*kFactor;
D1=2/k;
a=2;

%Time stepping settings
numTimeSteps=20;
totalTime=1;
timeStepInitial=totalTime/numTimeSteps;
timeStepMinimum=timeStepInitial/100;
timeStepMaximum=timeStepInitial;
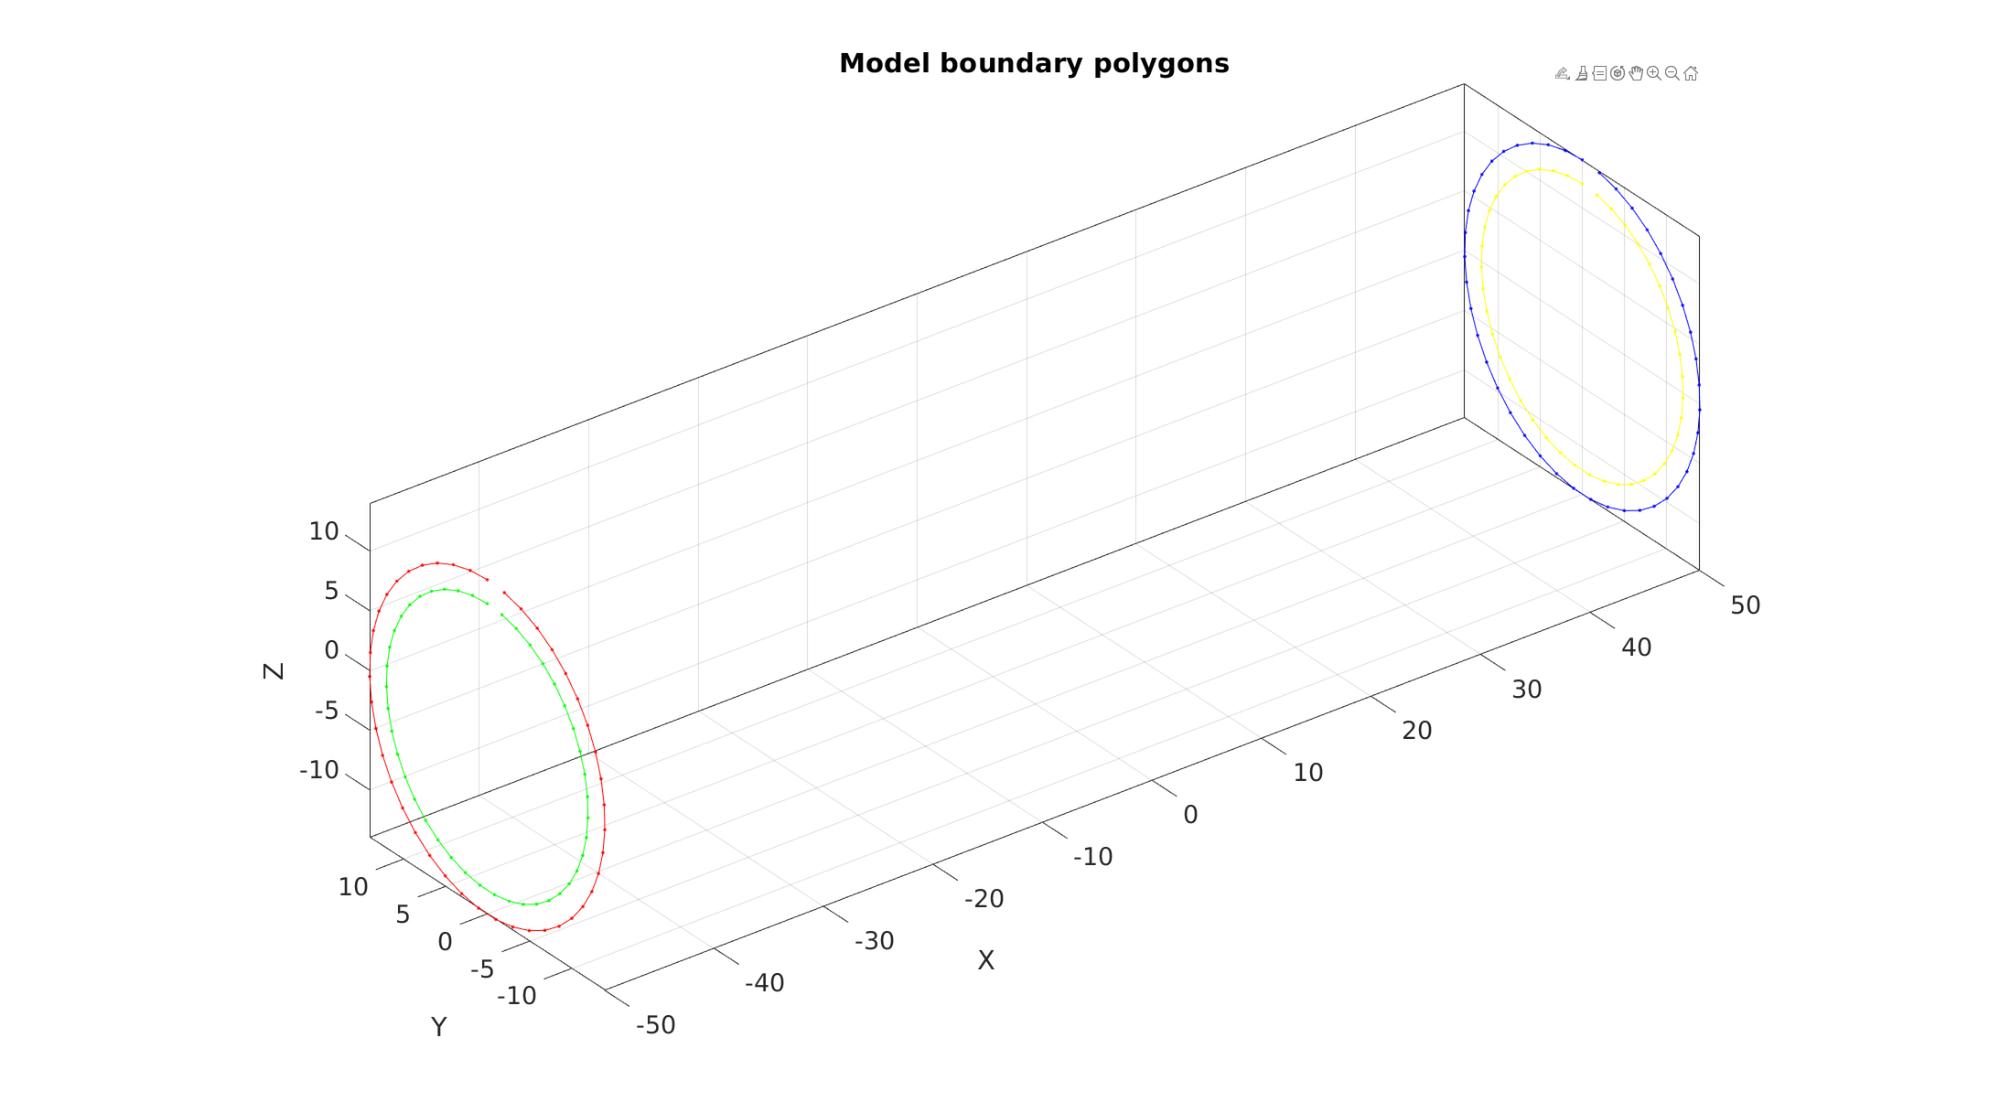
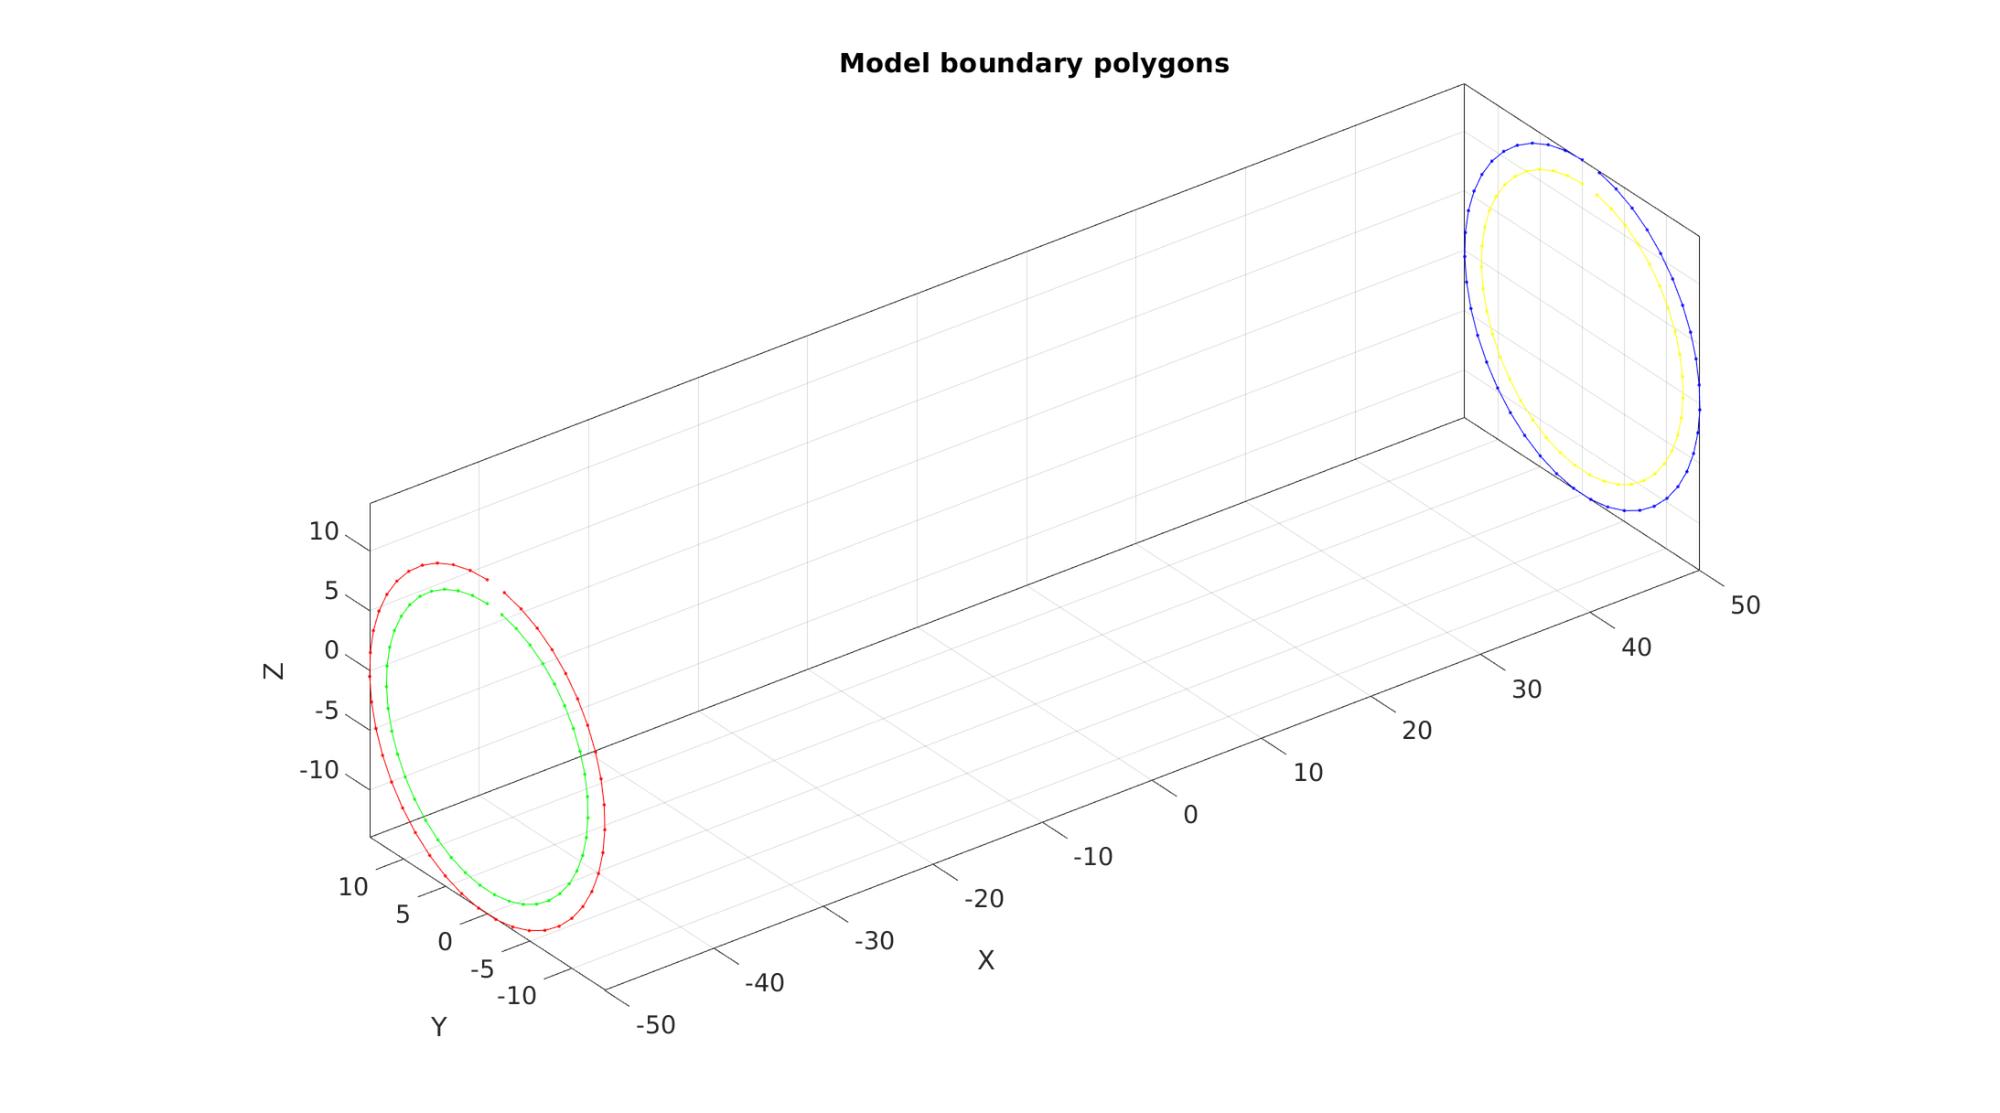
Creating model boundary polygons
nRad=round((2*pi*max([radiusOuter1 radiusOuter2]))/pointSpacing); %Number of radial steps

t=linspace(0,2*pi,nRad)'; %Angles
t=t(1:end-1); %take away last which equals start
v1_Outer=[-(vesselLength/2)*ones(size(t)) radiusOuter1*sin(t) radiusOuter1*cos(t)]; %Circular coordinates

t=linspace(0,2*pi,nRad)'; %Angles
t=t(1:end-1); %take away last which equals start
v2_Outer=[(vesselLength/2)*ones(size(t)) radiusOuter2*sin(t) radiusOuter2*cos(t)]; %Circular coordinates

t=linspace(0,2*pi,nRad)'; %Angles
t=t(1:end-1); %take away last which equals start
v1_Inner=[-(vesselLength/2)*ones(size(t)) radiusInner1*sin(t) radiusInner1*cos(t)]; %Circular coordinates

t=linspace(0,2*pi,nRad)'; %Angles
t=t(1:end-1); %take away last which equals start
v2_Inner=[(vesselLength/2)*ones(size(t)) radiusInner2*sin(t) radiusInner2*cos(t)]; %Circular coordinates
Plotting model boundary polygons
cFigure;
hold on;
title('Model boundary polygons','FontSize',fontSize);
plotV(v1_Outer,'r.-')
plotV(v1_Inner,'g.-')
plotV(v2_Outer,'b.-')
plotV(v2_Inner,'y.-')
axisGeom(gca,fontSize);
drawnow;
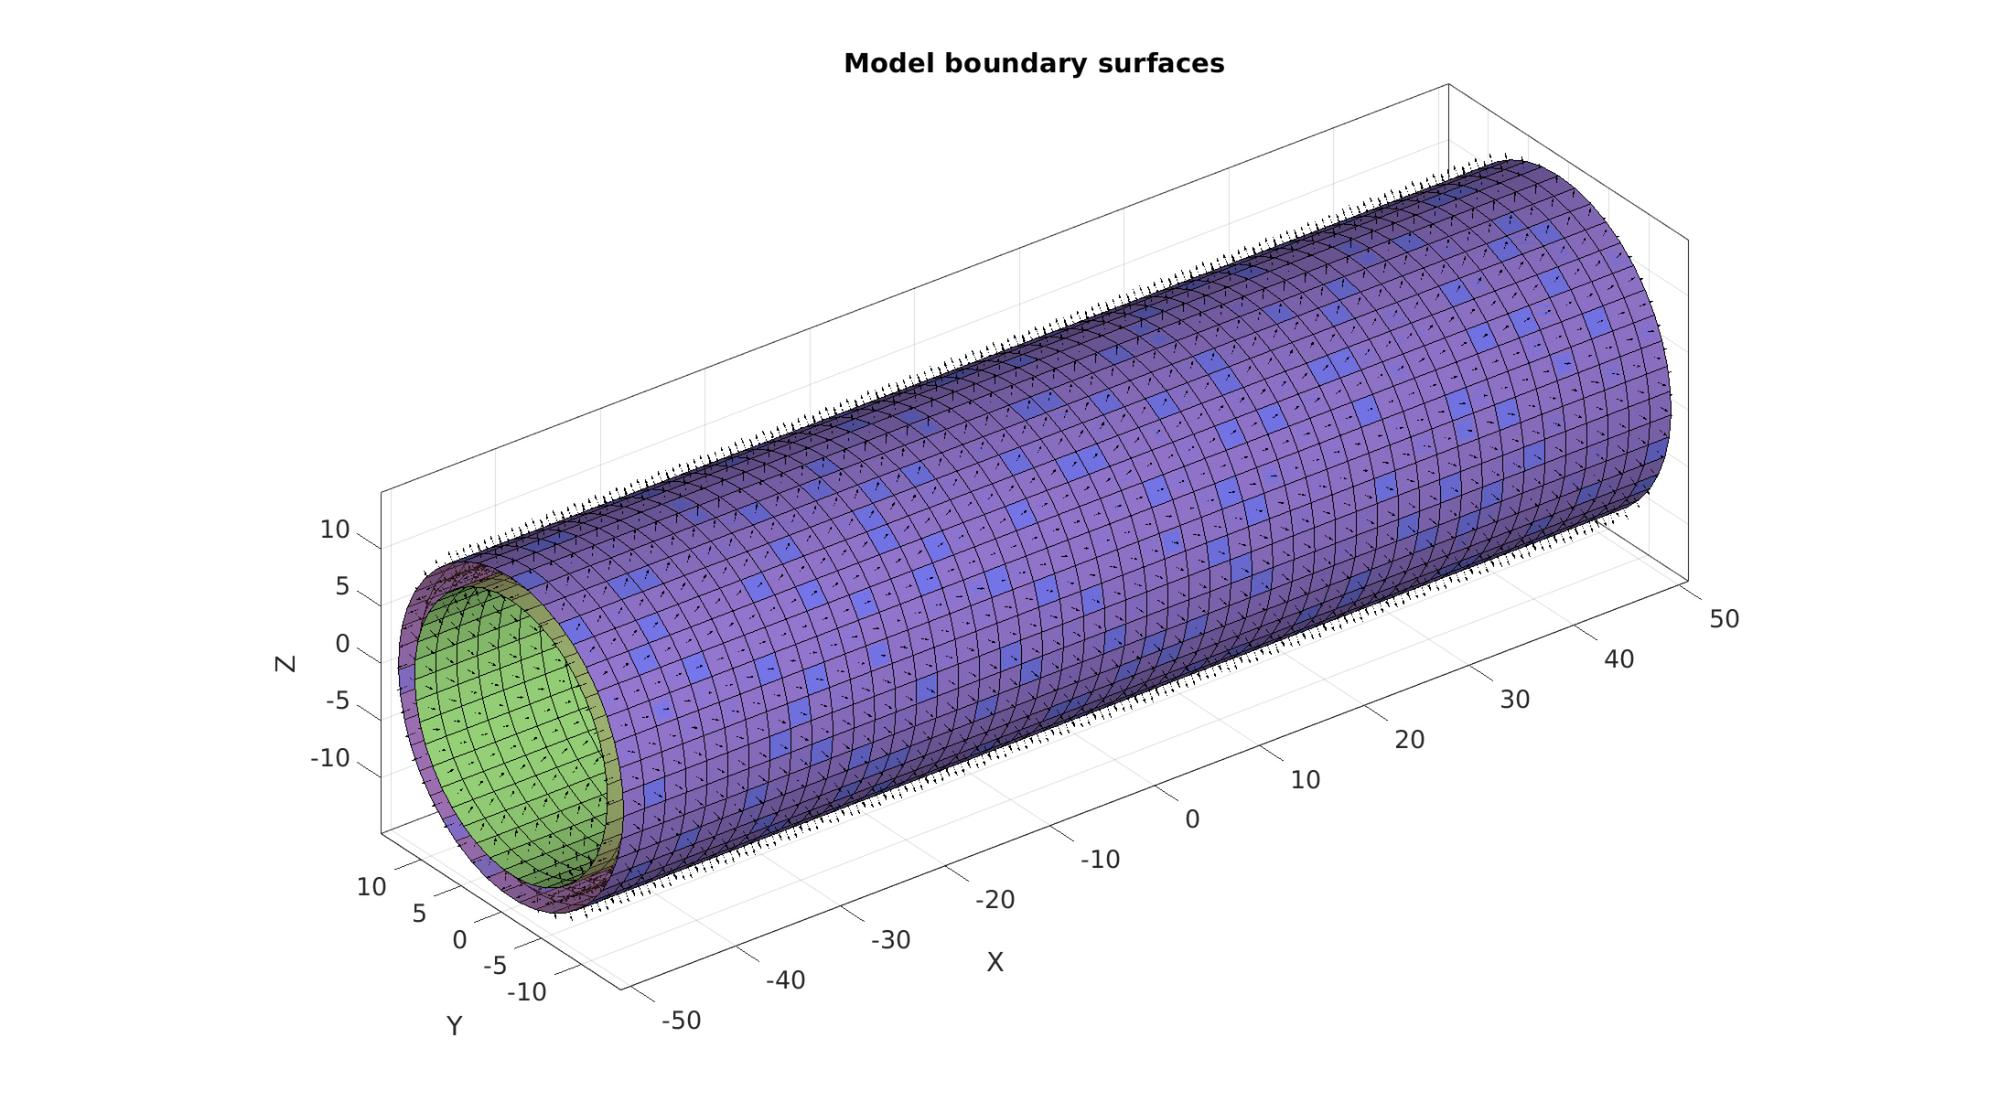
Creating model boundary surfaces
numSteps=round(vesselLength/pointSpacing);
numSteps=numSteps + iseven(numSteps);

controlStructLoft.numSteps=ceil(vesselLength./pointSpacing);
controlStructLoft.closeLoopOpt=1;
controlStructLoft.patchType='quad';
controlStructLoft.numSteps=numSteps;

%Meshing outer surface
[F1,V1,indStart1,indEnd1]=polyLoftLinear(v1_Outer,v2_Outer,controlStructLoft);

%Meshing inner surface
[F2,V2,indStart2,indEnd2]=polyLoftLinear(v1_Inner,v2_Inner,controlStructLoft);

%Compose hexahedral elements
indStart2=indStart2+size(V1,1);
indEnd2=indEnd2+size(V1,1);
F2=F2+size(V1,1);
ET=[F1 F2]; %hexahedral elements
VT=[V1;V2]; %Nodes

[FT]=element2patch(ET,[],'hex8');
indBoundary=tesBoundary(FT);
Fb=FT(indBoundary,:);
Plotting model boundary surfaces
cFigure;
hold on;
title('Model boundary surfaces','FontSize',fontSize);

gpatch(Fb,VT,'rw','none',0.25);
patchNormPlot(FT,VT);

gpatch(F1,VT,'bw');
patchNormPlot(F1,VT);

gpatch(F2,VT,'gw');
patchNormPlot(F2,VT);

colormap(gca,gjet(4));
% icolorbar;

axisGeom(gca,fontSize);
camlight headlight;
drawnow;
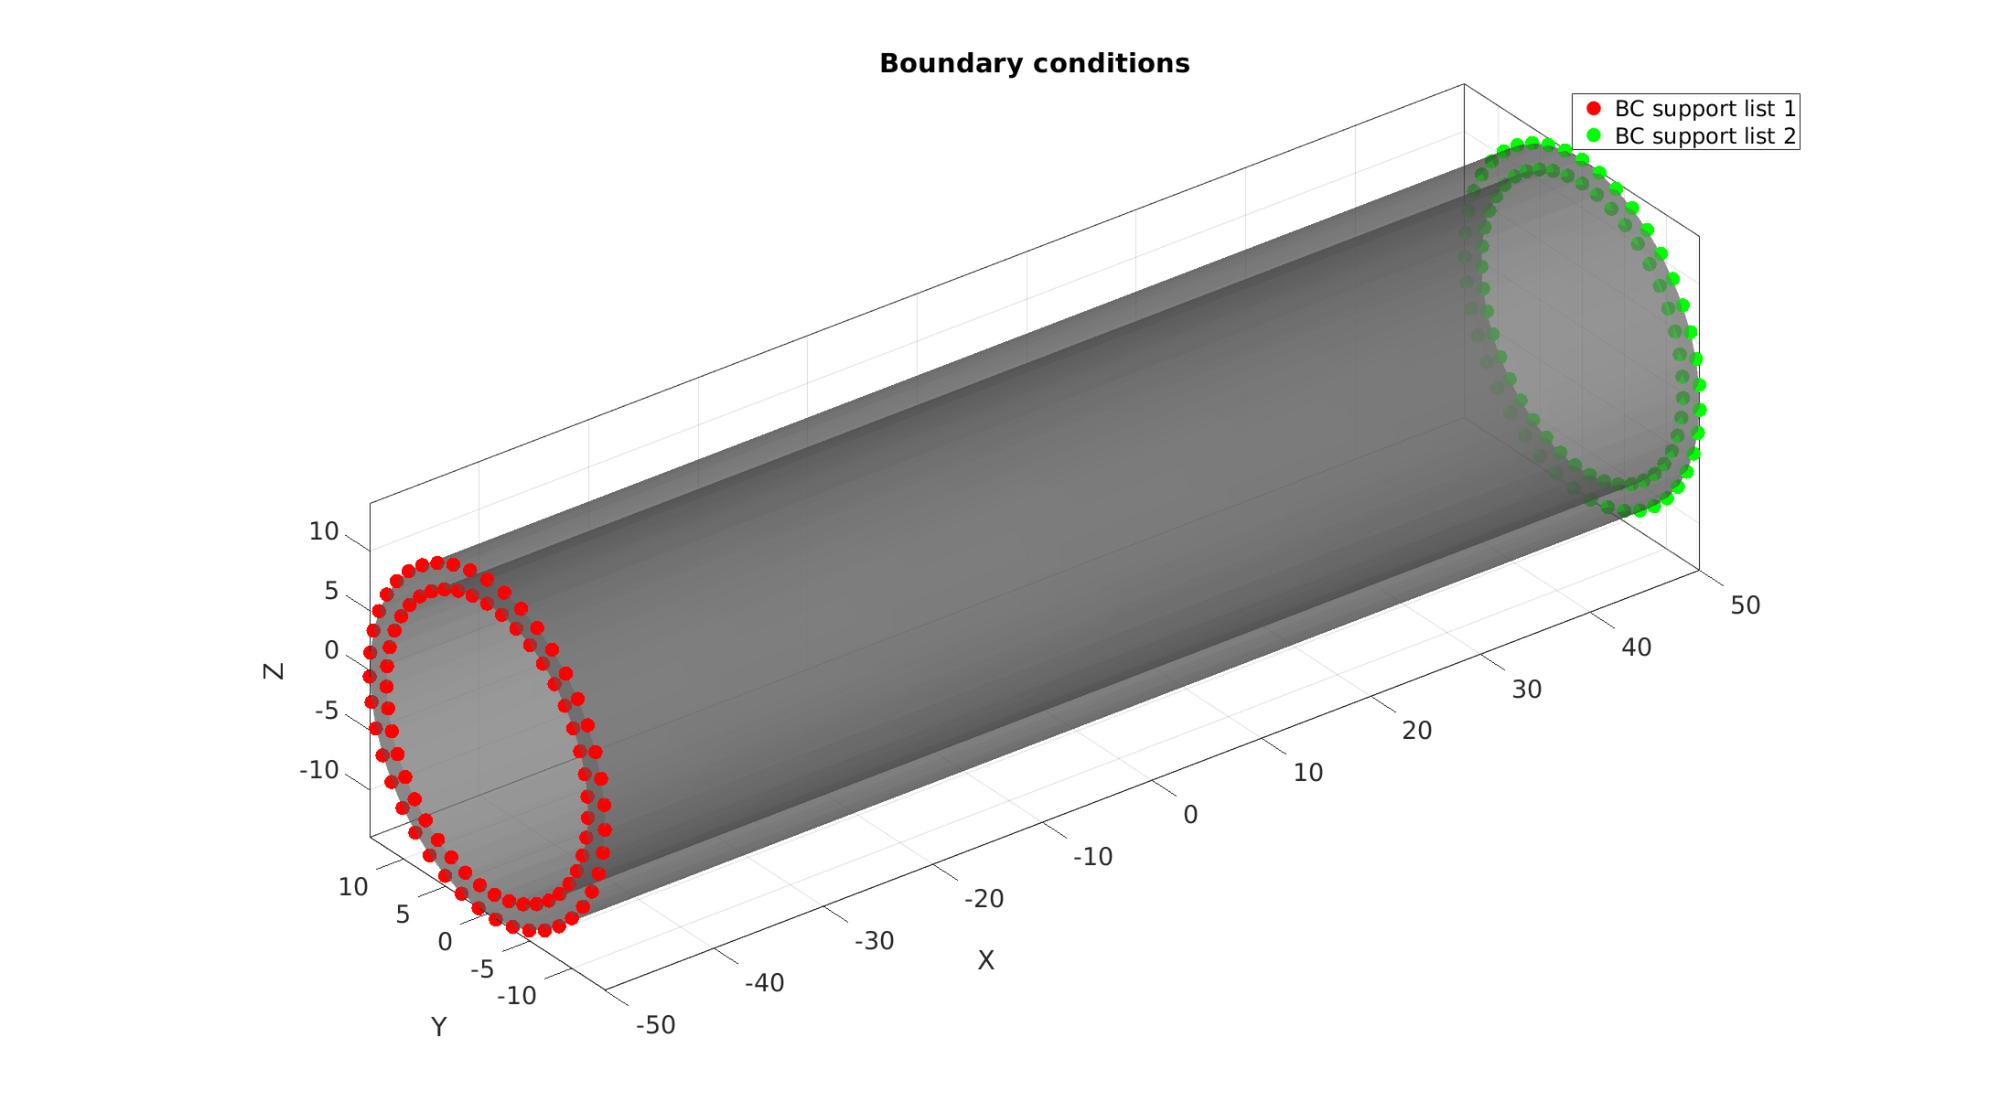
Defining the boundary conditions
The visualization of the model boundary shows colors for each side of the cube. These labels can be used to define boundary conditions.
%Define X supported node set
bcSupportList_1=unique([indStart1(:);indStart2(:)]); %Node set part of selected face
bcSupportList_2=unique([indEnd1(:);indEnd2(:)]); %Node set part of selected face
indNodesFix=[bcSupportList_1(:); bcSupportList_2(:)];

% %Define Y supported node set
% bcSupportList_Y=unique(Fb(Cb==4,:)); %Node set part of selected face
Visualizing boundary conditions. Markers plotted on the semi-transparent model denote the nodes in the various boundary condition lists.
cFigure;
title('Boundary conditions','FontSize',fontSize);
hold on;

gpatch(Fb,VT,'kw','none',0.5);

hl(1)=plotV(VT(bcSupportList_1,:),'r.','MarkerSize',markerSize);
hl(2)=plotV(VT(bcSupportList_2,:),'g.','MarkerSize',markerSize);

legend(hl,{'BC support list 1','BC support list 2'});

axisGeom(gca,fontSize);
camlight headlight;
drawnow;

Visualizing boundary conditions. Markers plotted on the semi-transparent model denote the nodes in the various boundary condition lists.
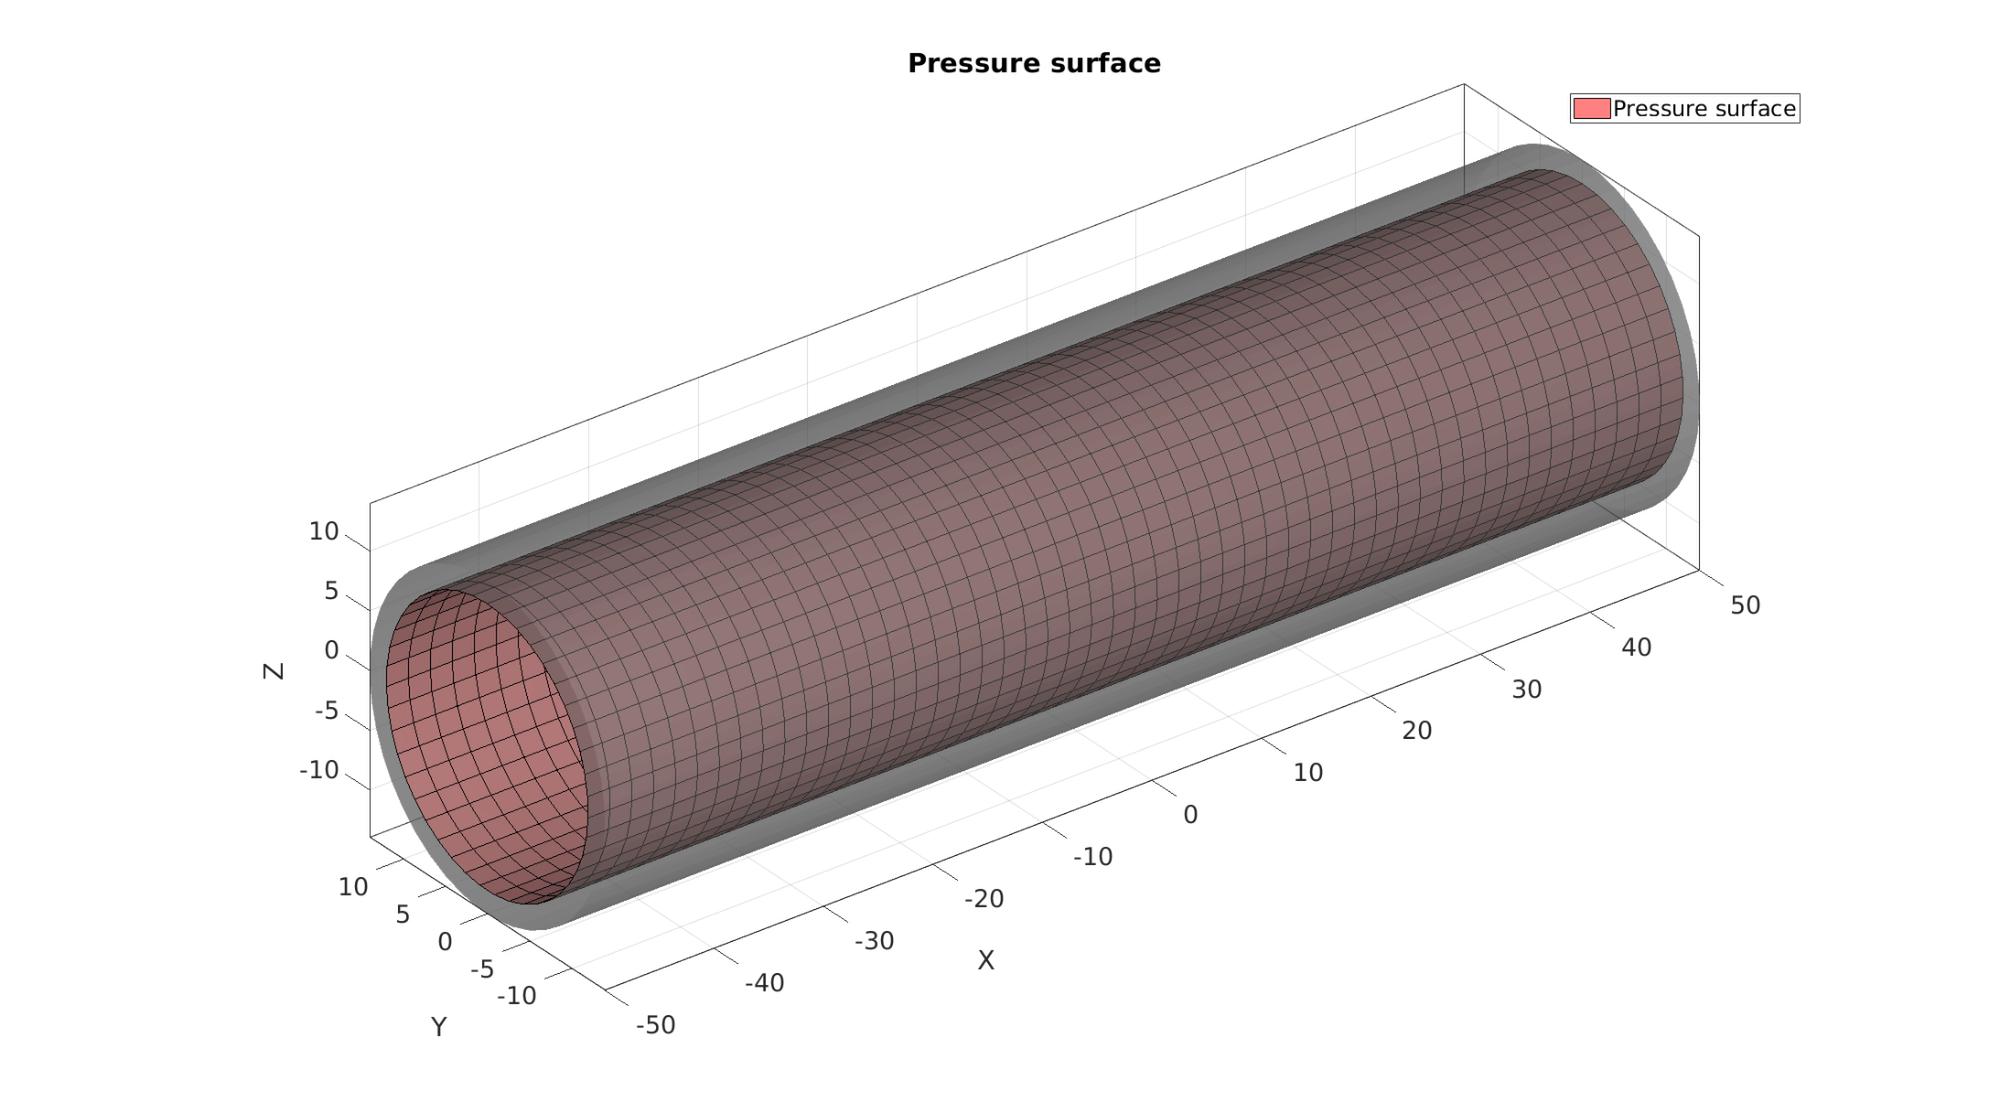
cFigure;
title('Pressure surface','FontSize',fontSize);
hold on;

gpatch(Fb,VT,'kw','none',0.5);

clear hl;
hl(1)=gpatch(F2,VT,'rw','k',1);
legend(hl,{'Pressure surface'});

axisGeom(gca,fontSize);
camlight headlight;
drawnow;

indicesNodesInner=unique(F2(:));
indicesElementsInner=1:1:size(ET,1); %find(any(ismember(ET,indicesNodesInner),2));

FT_inner=ET(:,5:8);
Visualizing inner surface
cFigure;
title('Pressure surface','FontSize',fontSize);
hold on;

gpatch(Fb,VT,'kw','none',0.5);

clear hl;
hl(1)=gpatch(FT_inner,VT,'rw','k',1);

legend(hl,{'Pressure surface'});

axisGeom(gca,fontSize);
camlight headlight;
drawnow;


Create node set for a ring at the centre
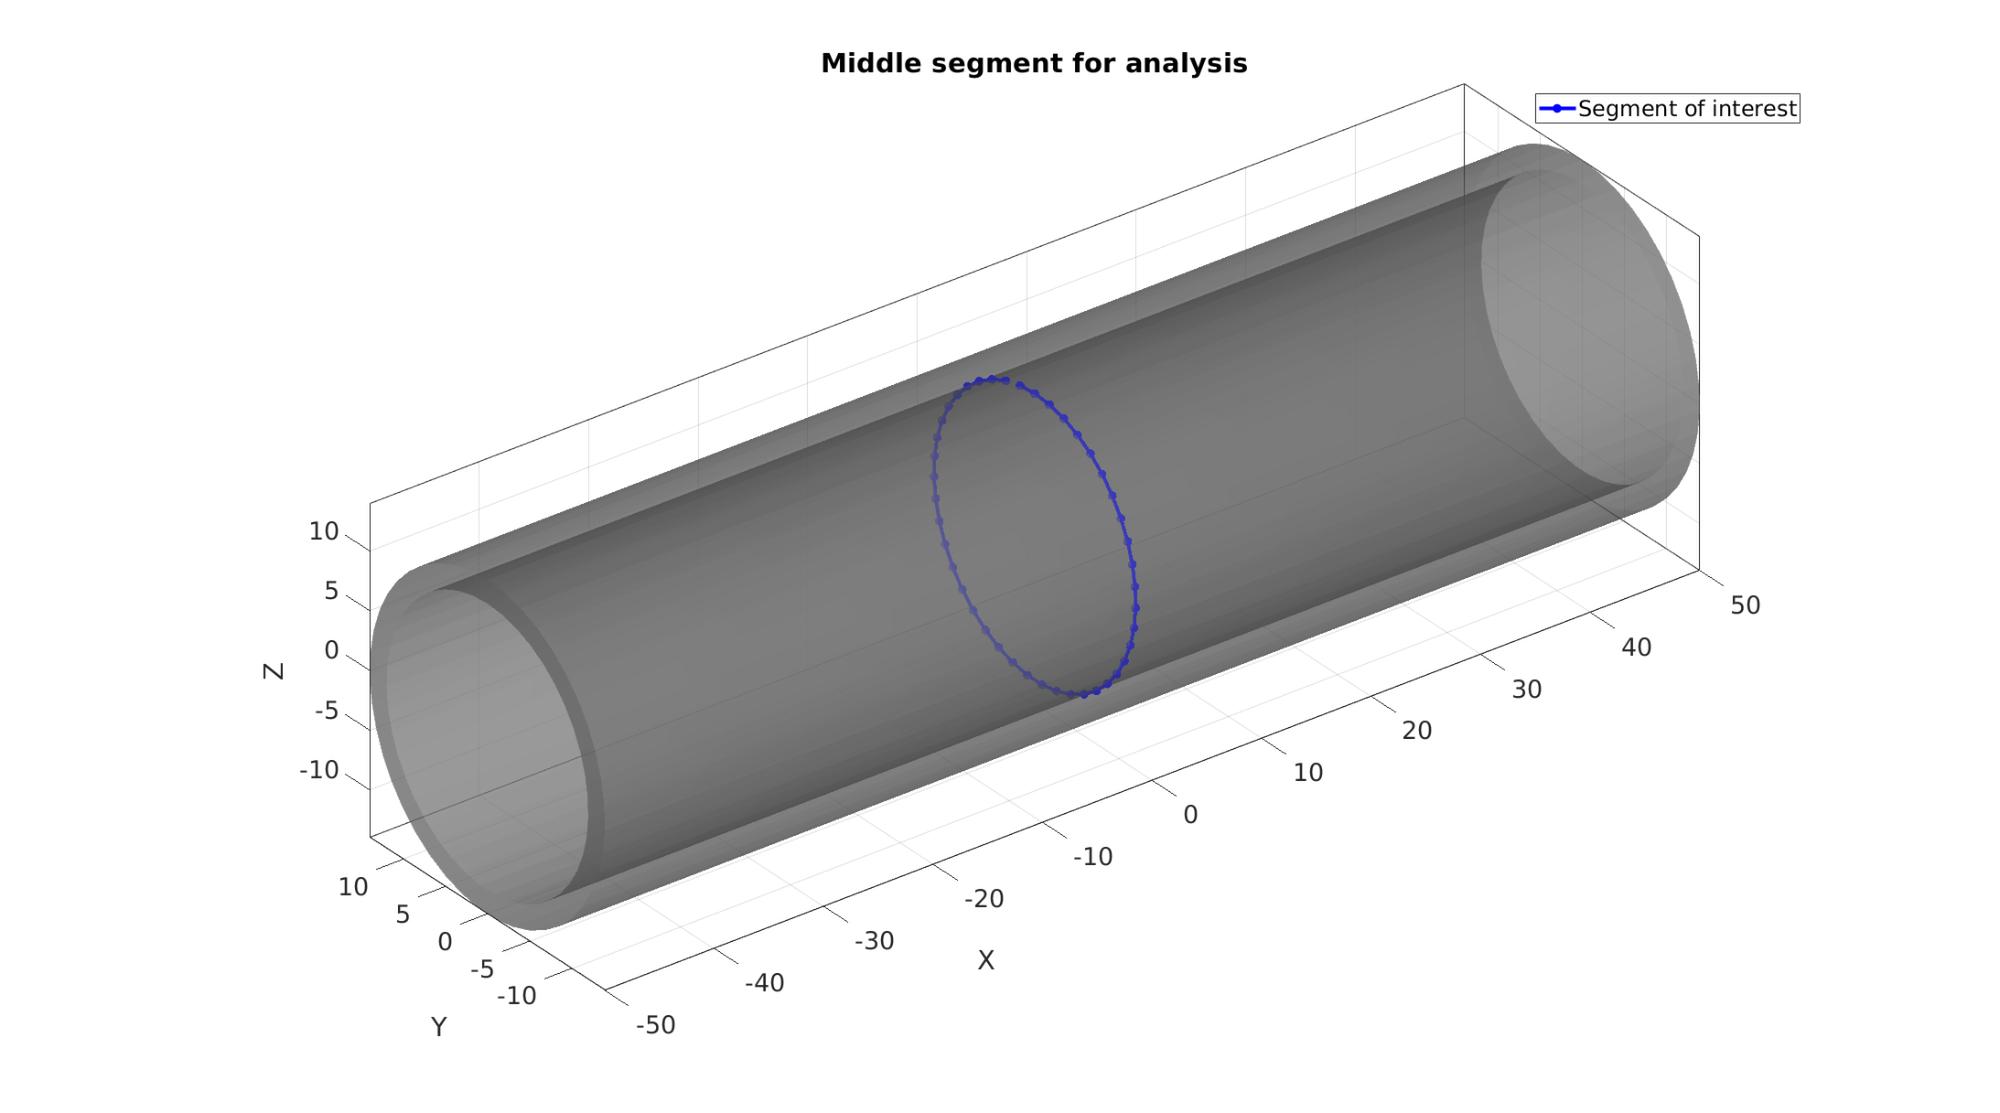
logicLeft=VT(:,1)<=(0+eps(0));
logicLeftFaces=all(logicLeft(F2),2);

F2_left=F2(logicLeftFaces,:);

Eb_left=patchBoundary(F2_left);
X=VT(:,1);
X_Eb_left=X(Eb_left);
logicKeep=all(X_Eb_left>=(0-eps(0)),2);
E_segment=Eb_left(logicKeep,:);
indSegment=edgeListToCurve(E_segment); %Convert to curve
indSegment=indSegment(1:end-1); %Remove double end point

segmentCurve_cell={indSegment};
cFigure;
title('Middle segment for analysis','FontSize',fontSize);
hold on;

gpatch(Fb,VT,'kw','none',0.5);

% gpatch(F2_left,VT,'rw','k',1);

clear hl;
hl(1)=plotV(VT(indSegment,:),'b.-','LineWidth',3,'MarkerSize',25);

legend(hl,{'Segment of interest'});

axisGeom(gca,fontSize);
camlight headlight;
drawnow;

Setup structure to define an Abaqus inp file
%%--> Heading
abaqus_spec.Heading.COMMENT{1}='Job name: AORTA';
abaqus_spec.Heading.COMMENT{2}='Generated by: GIBBON';

%%--> Preprint
abaqus_spec.Preprint.ATTR.echo='NO';
abaqus_spec.Preprint.ATTR.model='NO';
abaqus_spec.Preprint.ATTR.history='NO';
abaqus_spec.Preprint.ATTR.contact='NO';

%--> Part
partName='Aorta';

% Node
nodeIds=(1:1:size(VT,1))';
abaqus_spec.Part.COMMENT='This section defines the part geometry in terms of nodes and elements';
abaqus_spec.Part.ATTR.name=partName;
abaqus_spec.Part.Node={nodeIds,VT};

% Element
elementIds=(1:1:size(ET,1))';
abaqus_spec.Part.Element{1}.ATTR.type='C3D8';%'C3D8R';
abaqus_spec.Part.Element{1}.VAL={elementIds,ET};

% Element sets
abaqus_spec.Part.Elset{1}.ATTR.elset='Set-1';
abaqus_spec.Part.Elset{1}.VAL=elementIds(:)';

surfaceElementSetName='elementSetInnerSurface';
abaqus_spec.Part.Elset{2}.ATTR.elset=surfaceElementSetName;
abaqus_spec.Part.Elset{2}.ATTR.internal=''; %Remains hidden uppon import
abaqus_spec.Part.Elset{2}.VAL=indicesElementsInner(:)';

% Surfaces
sidePick=2;
innerSurfaceName=[surfaceElementSetName,'_side',num2str(sidePick)];
abaqus_spec.Part.Surface{1}.ATTR.type='ELEMENT';
abaqus_spec.Part.Surface{1}.ATTR.name=innerSurfaceName;
abaqus_spec.Part.Surface{1}.VAL={surfaceElementSetName,['S',num2str(sidePick)]};

% Sections
abaqus_spec.Part.Solid_section.ATTR.elset='Set-1';
abaqus_spec.Part.Solid_section.ATTR.material=materialName;

%--> Assembly
instanceName='Aorta-assembly';
abaqus_spec.Assembly.ATTR.name='Assembly-1';
abaqus_spec.Assembly.Instance.ATTR.name=instanceName;
abaqus_spec.Assembly.Instance.ATTR.part='Aorta';

abaqus_spec.Assembly.Nset{1}.ATTR.nset='Set-1';
abaqus_spec.Assembly.Nset{1}.ATTR.instance=instanceName;
abaqus_spec.Assembly.Nset{1}.VAL=indicesNodesInner(:)';

%Add segment curve node sets
for q=1:1:numel(segmentCurve_cell)
    indNow=numel(abaqus_spec.Assembly.Nset)+1;
    abaqus_spec.Assembly.Nset{indNow}.ATTR.nset=['Set-',num2str(indNow)];
    abaqus_spec.Assembly.Nset{indNow}.ATTR.instance=instanceName;
    abaqus_spec.Assembly.Nset{indNow}.VAL=segmentCurve_cell{q};
end

%Add fix node set
indNow=numel(abaqus_spec.Assembly.Nset)+1;
setNameFix=['Set-',num2str(indNow)];
abaqus_spec.Assembly.Nset{indNow}.ATTR.nset=setNameFix;
abaqus_spec.Assembly.Nset{indNow}.ATTR.instance=instanceName;
abaqus_spec.Assembly.Nset{indNow}.VAL=indNodesFix(:)';

%Add output node set
outputNodeSetName='all';
abaqus_spec.Assembly.Nset{5}.ATTR.nset=outputNodeSetName;
abaqus_spec.Assembly.Nset{5}.ATTR.instance=instanceName;
abaqus_spec.Assembly.Nset{5}.VAL=1:1:size(VT,1);

% Create assembly level element set for surface
surfaceElementSetName='elementSetInnerSurface';
abaqus_spec.Assembly.Elset{1}.ATTR.elset=surfaceElementSetName;
abaqus_spec.Assembly.Elset{1}.ATTR.internal=''; %Remains hidden uppon import
abaqus_spec.Assembly.Elset{1}.ATTR.instance=instanceName;
abaqus_spec.Assembly.Elset{1}.VAL=indicesElementsInner(:)';

% Create assembly level surface from element set
sidePick=2;
innerSurfaceName=[surfaceElementSetName,'_side',num2str(sidePick)];
abaqus_spec.Assembly.Surface{1}.ATTR.type='ELEMENT';
abaqus_spec.Assembly.Surface{1}.ATTR.name=innerSurfaceName;
abaqus_spec.Assembly.Surface{1}.VAL={surfaceElementSetName,['S',num2str(sidePick)]};

%%--> Material
abaqus_spec.Material.ATTR.name=materialName;
% abaqus_spec.Material.Hyperelastic.VAL=[muOgden_1 alphaOgden_1 D1]; %Single term Ogden
abaqus_spec.Material.Hyperelastic.VAL=[muOgden_1 alphaOgden_1 muOgden_1 -alphaOgden_1 D1 D1]; %Two term Ogden
abaqus_spec.Material.Hyperelastic.ATTR.n=2;
abaqus_spec.Material.Hyperelastic.ATTR.ogden='';
%%--> Step
abaqus_spec.Step.ATTR.name='Step-1';
abaqus_spec.Step.ATTR.nlgeom='YES';

abaqus_spec.Step.Static=[timeStepInitial totalTime timeStepMinimum timeStepMaximum];

% Boundary
setNameFix=abaqus_spec.Assembly.Nset{indNow}.ATTR.nset;
abaqus_spec.Step.Boundary{1}.VAL={setNameFix,[1,1]};
abaqus_spec.Step.Boundary{2}.VAL={setNameFix,[2,2]};
abaqus_spec.Step.Boundary{3}.VAL={setNameFix,[3,3]};

% Loads
% ** LOADS
% **
% ** Name: Load-1   Type: Pressure
% *Dsload
% Surf-1, P, 0.00533
% **
abaqus_spec.Step.Dsload{1}.VAL={innerSurfaceName,'P',pressureValue};

%Output
abaqus_spec.Step.Restart.ATTR.write='';
abaqus_spec.Step.Restart.ATTR.frequency=0;

abaqus_spec.Step.Output{1}.ATTR.field='';
abaqus_spec.Step.Output{1}.ATTR.variable='PRESELECT';
abaqus_spec.Step.Output{2}.ATTR.history='';
abaqus_spec.Step.Output{2}.ATTR.variable='PRESELECT';
abaqus_spec.Step.Node_print.ATTR.nset=outputNodeSetName;
abaqus_spec.Step.Node_print.ATTR.frequency = 1;
abaqus_spec.Step.Node_print.VAL='COORD';
abaqus_spec.Step.El_print.VAL='S';
Run the job using Abaqus
lockFileName=fullfile(savePath,[abaqusInpFileNamePart,'.lck']);
if exist(lockFileName,'file')
    warning('Lockfile found and deleted')
    delete(lockFileName);
end
Creating the INP file
You can use abaqusStruct2inp to write the structure data to a file.
abaqusStruct2inp(abaqus_spec,abaqusInpFileName);
Run the job using Abaqus
lockFileName=fullfile(savePath,[abaqusInpFileNamePart,'.lck']);
if exist(lockFileName,'file')
    warning('Lockfile found and deleted')
    delete(lockFileName);
end
oldPath=pwd; %Get current working directory
cd(savePath); %Set new working directory to match save patch

abaqusPath='abaqus';%'/usr/bin/abaqus'; %Abaqus excute command or path
runFlag=system([abaqusPath,' inp=',abaqusInpFileName,' job=',abaqusInpFileNamePart,' interactive ask_delete=OFF']);

cd(oldPath); %Restore working directory
/bin/bash: line 1: abaqus: command not found
Import and visualize abaqus results
Importing the abaqus .dat file
[abaqusData]=importAbaqusDat(abaqusDATFileName);
Error using textscan
Invalid file identifier. Use fopen to generate a valid file identifier.

Error in txtfile2cell (line 16)
T=textscan(fid,'%s','delimiter', '\n','Whitespace','');

Error in importAbaqusDat (line 61)
T=txtfile2cell(fileName);

Error in DEMO_abaqus_0003_cylinder_inflate (line 430)
[abaqusData]=importAbaqusDat(abaqusDATFileName);
Plotting the simulated results using anim8 to visualize and animate deformations
%Getting final nodal coordinates
V_def=[abaqusData.STEP(1).INCREMENT(end).nodeOutput.data.COOR1...
    abaqusData.STEP(1).INCREMENT(end).nodeOutput.data.COOR2...
    abaqusData.STEP(1).INCREMENT(end).nodeOutput.data.COOR3];
U=V_def-VT; %Displacements

colorDataVertices=sqrt(sum(U.^2,2)); %Displacement magnitude data for all vertices
colorDataFaces=vertexToFaceMeasure(Fb,colorDataVertices); %Same for selection of faces

timeVec=[0 abaqusData.STEP(1).INCREMENT(:).TOTAL_TIME_COMPLETED];

% Get limits for plotting
minV=min([VT;V_def],[],1); %Minima
maxV=max([VT;V_def],[],1); %Maxima

indSegmentPlot=[indSegment(:);indSegment(1)];

% Create basic view and store graphics handle to initiate animation
hf=cFigure; %Open figure
hold on;
gtitle([abaqusInpFileNamePart,': Press play to animate']);
hp=gpatch(Fb,V_def,colorDataFaces,'none',0.5); %Add graphics object to animate
hp2=plotV(V_def(indSegmentPlot,:),'k-','LineWidth',3,'MarkerSize',25);
% gpatch(Fb,VT,0.5*ones(1,3),'none',0.25); %A static graphics object
axisGeom(gca,fontSize);
colormap(gjet(250)); colorbar;
% caxis([0 max(colorDataVertices)]);
axis([minV(1) maxV(1) minV(2) maxV(2) minV(3) maxV(3)]); %Set axis limits statically
view(130,25); %Set view direction
camlight headlight;

% Set up animation features
animStruct.Time=timeVec; %The time vector
for qt=1:1:numel(timeVec) %Loop over time increments
    if qt>1
        V_def=[abaqusData.STEP(1).INCREMENT(qt-1).nodeOutput.data.COOR1...
               abaqusData.STEP(1).INCREMENT(qt-1).nodeOutput.data.COOR2...
               abaqusData.STEP(1).INCREMENT(qt-1).nodeOutput.data.COOR3];
    else
        V_def=VT;
    end
    U=V_def-VT; %Displacements
    colorDataVertices=sqrt(sum(U.^2,2)); %Displacement magnitude data for all vertices
    colorDataFaces=vertexToFaceMeasure(Fb,colorDataVertices); %Same for selection of faces

    %Set entries in animation structure
    animStruct.Handles{qt}=[hp hp hp2 hp2 hp2]; %Handles of objects to animate
    animStruct.Props{qt}={'Vertices','CData','XData','YData','ZData'}; %Properties of objects to animate
    animStruct.Set{qt}={V_def,colorDataFaces,V_def(indSegmentPlot,1),V_def(indSegmentPlot,2),V_def(indSegmentPlot,3)}; %Property values for to set in order to animate
end
anim8(hf,animStruct); %Initiate animation feature
drawnow;
Calculate segment area change as a function of time and pressure
nIncrements=numel(abaqusData.STEP(1).INCREMENT);
p=linspace(0,pressureValue,nIncrements+1);

A=NaN(size(p));
for qt=1:1:numel(timeVec) %Loop over time increments
    if qt>1
        V_def=[abaqusData.STEP(1).INCREMENT(qt-1).nodeOutput.data.COOR1...
               abaqusData.STEP(1).INCREMENT(qt-1).nodeOutput.data.COOR2...
               abaqusData.STEP(1).INCREMENT(qt-1).nodeOutput.data.COOR3];
    else
        V_def=VT;
    end
    A(qt)=patch_area(1:1:numel(indSegmentPlot),V_def(indSegmentPlot,:));
end
cFigure;
subplot(1,2,1);
hl(1)=plot(timeVec,p,'b.-','LineWidth',3,'MarkerSize',25);
hLegend=legend(hl,{'time vs pressure'},'FontSize',fontSize);
hLegend.Location='NorthWest';
set(gca,'FontSize',fontSize);
grid on;

subplot(1,2,2);
hl(1)=plot(p,A,'r.-','LineWidth',3,'MarkerSize',25);
hLegend=legend(hl,{'pressure vs area'},'FontSize',fontSize);
hLegend.Location='NorthWest';
set(gca,'FontSize',fontSize);
grid on;

drawnow;

GIBBON www.gibboncode.org
Kevin Mattheus Moerman, [email protected]
GIBBON footer text
License: https://github.com/gibbonCode/GIBBON/blob/master/LICENSE
GIBBON: The Geometry and Image-based Bioengineering add-On. A toolbox for image segmentation, image-based modeling, meshing, and finite element analysis.
Copyright (C) 2006-2022 Kevin Mattheus Moerman and the GIBBON contributors
This program is free software: you can redistribute it and/or modify it under the terms of the GNU General Public License as published by the Free Software Foundation, either version 3 of the License, or (at your option) any later version.
This program is distributed in the hope that it will be useful, but WITHOUT ANY WARRANTY; without even the implied warranty of MERCHANTABILITY or FITNESS FOR A PARTICULAR PURPOSE. See the GNU General Public License for more details.
You should have received a copy of the GNU General Public License along with this program. If not, see http://www.gnu.org/licenses/.