sweepLoft
Below is a demonstration of the features of the sweepLoft function
Contents
clear; close all; clc;
Syntax
[F,V,C]=sweepLoft(V1,V2,n1,n2,Vg,numSteps,numTwist,plotOn);
Description
The sweepLoft function creates a swept loft (as in CAD terminology for a shape formed by merging a set of sketches towards each other allong a given path or guide curve). The inputs to the function are the start and end sketchs (V1 and V2), the start and end normal directions (n1 and n2), and the guid curve (Vg). Optional additional inputs are: the number of steps for the loft feature (numSteps, same as number of points in guide curve if not provided), the number of twists (numTwists, default is zero) the shape undergoes around the guide curve, and finally plotOn (default is 0, i.e. off) which is a logic to turn on or off plotting within the function. The function outputs are patch data i.e. faces (F), the vertices (V) and face colors (C, denoting step in lofting process).
Examples
Plot settings
lineWidth=3;
A sweep loft allong a guide curve
Creating sketches
ns=50;
t=linspace(0,2*pi,ns);
t=t(1:end-1);
r=3+2.*sin(4*t);
[x,y] = pol2cart(t,r);
V1=[x(:) y(:) zeros(size(x(:)))];
V1=evenlySampleCurve(V1,size(V1,1),'pchip',1);

E=[0.6*pi 0 0];
R1=euler2DCM(E);
t=[1 2 -3];
V1=(V1*R1)+t;

t=linspace(0,2*pi,ns);
t=t(1:end-1);
r=4+3.*sin(2*t);
[x,y] = pol2cart(t,r);
V2=[x(:) y(:) zeros(size(x(:)))];
V2=evenlySampleCurve(V2,size(V2,1),'pchip',1);

E=[0 0.3*pi 0];
R2=euler2DCM(E);
t=[-16 25  15];
V2=((V2*R2)+t);
Create a guide curve
numStepsCurve=50; %Number of steps for the curve

p1=mean(V1,1); %First point
n1=R1(3,:); %First direction vector
p2=mean(V2,1); %End point
n2=R2(3,:); %End direction vector
csapsSmoothPar=1; %Cubic smoothening spline smoothening parameter
f=0.05; %Extent of tangential nature to boundary curves, surface will remain approximately orthogonal to input curves for f*distance between curves
[Vg]=sweepCurveSmooth(p1,p2,n1,n2,numStepsCurve,csapsSmoothPar,f);
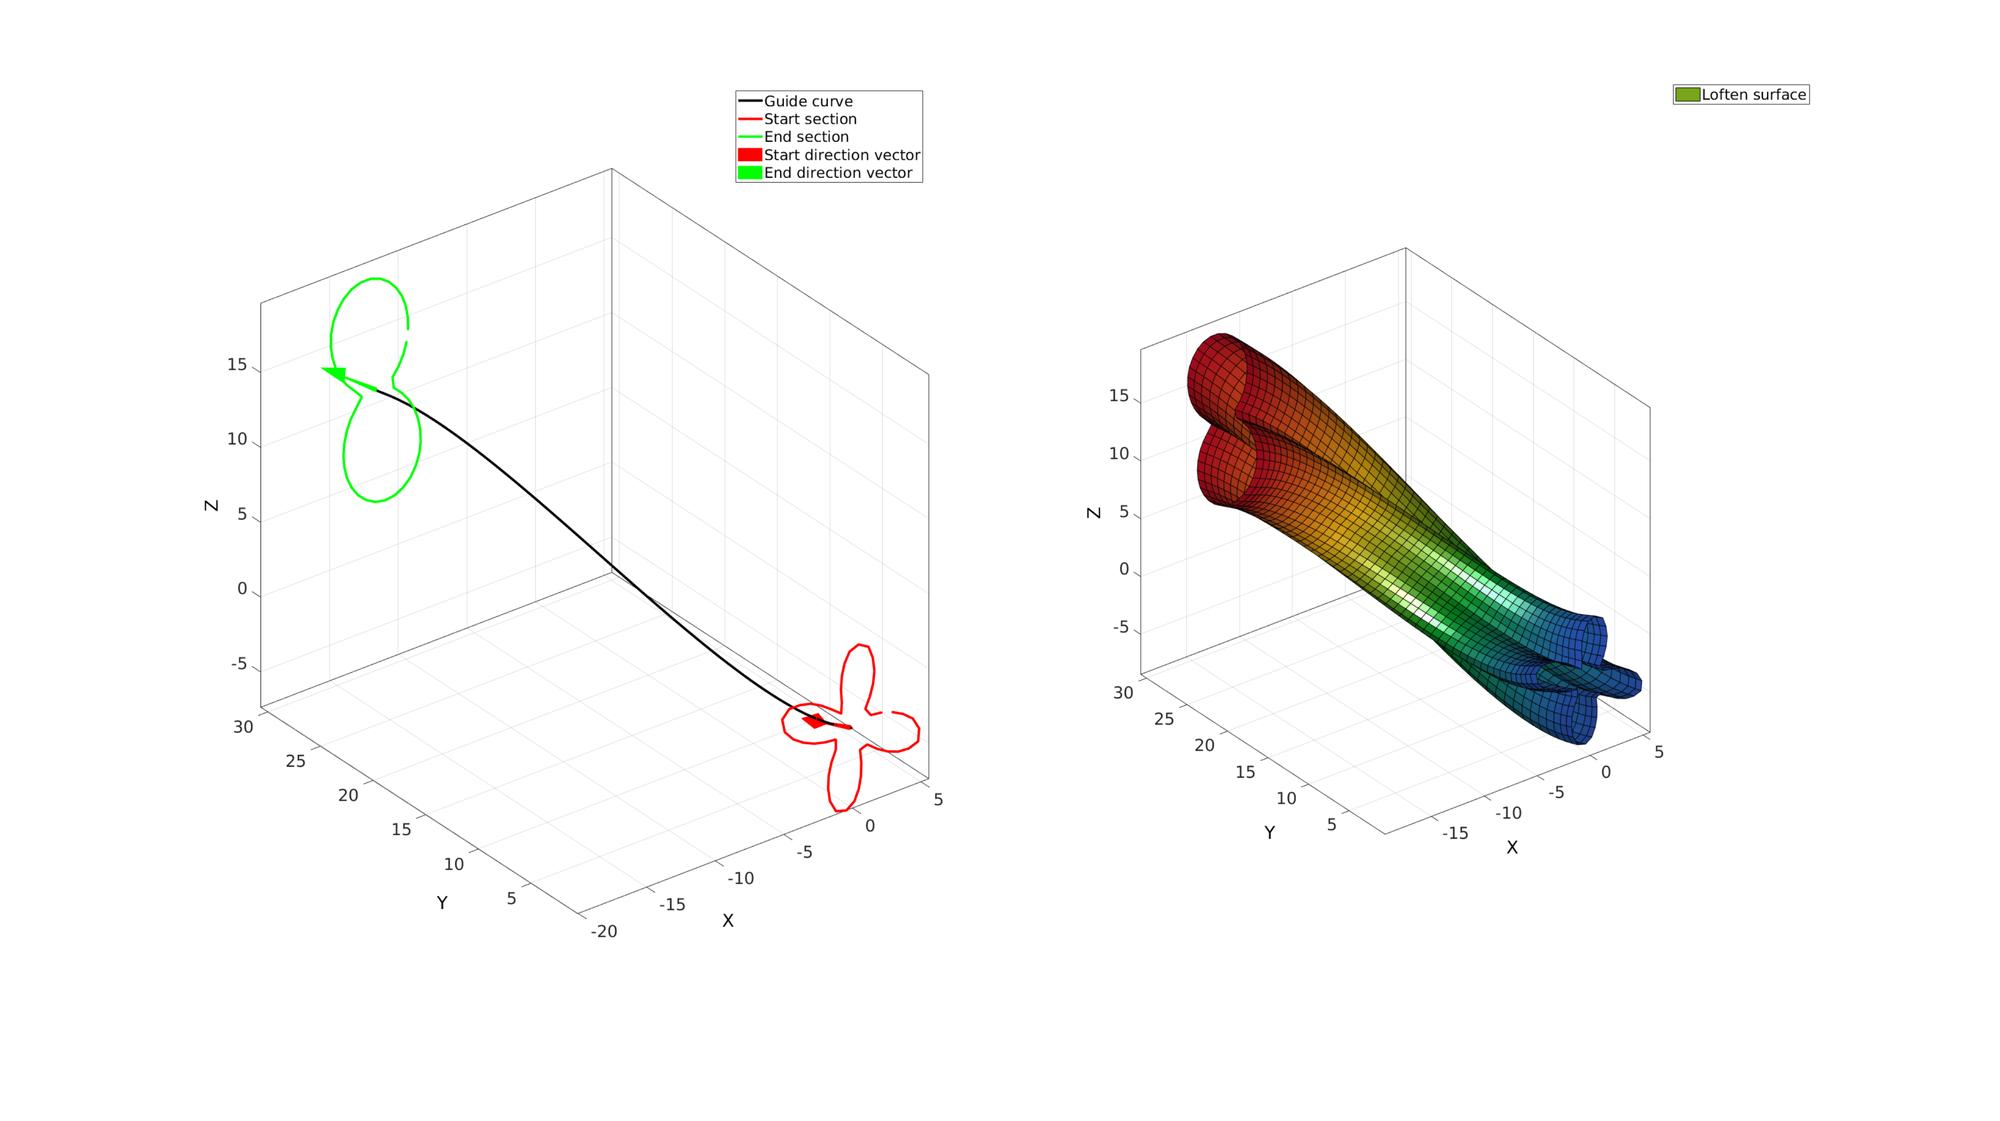
Create a basic loft feature using default settings (no twist, same number of steps as number of points as in guide curve, plotting off)
[F,V,C]=sweepLoft(V1,V2,n1,n2,Vg);
Visualize loft feature
cFigure;
subplot(1,2,1);
hold on;
h(1)=plotV(Vg,'k.-','LineWidth',lineWidth);
h(2)=plotV(V1,'r.-','LineWidth',lineWidth);
h(3)=plotV(V2,'g.-','LineWidth',lineWidth);
h(4)=quiverVec(p1,n1,5,'r');
h(5)=quiverVec(p2,n2,5,'g');
legend(h,{'Guide curve','Start section','End section','Start direction vector','End direction vector'});
axisGeom;

subplot(1,2,2); hold on;
h=gpatch(F,V,C,'k');
axisGeom;
legend(h,{'Loften surface'});
colormap(gjet(250));
camlight headlight
drawnow;

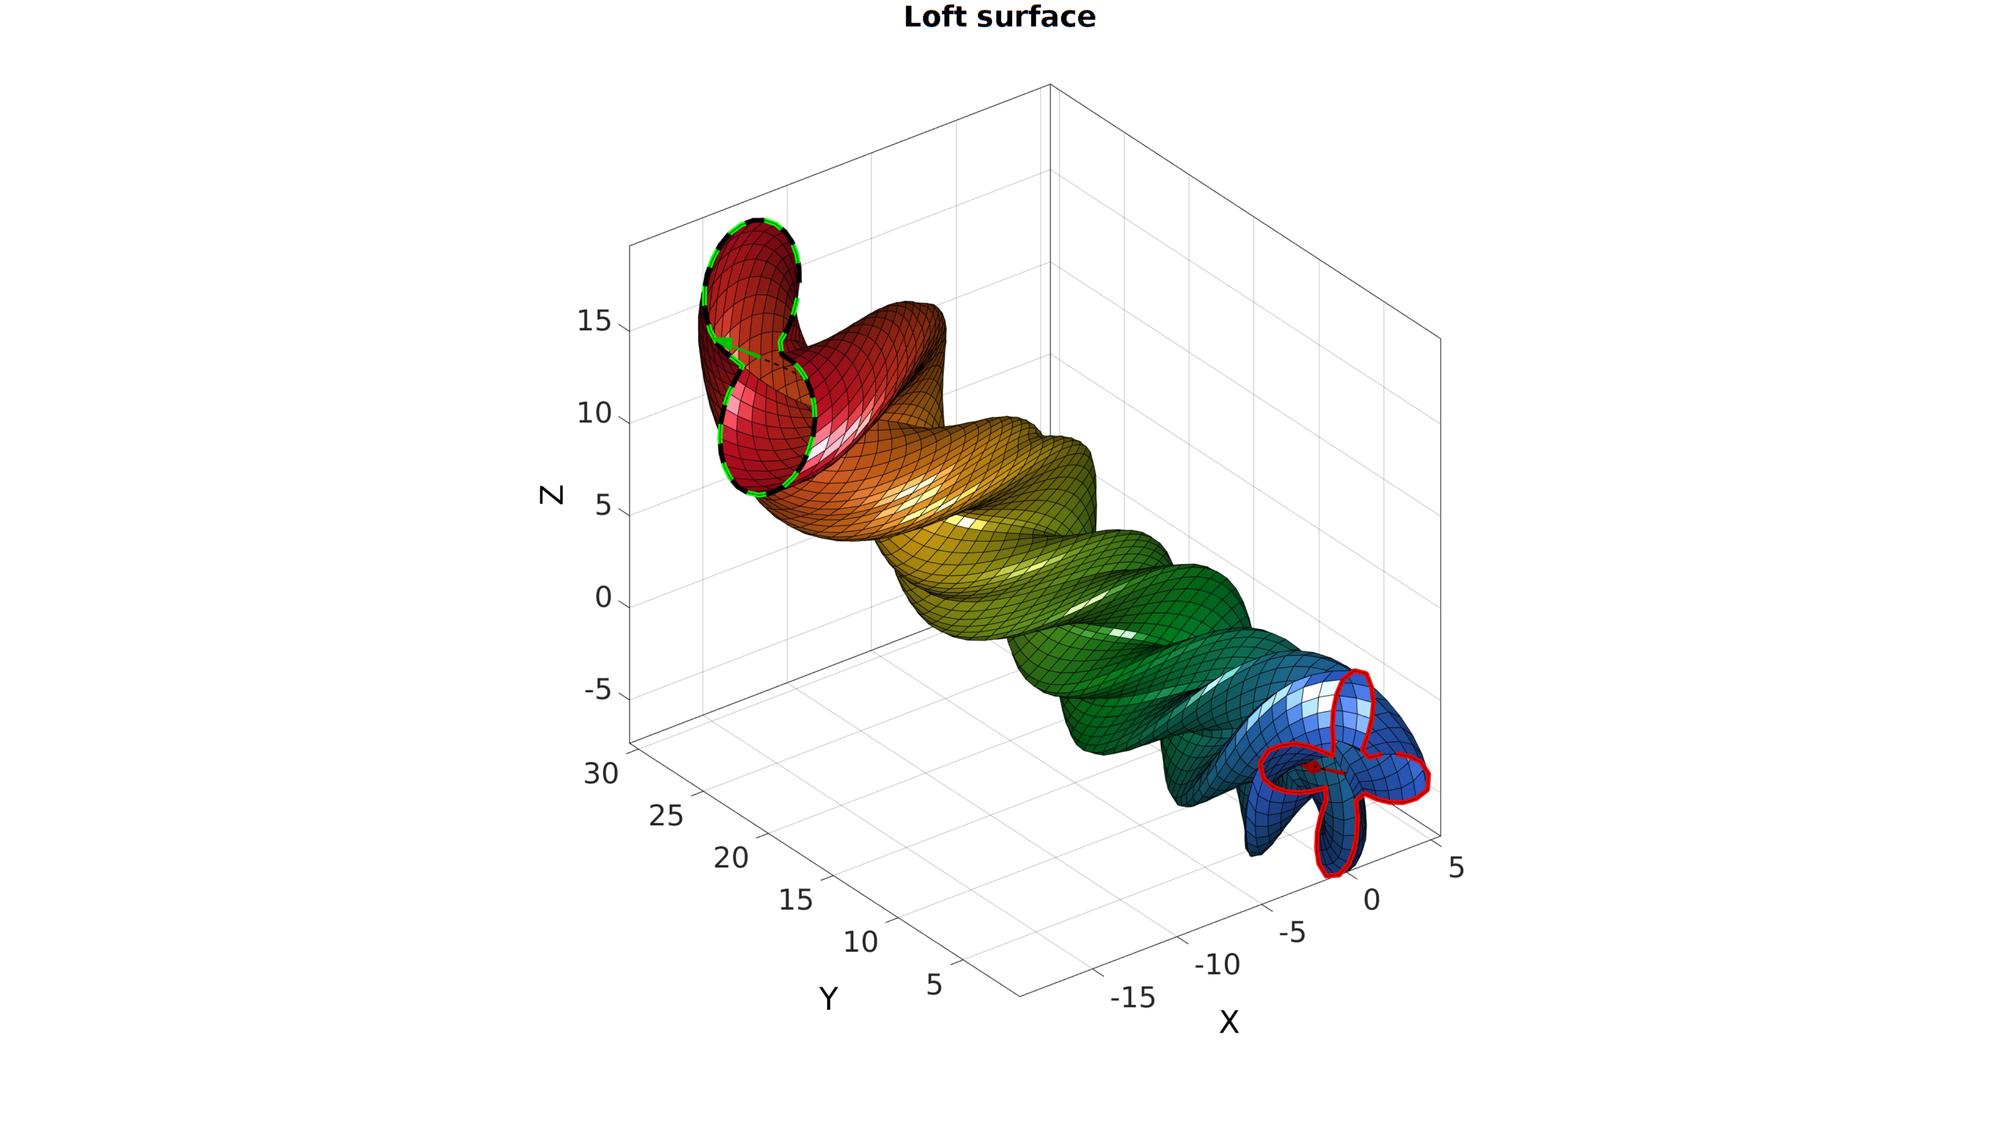
A sweep loft allong a guide curve with twist
Create loft feature with twist
numTwist=2; %Number of additional twists of loft feature around guide curve
numStepsSweep=75; %Number of steps for loft feature from sketch 1 to sketch 2
plotOn=1; %Turn on plotting to view lofting behaviour
[F,V,C]=sweepLoft(V1,V2,n1,n2,Vg,numStepsSweep,numTwist,plotOn);
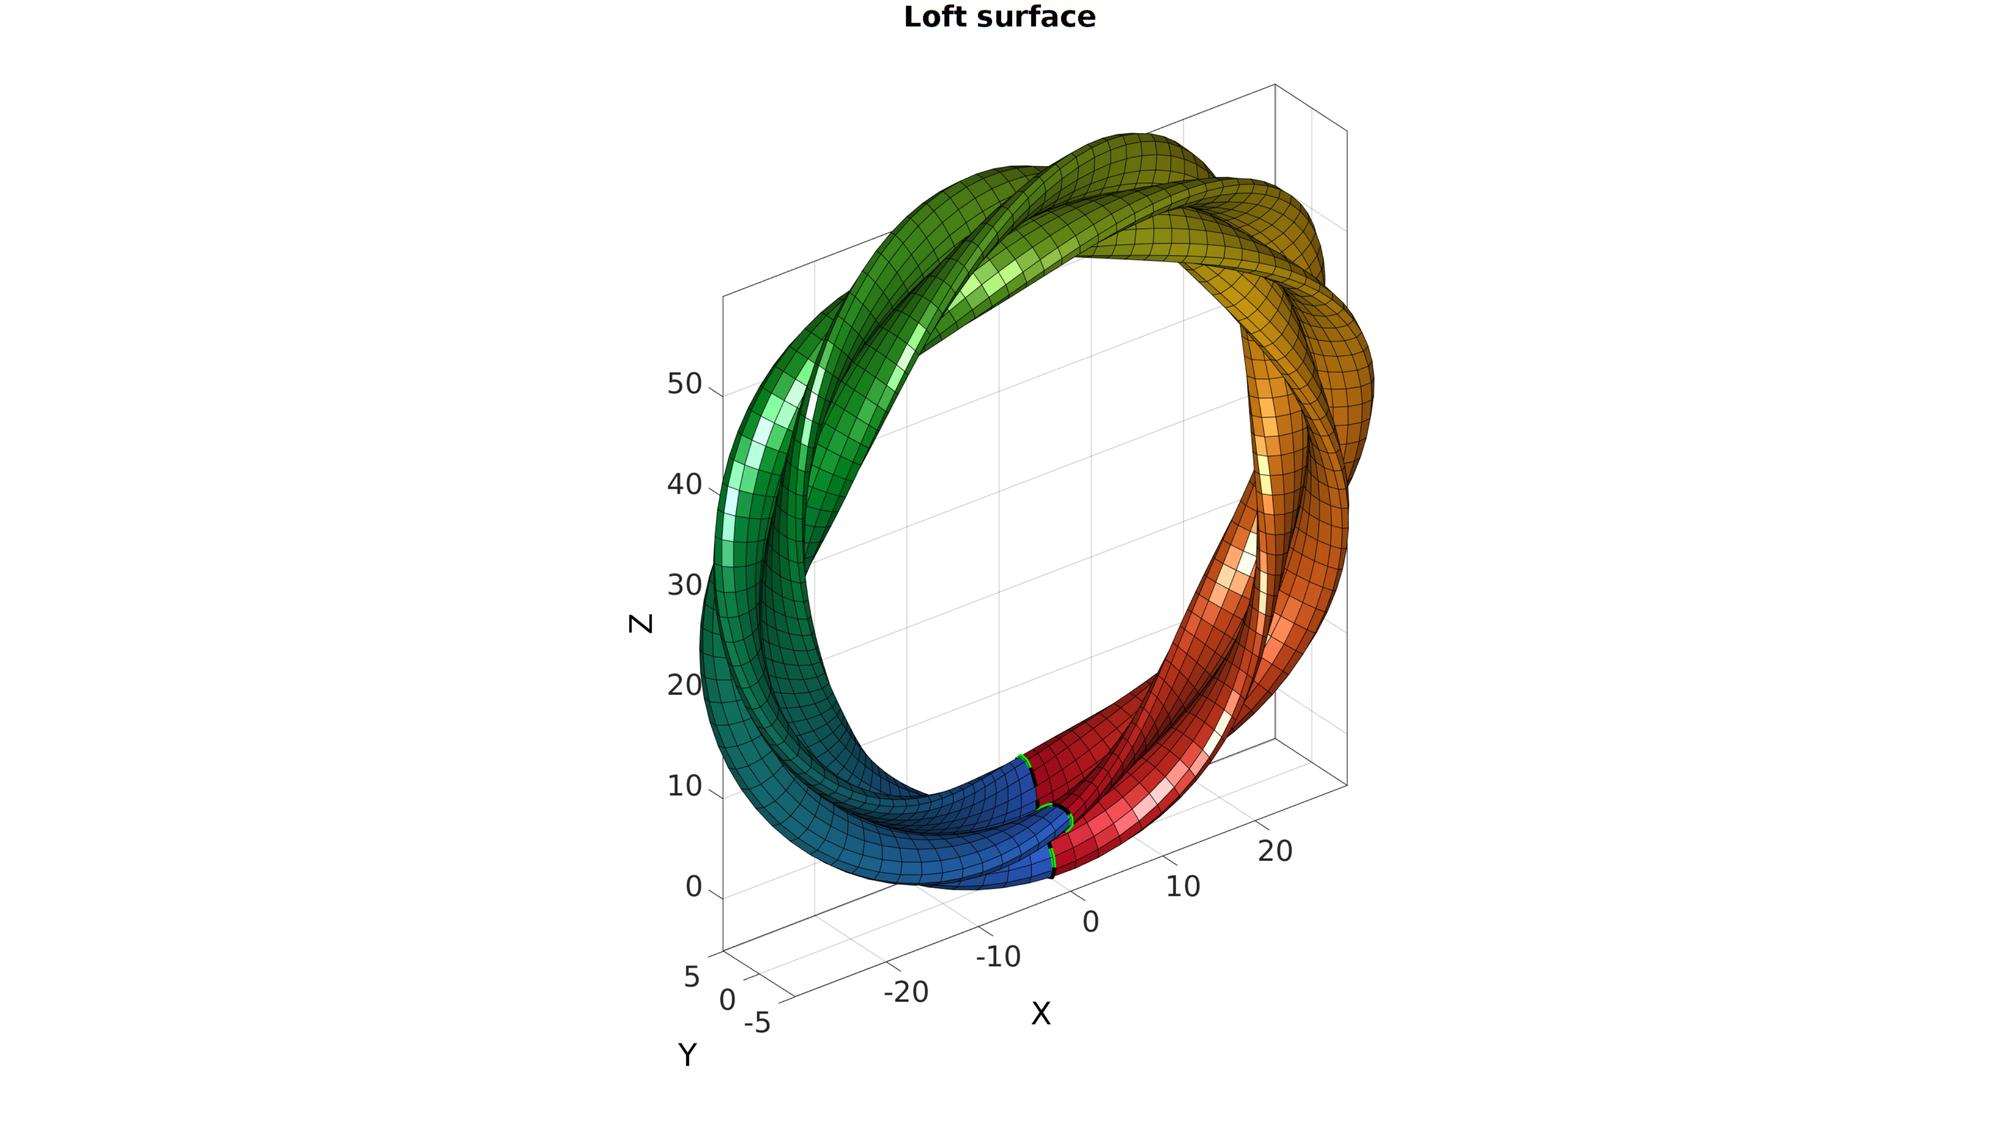
A ring shaped sweep loft
Creating sketches
ns=50;
t=linspace(0,2*pi,ns);
t=t(1:end-1);
r=3+2.5.*sin(4*t);
[x,y] = pol2cart(t,r);
V1=[x(:) y(:) zeros(size(x(:)))];

E=[0 0.5*pi 0];
R1=euler2DCM(E);
V1=(V1*R1);

V2=V1;
Creating a ring shaped guide curve
numStepsCurve=100;
p1=mean(V1,1);
n1=R1(3,:);
p2=mean(V2,1);
n2=n1;

t=linspace(-pi,pi,numStepsCurve);
r=30;
x=r*sin(t(:));
z=r*cos(t(:))+r;
Vg=[x zeros(size(x)) z];
numTwist=2; %Number of additional twists of loft feature around guide curve
numStepsSweep=numStepsCurve; %Number of steps for loft feature from sketch 1 to sketch 2
plotOn=1; %Turn on plotting to view lofting behaviour
[F,V,C]=sweepLoft(V1,V2,n1,n2,Vg,numStepsSweep,numTwist,plotOn);
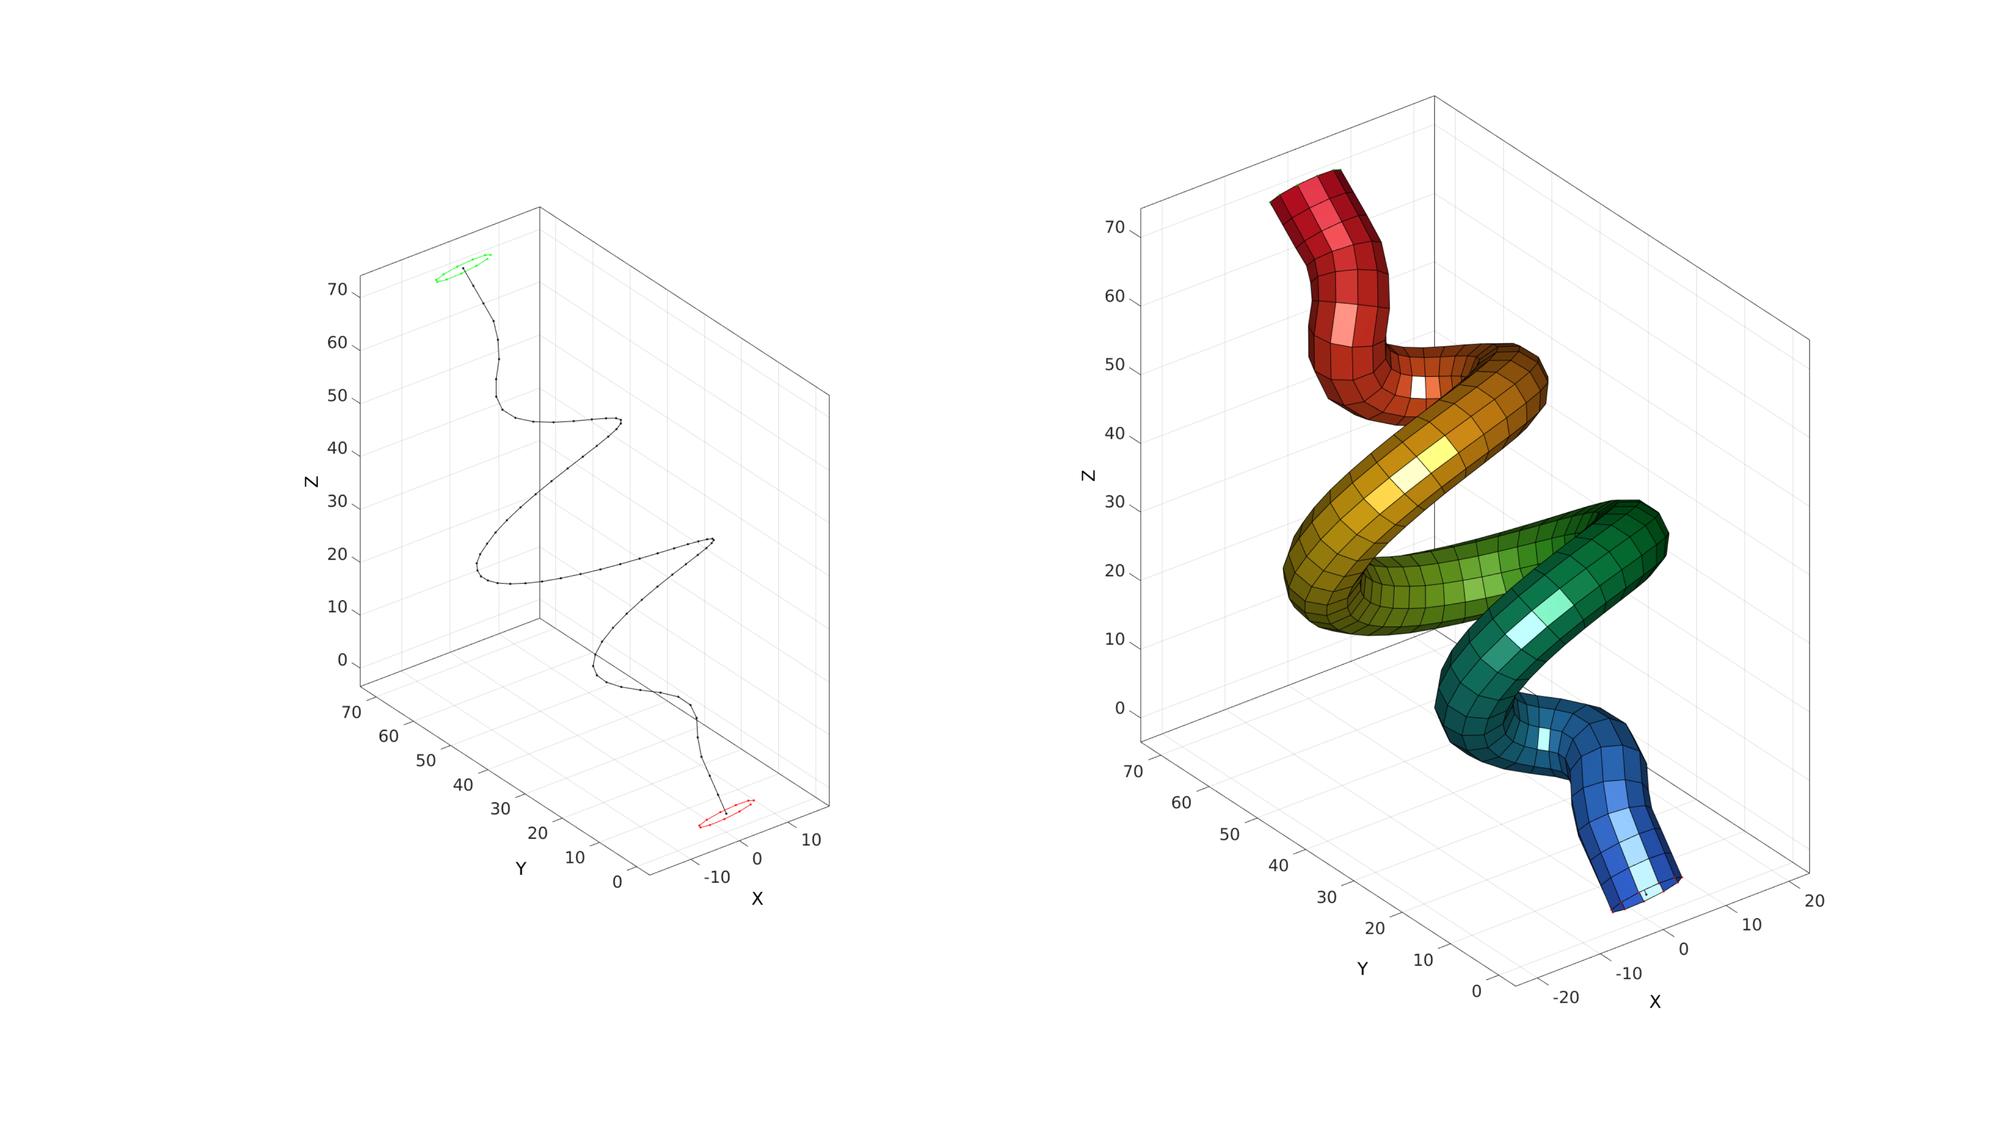
A sweep loft to create a coil
numStepsCurve=75;

optionStruct.numSteps=numStepsCurve; %Number of points used to define the curve.
optionStruct.numTwist=4; %Number of twists (for an unmodulated coil)
optionStruct.coilAmplitude=[]; %The coil amplitude (set empty to based on curve or edge length instead)
optionStruct.coilAmplitudeFactor=1/5; %The factor used to set local coil amplitude as a function of edge length
optionStruct.f=3; % The Gaussian bell curve will be truncated at n*the standard deviation on both sides.
optionStruct.funcMethod=2; %For loop based (1) or vectorised (2).

plotOn=1; %Turn on plotting to view lofting behaviour

% V1=[0 0 0; 1 0 0; 0.5 1 0];
% Creating sketches
ns=12;
t=linspace(0,2*pi,ns);
t=t(1:end-1);
r=5*ones(size(t));
[x,y] = pol2cart(t,r);
V1=[x(:) y(:) zeros(size(x(:)))];

V2=V1;
V2(:,3)=100;
V=[mean(V1,1); mean(V2,1)];
Vg=gaborCoil(V,[1 2],optionStruct);
[Vg] = evenlySampleCurve(Vg,size(Vg,1),'linear',0);

n1=[0 0 1];
n2=[0 0 1];

R=euler2DCM([0.25*pi 0 0]);  % R=euler2DCM(2*pi*randn(1,3));
V1=V1*R;
V2=V2*R;
n1=n1*R;
n2=n2*R;
Vg=Vg*R;

[F,V,C]=sweepLoft(V1,V2,n1,n2,Vg,optionStruct.numSteps,0,1);
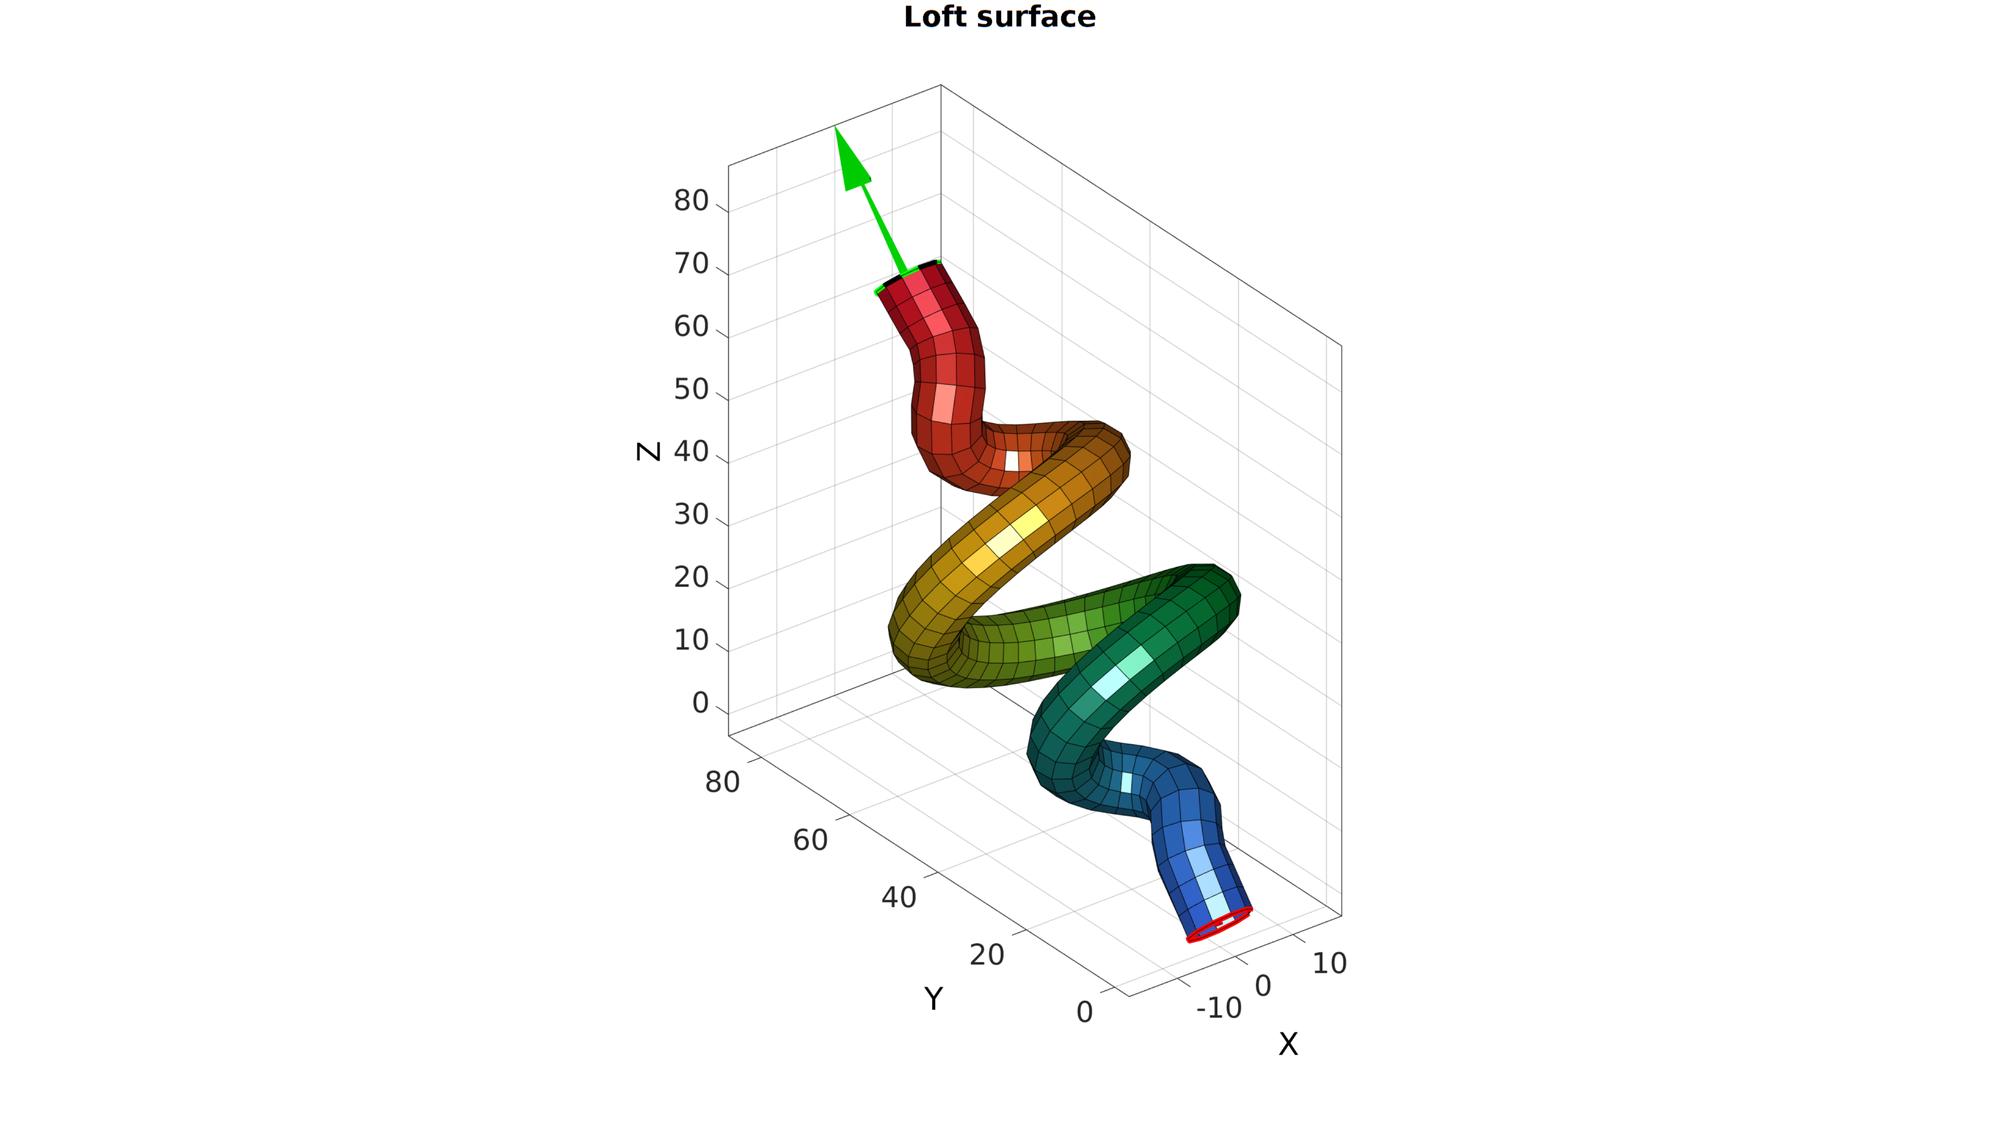
Visualize loft feature
cFigure;
subplot(1,2,1);
hold on;
plotV(Vg,'k.-');
plotV(V1,'r.-');
plotV(V2,'g.-');
axisGeom;

subplot(1,2,2); hold on;
plotV(Vg,'k.-');
plotV(V1,'r.-');
plotV(V2,'g.-');
gpatch(F,V,C,'k');
axisGeom;
colormap(gjet(250));
camlight headlight
drawnow;

GIBBON www.gibboncode.org
Kevin Mattheus Moerman, [email protected]
GIBBON footer text
License: https://github.com/gibbonCode/GIBBON/blob/master/LICENSE
GIBBON: The Geometry and Image-based Bioengineering add-On. A toolbox for image segmentation, image-based modeling, meshing, and finite element analysis.
Copyright (C) 2019 Kevin Mattheus Moerman
This program is free software: you can redistribute it and/or modify it under the terms of the GNU General Public License as published by the Free Software Foundation, either version 3 of the License, or (at your option) any later version.
This program is distributed in the hope that it will be useful, but WITHOUT ANY WARRANTY; without even the implied warranty of MERCHANTABILITY or FITNESS FOR A PARTICULAR PURPOSE. See the GNU General Public License for more details.
You should have received a copy of the GNU General Public License along with this program. If not, see http://www.gnu.org/licenses/.