subTriLoop
Below is a demonstration of the features of the subTriLoop function
Contents
- Syntax
- Description
- Examples
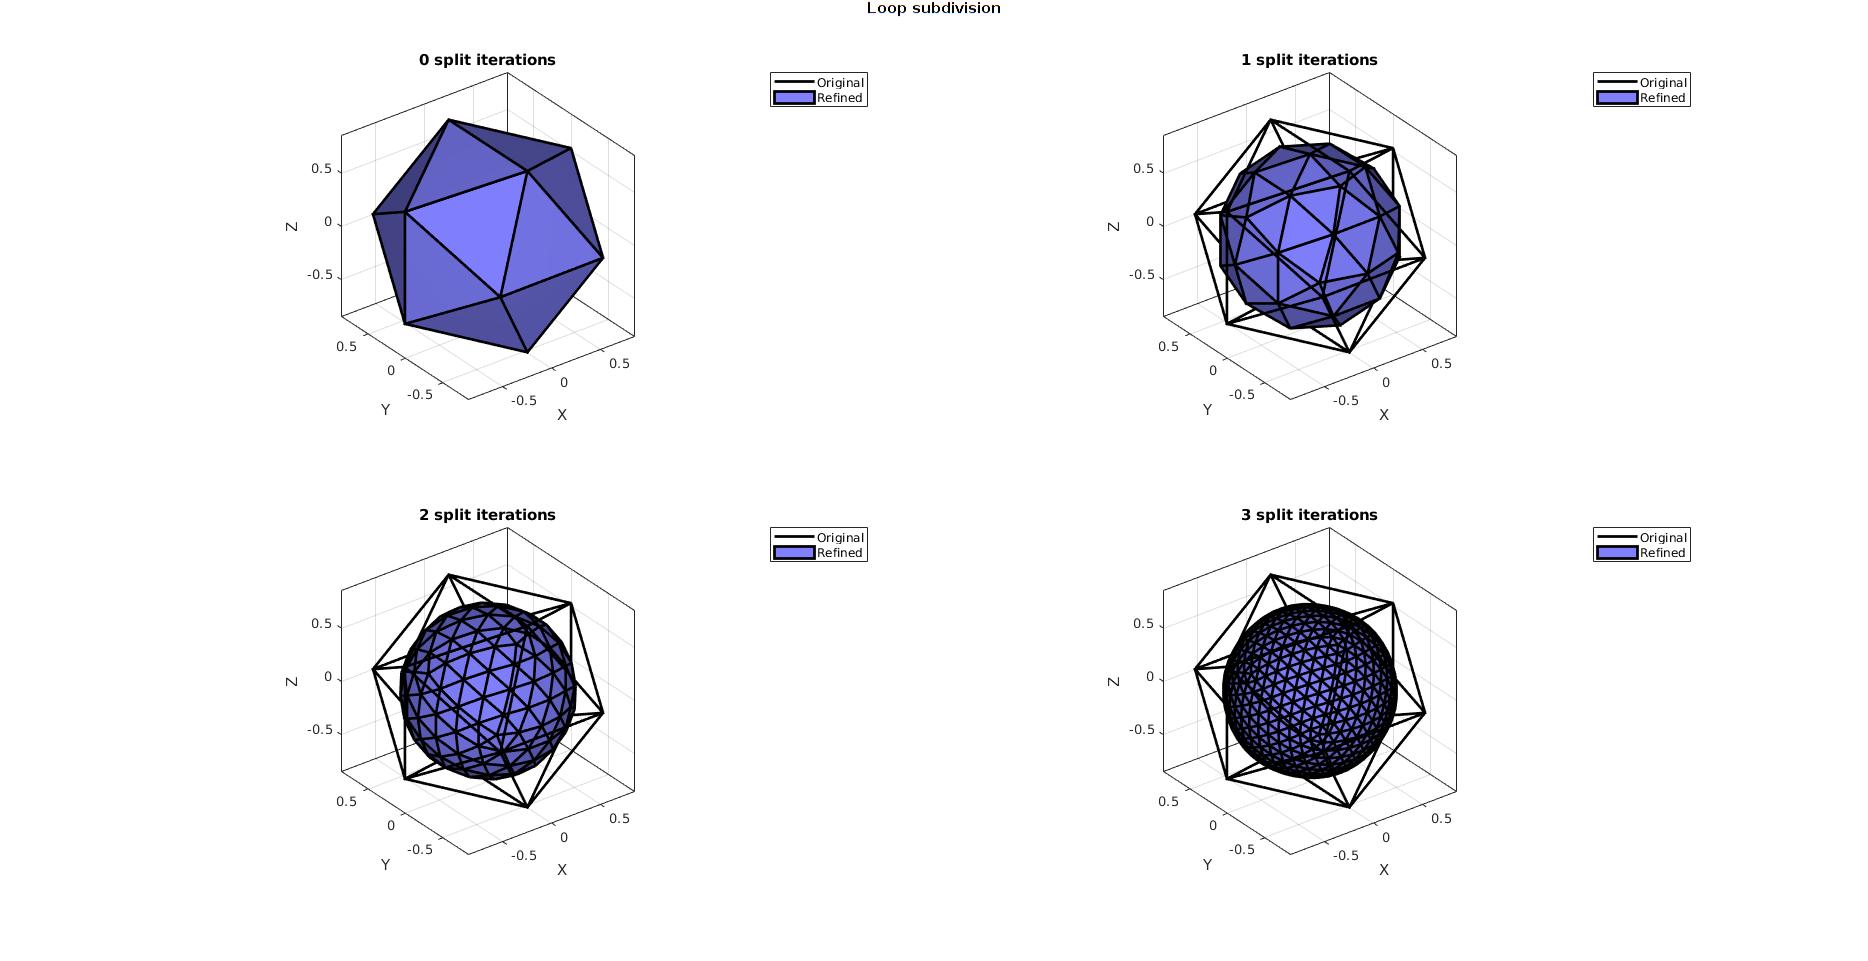
- Example: Refining an icosahedron to illustrate smoothing effect
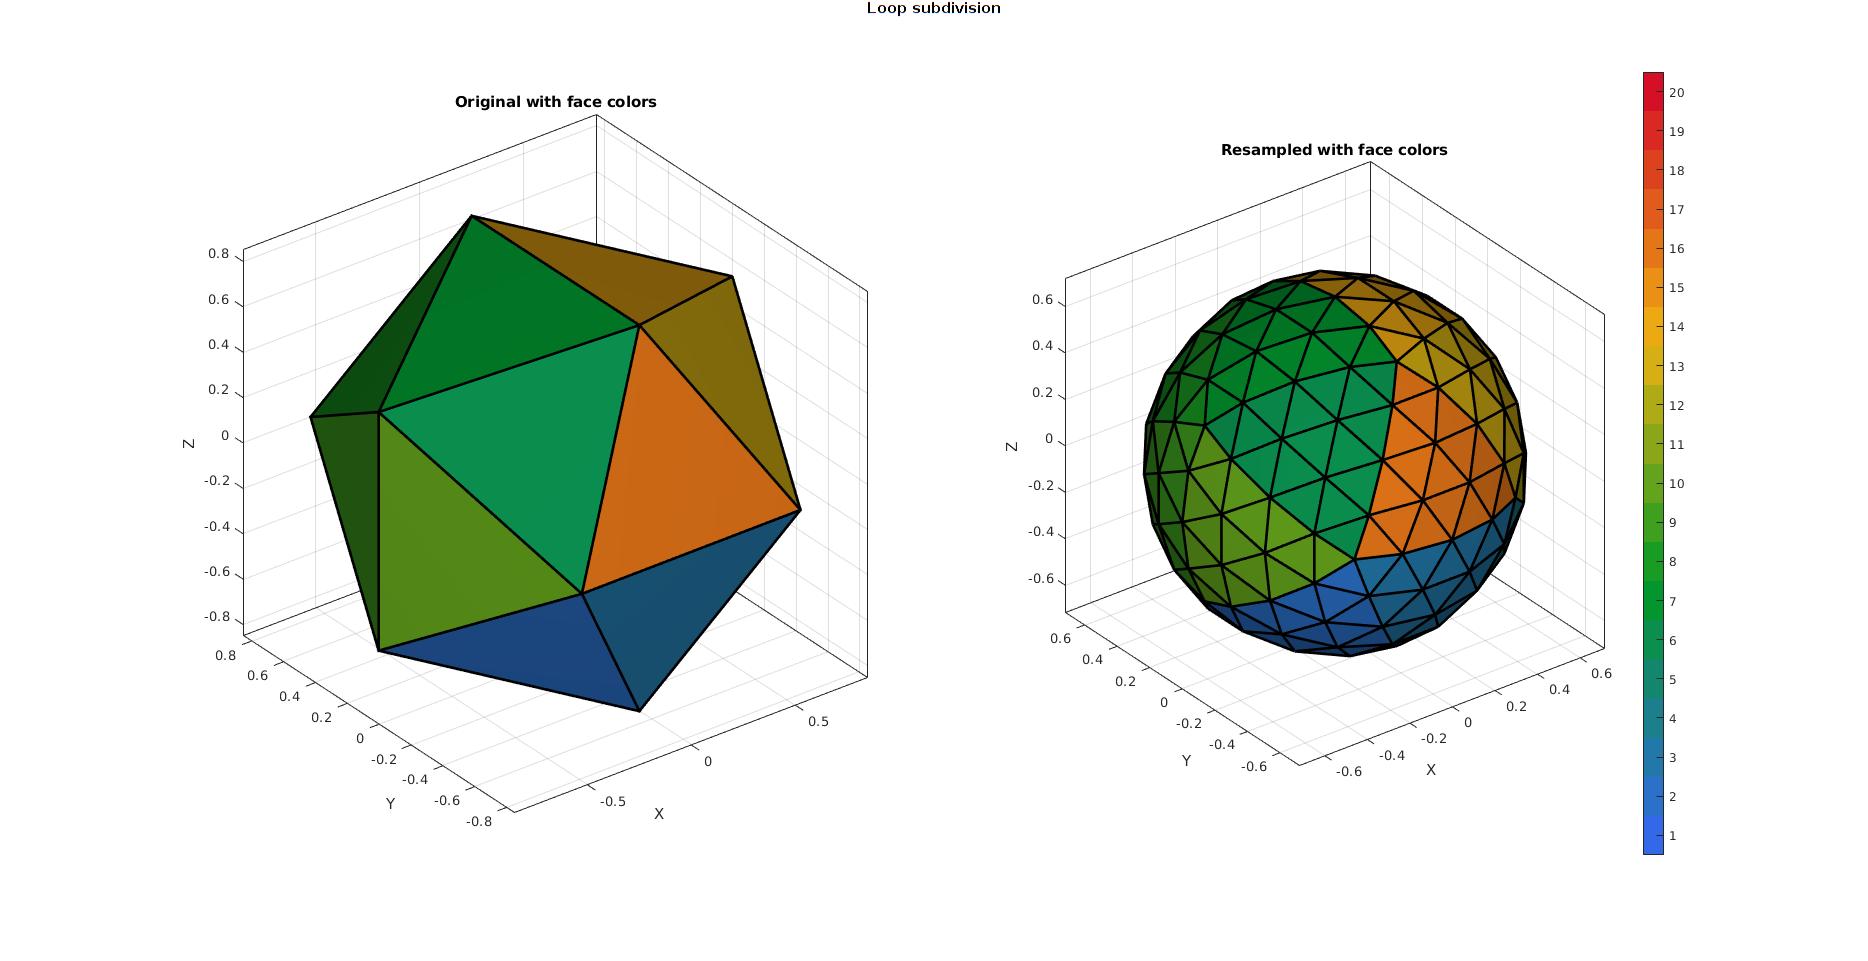
- Example: Refinement and maintenance of face color data
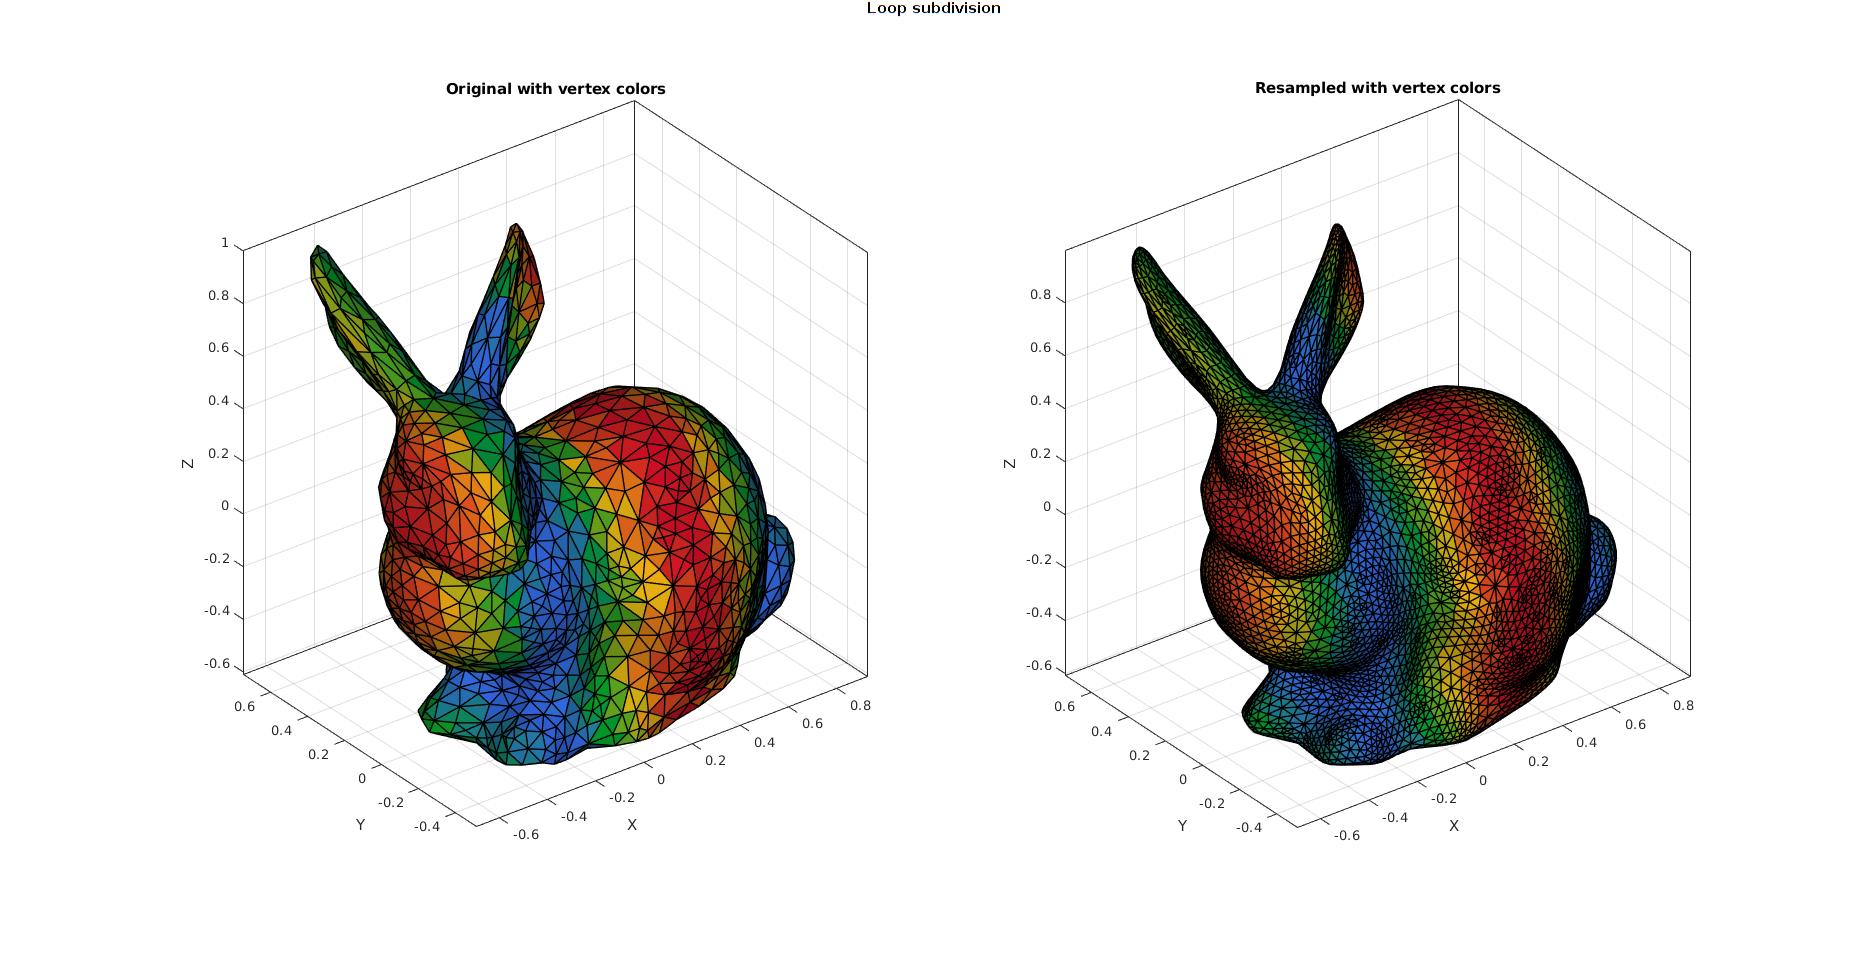
- Example: Refinement and resampling of vertex data
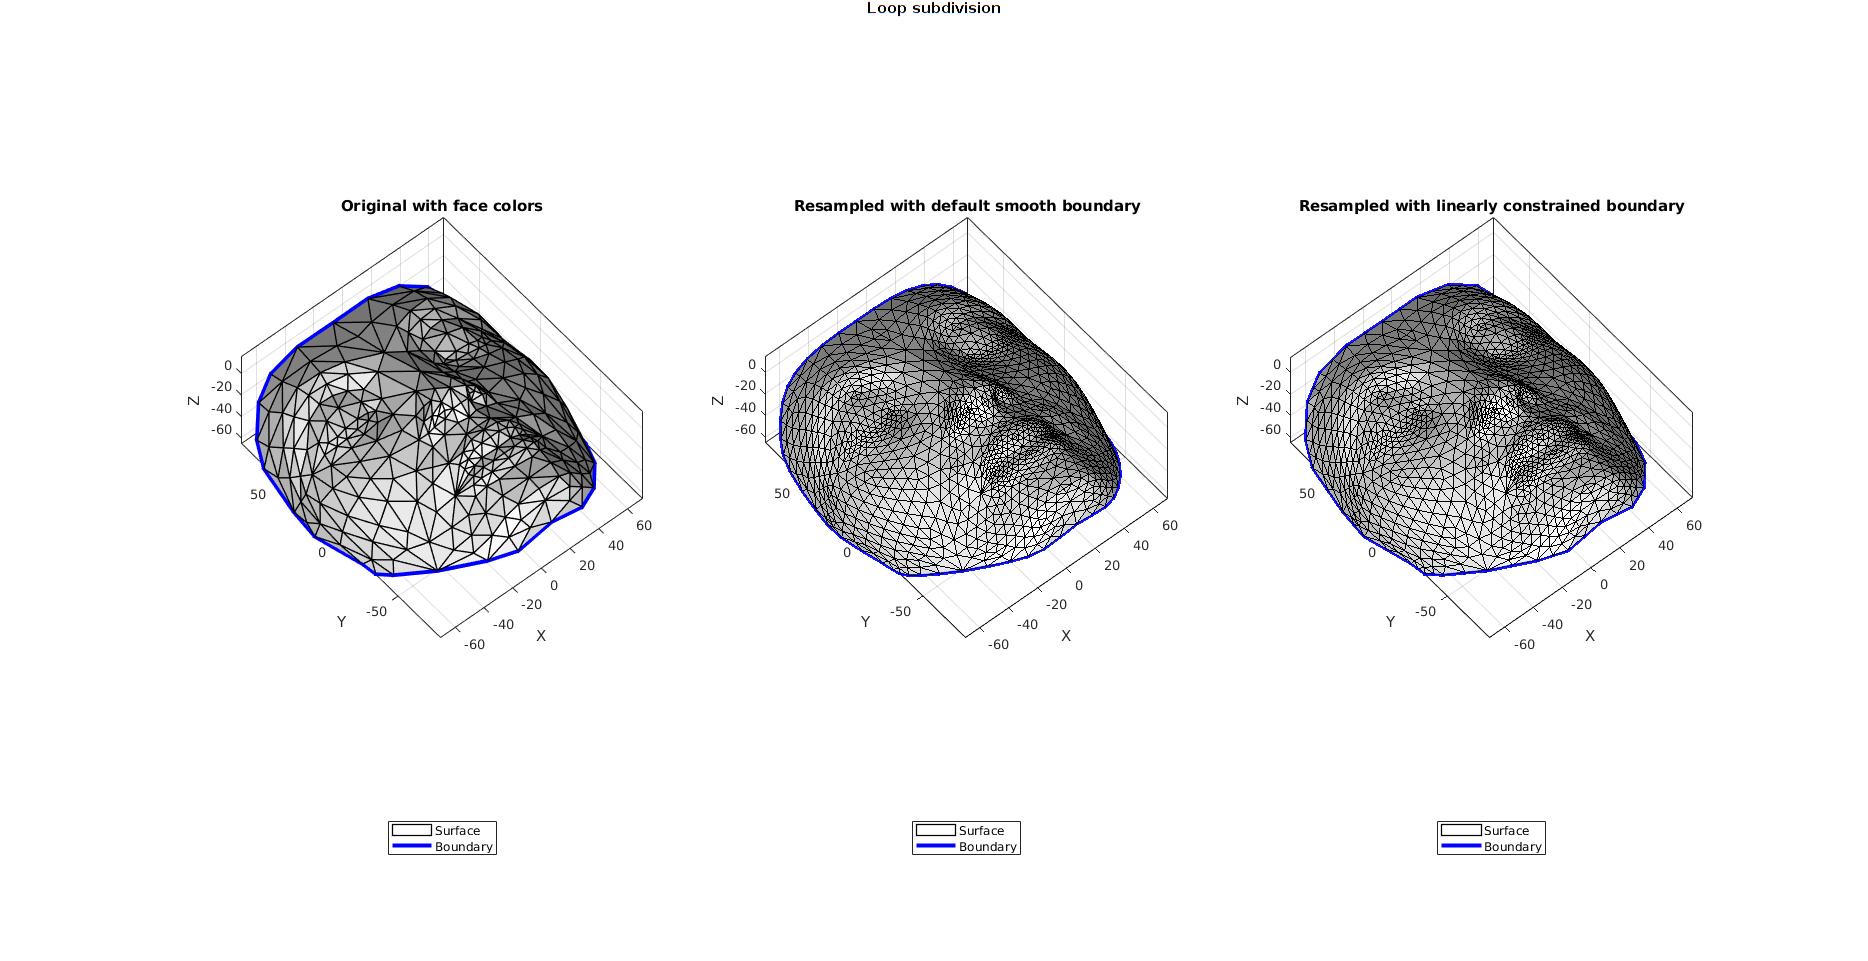
- Example: Forcing maintenance of boundary
- Example: Study vertex type
- Example: Constraining faces to subdivide "linearly" (shape maintaining)
- Example: Constraining faces but alter boundary of constrained
Syntax
[Fs,Vs,Cs]=subTriLoop(F,V,n,fixBoundaryOpt);
Description
The subTriLoop function enables refinement of triangulated data using the smooth refinement method by Loop et al. 1987 https://www.microsoft.com/en-us/research/wp-content/uploads/2016/02/thesis-10.pdf
The input faces and vertices are defined by F and V respectively. Each triangle is split into 4 sub-triangles.
Examples
clear; close all; clc;
Plot Settings
fontSize=10;
Example: Refining an icosahedron to illustrate smoothing effect
[V,F]=platonic_solid(4,1);

n=0:1:3; %Number of refinement steps

cFigure;
gtitle('Loop subdivision')
for q=1:1:numel(n)
    [Fs,Vs]=subTriLoop(F,V,n(q));
    subplot(2,2,q); hold on;
    title([num2str(n(q)),' split iterations'],'FontSize',fontSize);
    hp1=gpatch(F,V,'none','k',1,2);
    hp2=gpatch(Fs,Vs,'bw','k',1,2);
    axisGeom(gca,fontSize); camlight headlight;
    legend([hp1 hp2],{'Original','Refined'})
end
drawnow;
Example: Refinement and maintenance of face color data
[V,F]=platonic_solid(4,1);
CF=(1:1:size(F,1))'; %Face color data

n=2; %Number of refinement steps

[Fs,Vs,Cs]=subTriLoop(F,V,n);
CFs=CF(Cs);

cFigure;
gtitle('Loop subdivision')
subplot(1,2,1); hold on;
title('Original with face colors','FontSize',fontSize);
gpatch(F,V,CF,'k',1,2);
axisGeom(gca,fontSize); camlight headlight;
drawnow;

subplot(1,2,2); hold on;
title('Resampled with face colors','FontSize',fontSize);
gpatch(Fs,Vs,CFs,'k',1,2);
colormap gjet; icolorbar;
axisGeom(gca,fontSize); camlight headlight;
drawnow;
Example: Refinement and resampling of vertex data
[F,V]=stanford_bunny; V=V-mean(V,1); V=V./max(V(:));
CV=sin(2*pi*V(:,1));

n=1; %Number of refinement steps

VI=[V CV]; %Append vertex data as column(s)
[Fs,VIs]=subTriLoop(F,VI,n);
CVs=VIs(:,4);
Vs=VIs(:,1:3);

cFigure;
gtitle('Loop subdivision')
subplot(1,2,1); hold on;
title('Original with vertex colors','FontSize',fontSize);
gpatch(F,V,CV,'k',1,1);
axisGeom(gca,fontSize); camlight headlight;
colormap gjet;
drawnow;

subplot(1,2,2); hold on;
title('Resampled with vertex colors','FontSize',fontSize);
gpatch(Fs,Vs,CVs,'k',1,1);
axisGeom(gca,fontSize); camlight headlight;
colormap gjet;
drawnow;
Example: Forcing maintenance of boundary
[F,V]=graphicsModels(10);

n=1; %Number of refinement steps

[Fs,Vs]=subTriLoop(F,V,n);

fixBoundaryOpt=1; %Option to constrain boundary to be linearly sampled
[Fs2,Vs2]=subTriLoop(F,V,n,fixBoundaryOpt);
cFigure;
gtitle('Loop subdivision')
subplot(1,3,1); hold on;
title('Original with face colors','FontSize',fontSize);
hp1=gpatch(F,V,'w','k',1,1);
hp2=gpatch(patchBoundary(F,V),V,'none','b',1,3);
axisGeom(gca,fontSize); camlight headlight;
legend([hp1 hp2],{'Surface','Boundary'},'Location','SouthOutside');
view([-40 55]); zoom(1.1);

subplot(1,3,2); hold on;
title('Resampled with default smooth boundary','FontSize',fontSize);
hp1=gpatch(Fs,Vs,'w','k',1,1);
hp2=gpatch(patchBoundary(Fs,Vs),Vs,'none','b',1,3); hp2.EdgeAlpha=0.9;
axisGeom(gca,fontSize); camlight headlight;
legend([hp1 hp2],{'Surface','Boundary'},'Location','SouthOutside');
view([-40 55]); zoom(1.1);

subplot(1,3,3); hold on;
title('Resampled with linearly constrained boundary','FontSize',fontSize);
hp1=gpatch(Fs2,Vs2,'w','k',1,1);
hp2=gpatch(patchBoundary(Fs2,Vs2),Vs2,'none','b',1,3); hp2.EdgeAlpha=0.9;
axisGeom(gca,fontSize); camlight headlight;
legend([hp1 hp2],{'Surface','Boundary'},'Location','SouthOutside');
view([-40 55]); zoom(1.1);

drawnow;
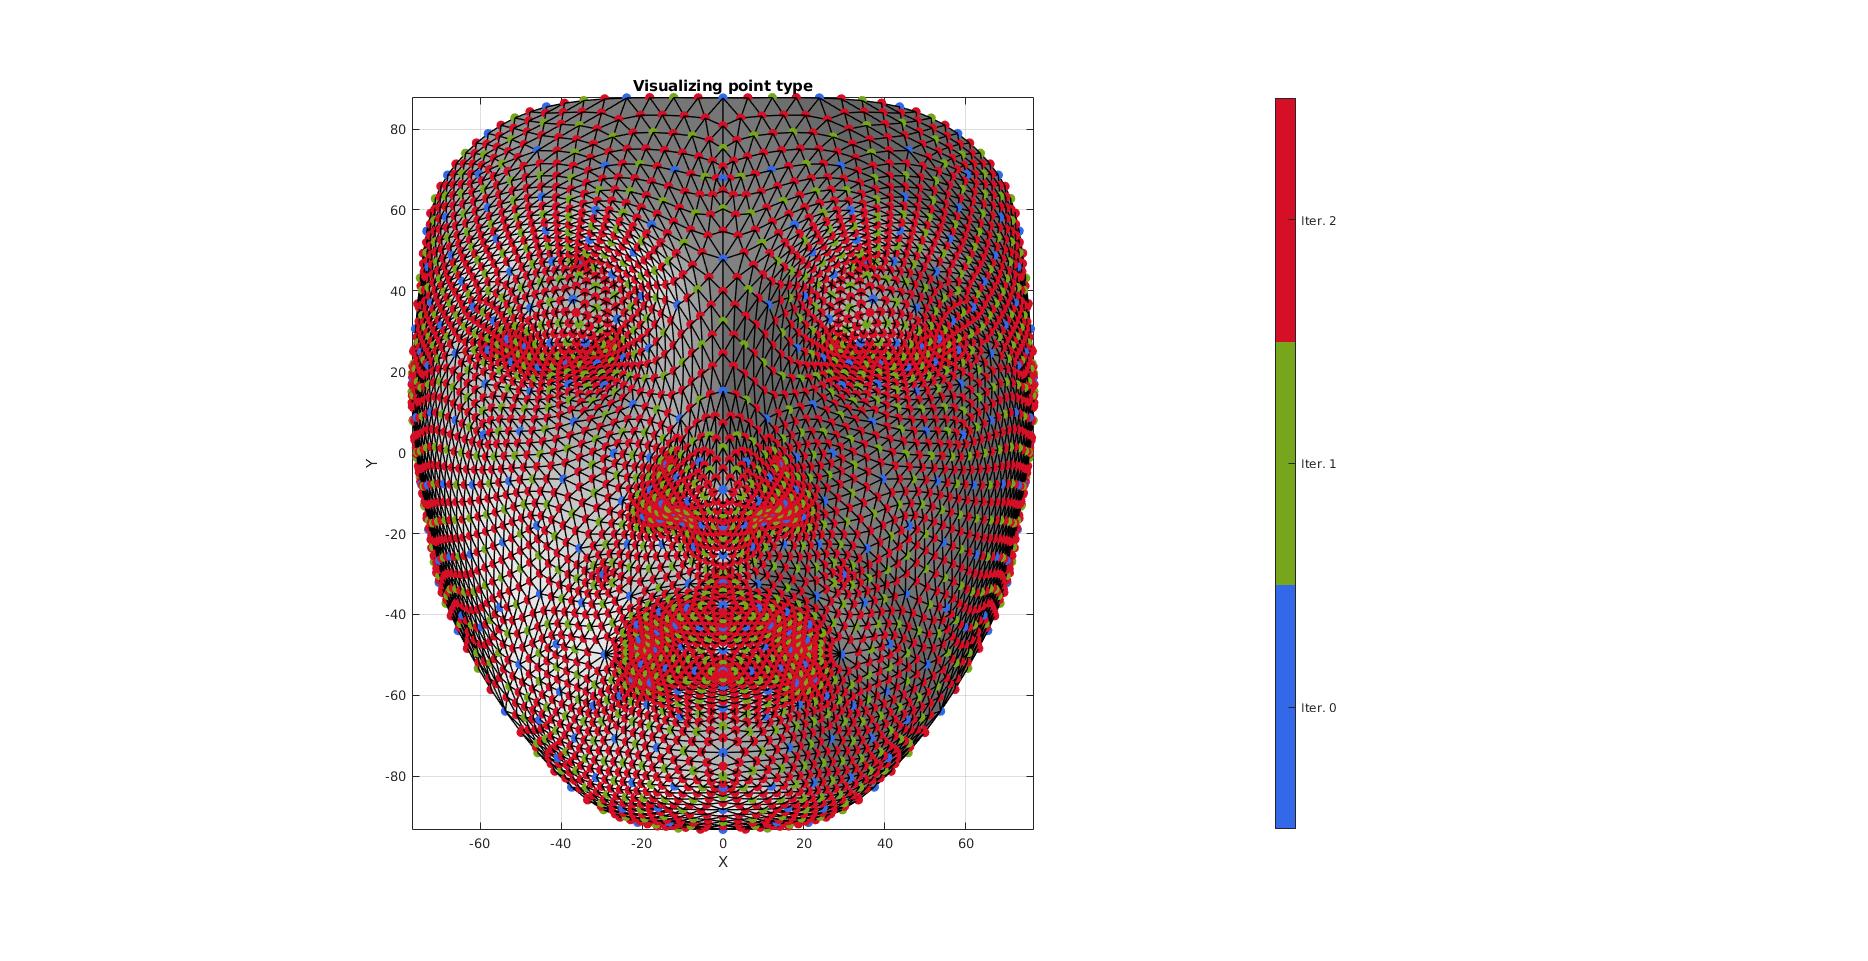
Example: Study vertex type
An optional 4th output can provide "vertex labels", these define the vertex origins, i.e. whether they stem from the initial coordinates (iteration 0), or from iteration n.
[F,V]=graphicsModels(10);

n=2; %Number of refinement steps

[Fs,Vs,~,CV]=subTriLoop(F,V,n);
cFigure; hold on;
title('Visualizing point type','FontSize',fontSize);
gpatch(Fs,Vs,'w','k',1,1);
scatterV(Vs,50,CV,'filled')
axisGeom(gca,fontSize); camlight headlight;
view(2);
colormap gjet; [~,hc]=icolorbar;
hc.TickLabels={'Iter. 0';'Iter. 1';'Iter. 2'};
drawnow;
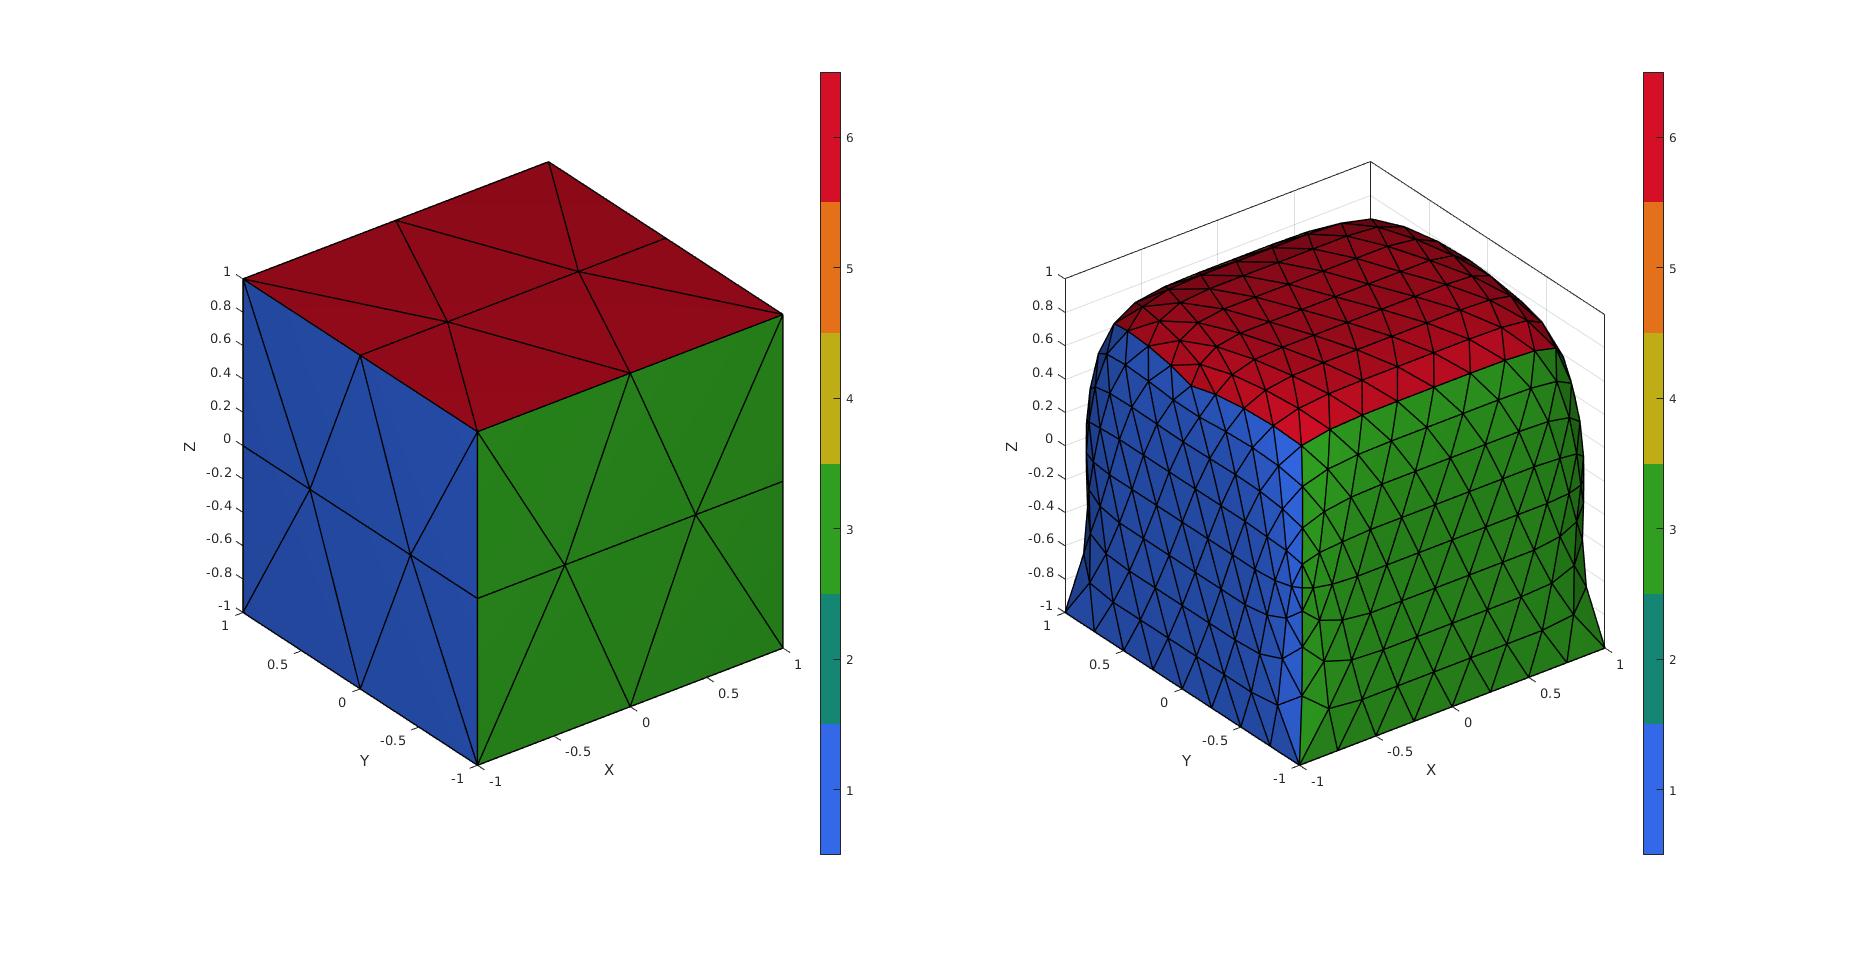
Example: Constraining faces to subdivide "linearly" (shape maintaining)
% Using |triBox| to build the patch model
[F,V,faceBoundaryMarker]=triBox([2 2 2],1);
n=2; %Number of refinement steps
logicConstrain=(faceBoundaryMarker==5); %Logic for faces to subdivide linearly
[Fs,Vs,Cs,CV]=subTriLoop(F,V,n,0,logicConstrain);

faceBoundaryMarker_sub=faceBoundaryMarker(Cs); %Get boundary markers for refined mesh
cFigure;
subplot(1,2,1); hold on;
gpatch(F,V,faceBoundaryMarker,'k',1,1);
axisGeom(gca,fontSize); camlight headlight;
colormap(gca,gjet(6)); icolorbar;

subplot(1,2,2); hold on;
gpatch(Fs,Vs,faceBoundaryMarker_sub,'k',1,1);
axisGeom(gca,fontSize); camlight headlight;
colormap(gca,gjet(6)); icolorbar;
drawnow;
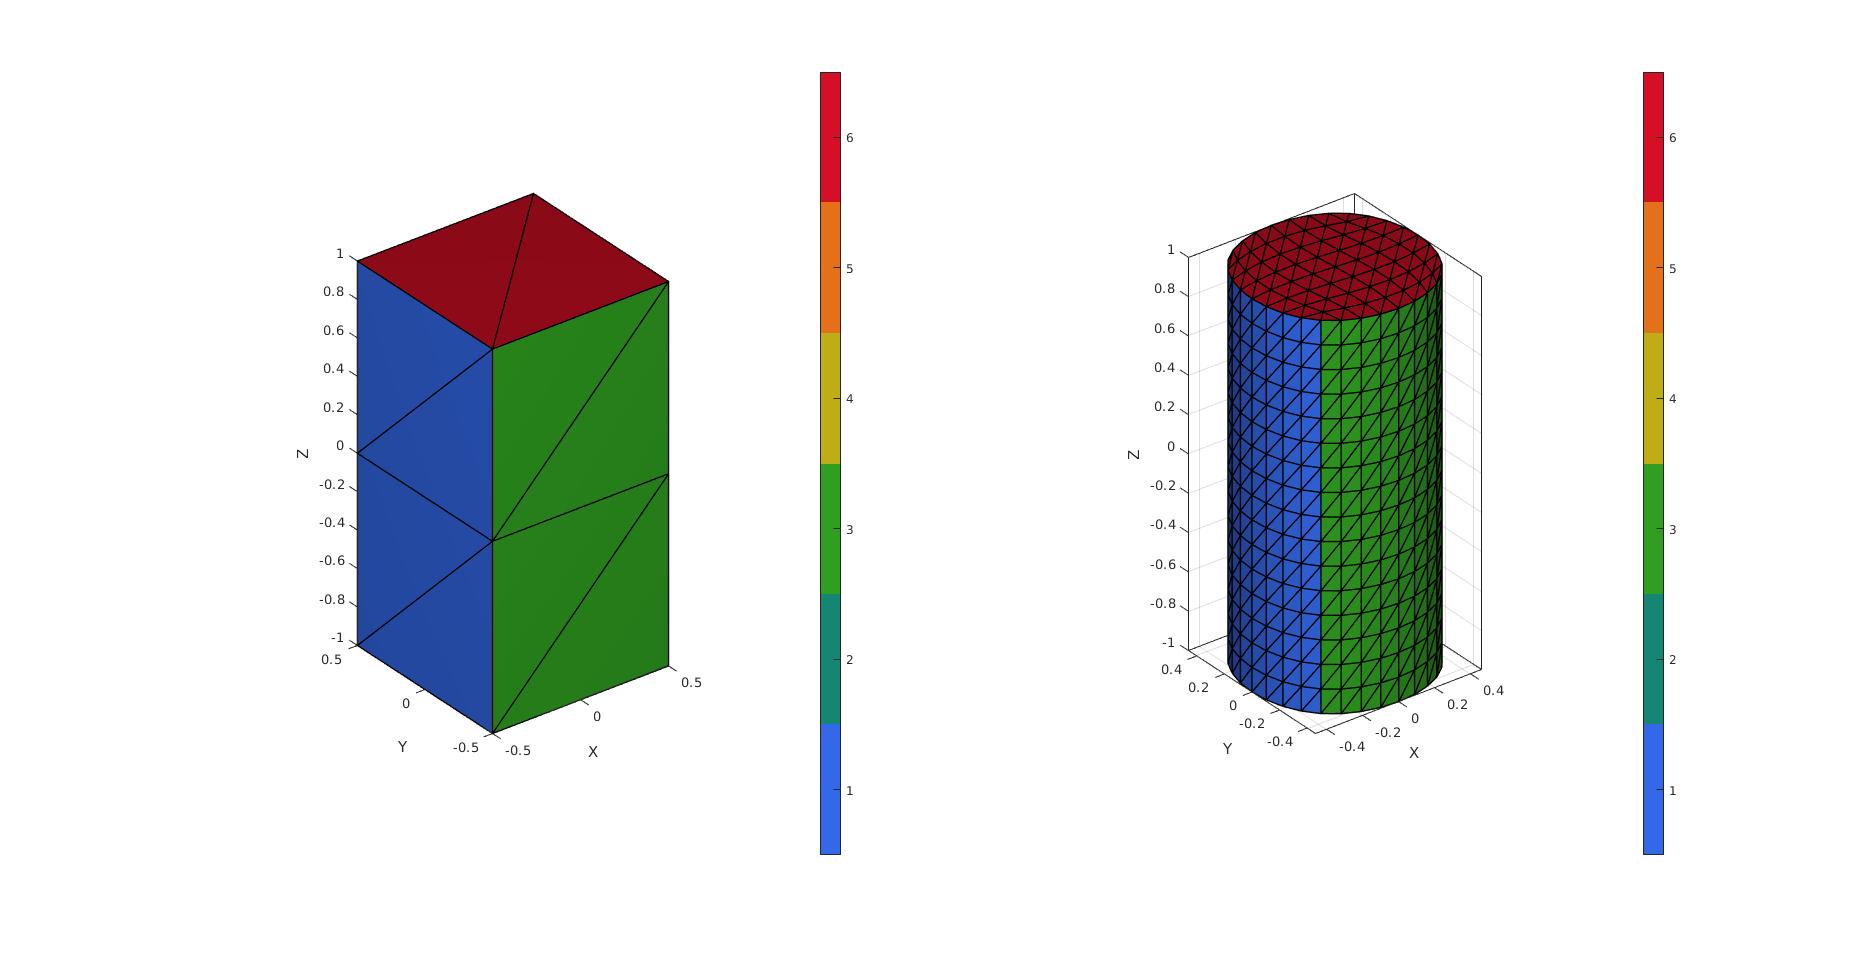
Example: Constraining faces but alter boundary of constrained
% Using |triBox| to build the patch model
[Fq,V,faceBoundaryMarker_q]=quadBox([1 1 2],[1 1 2]);
F=[Fq(:,[1 2 3]);Fq(:,[3 4 1]);];
faceBoundaryMarker=repmat(faceBoundaryMarker_q,2,1);
n=3; %Number of refinement steps
logicConstrain=ismember(faceBoundaryMarker,[5,6]); %Logic for faces to subdivide linearly
indConstrain=find(logicConstrain);
indNotConstrain=find(~logicConstrain);

[Fs1,Vs1,Cs1]=subTriLoop(F(logicConstrain,:),V,n);
faceBoundaryMarker_sub1=faceBoundaryMarker(indConstrain(Cs1)); %Get boundary markers for refined mesh

[Fs2,Vs2,Cs2]=subTriLoop(F(~logicConstrain,:),V,n);
faceBoundaryMarker_sub2=faceBoundaryMarker(indNotConstrain(Cs2)); %Get boundary markers for refined mesh

[Fs,Vs,faceBoundaryMarker_sub]=joinElementSets({Fs1,Fs2},{Vs1,Vs2},{faceBoundaryMarker_sub1,faceBoundaryMarker_sub2});

[Fs,Vs]=patchCleanUnused(Fs,Vs);
[Fs,Vs]=mergeVertices(Fs,Vs);
cFigure;
subplot(1,2,1); hold on;
gpatch(F,V,faceBoundaryMarker,'k',1,1);
axisGeom(gca,fontSize); camlight headlight;
colormap(gca,gjet(6)); icolorbar;

subplot(1,2,2); hold on;
gpatch(Fs,Vs,faceBoundaryMarker_sub,'k',1,1);
axisGeom(gca,fontSize); camlight headlight;
colormap(gca,gjet(6)); icolorbar;
drawnow;

GIBBON www.gibboncode.org
Kevin Mattheus Moerman, [email protected]
GIBBON footer text
License: https://github.com/gibbonCode/GIBBON/blob/master/LICENSE
GIBBON: The Geometry and Image-based Bioengineering add-On. A toolbox for image segmentation, image-based modeling, meshing, and finite element analysis.
Copyright (C) 2006-2021 Kevin Mattheus Moerman and the GIBBON contributors
This program is free software: you can redistribute it and/or modify it under the terms of the GNU General Public License as published by the Free Software Foundation, either version 3 of the License, or (at your option) any later version.
This program is distributed in the hope that it will be useful, but WITHOUT ANY WARRANTY; without even the implied warranty of MERCHANTABILITY or FITNESS FOR A PARTICULAR PURPOSE. See the GNU General Public License for more details.
You should have received a copy of the GNU General Public License along with this program. If not, see http://www.gnu.org/licenses/.