sigmoid_pchip
Below is a demonstration of the features of the sigmoid_pchip function
Contents
clear; close all; clc;
Syntax
[s]=sigmoid_pchip(optStruct)
Description
UNDOCUMENTED
Examples
Plot settings
plotColors=gjet(250);
fontSize=15;
Creating sigmoid curves with prescribed start and end slopes
n=10;
plotColor=gjet(n);
nPlot=2000;
t=linspace(0,1,nPlot)';

optStruct.nLin=10;
optStruct.rMode=1;
optStruct.n=nPlot;
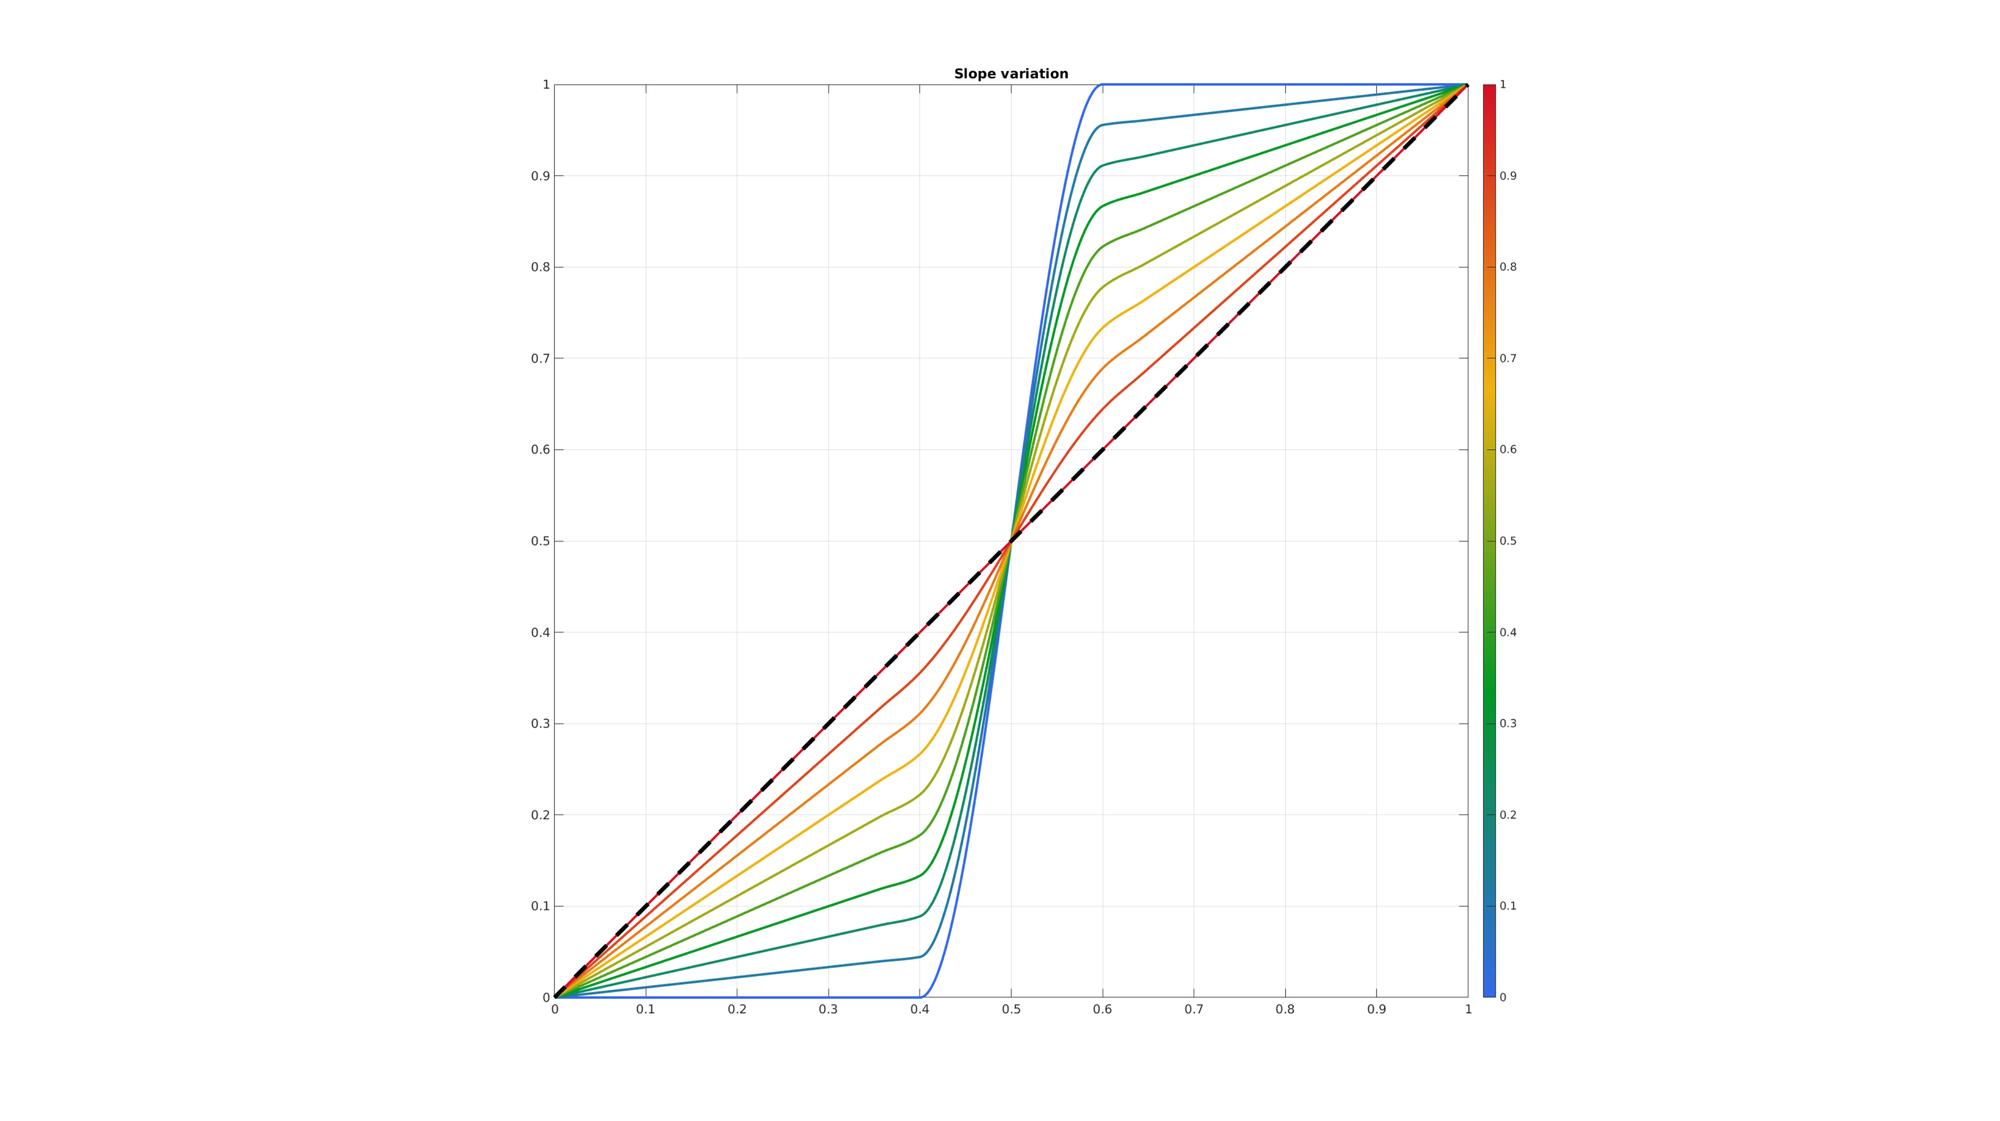
Varying slope with matched slopes
cFigure;
hold on;
title('Slope variation','fontSize',fontSize);

c1_q=linspace(0,1,n); %Slope variations
for q=1:1:n

    optStruct.c1=c1_q(q);
    optStruct.c2=optStruct.c1;
    optStruct.r1=0.4;
    optStruct.r2=optStruct.r1;

    [Vi]=sigmoid_pchip(optStruct);

    hp=plotV(Vi,'r-','LineWidth',3); set(hp,'Color',plotColor(q,:));
end

plotV([t(:) t(:)],'k--','LineWidth',5);
colormap(gjet(250)); colorbar; caxis([min(c1_q) max(c1_q)]);
axis tight; axis equal; hold on; box on; grid on; view(2);
set(gca,'FontSize',15);
drawnow;
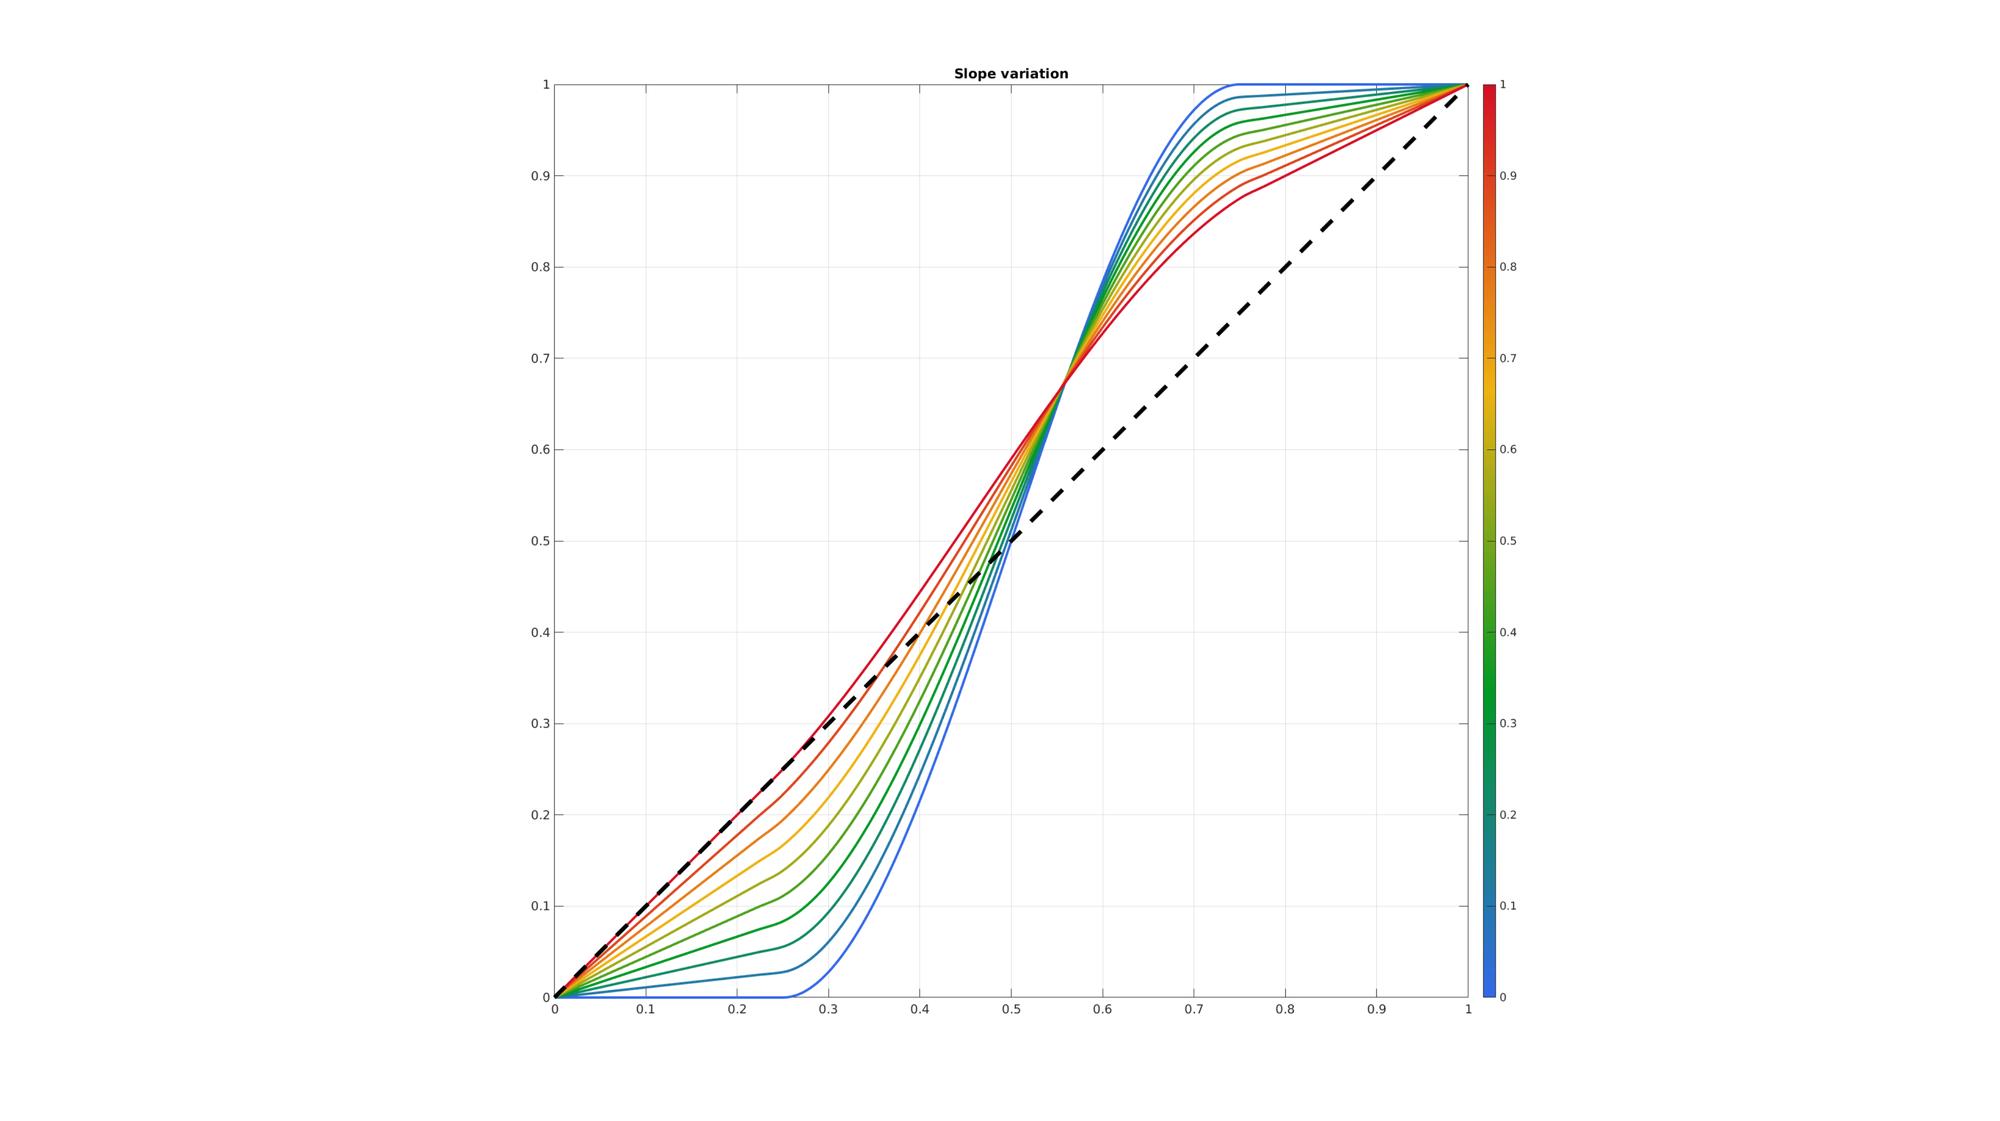
Varying slope with different start/end slopes
cFigure;
hold on;
title('Slope variation','fontSize',fontSize);

c1_q=linspace(0,1,n); %Slope variations
for q=1:1:n

    optStruct.c1=c1_q(q);
    optStruct.c2=optStruct.c1/2;
    optStruct.r1=0.25;
    optStruct.r2=optStruct.r1;

    [Vi]=sigmoid_pchip(optStruct);

    hp=plotV(Vi,'r-','LineWidth',3); set(hp,'Color',plotColor(q,:));
end

plotV([t(:) t(:)],'k--','LineWidth',5);
colormap(gjet(250)); colorbar; caxis([min(c1_q) max(c1_q)]);
axis tight; axis equal; hold on; box on; grid on; view(2);
set(gca,'FontSize',15);
drawnow;
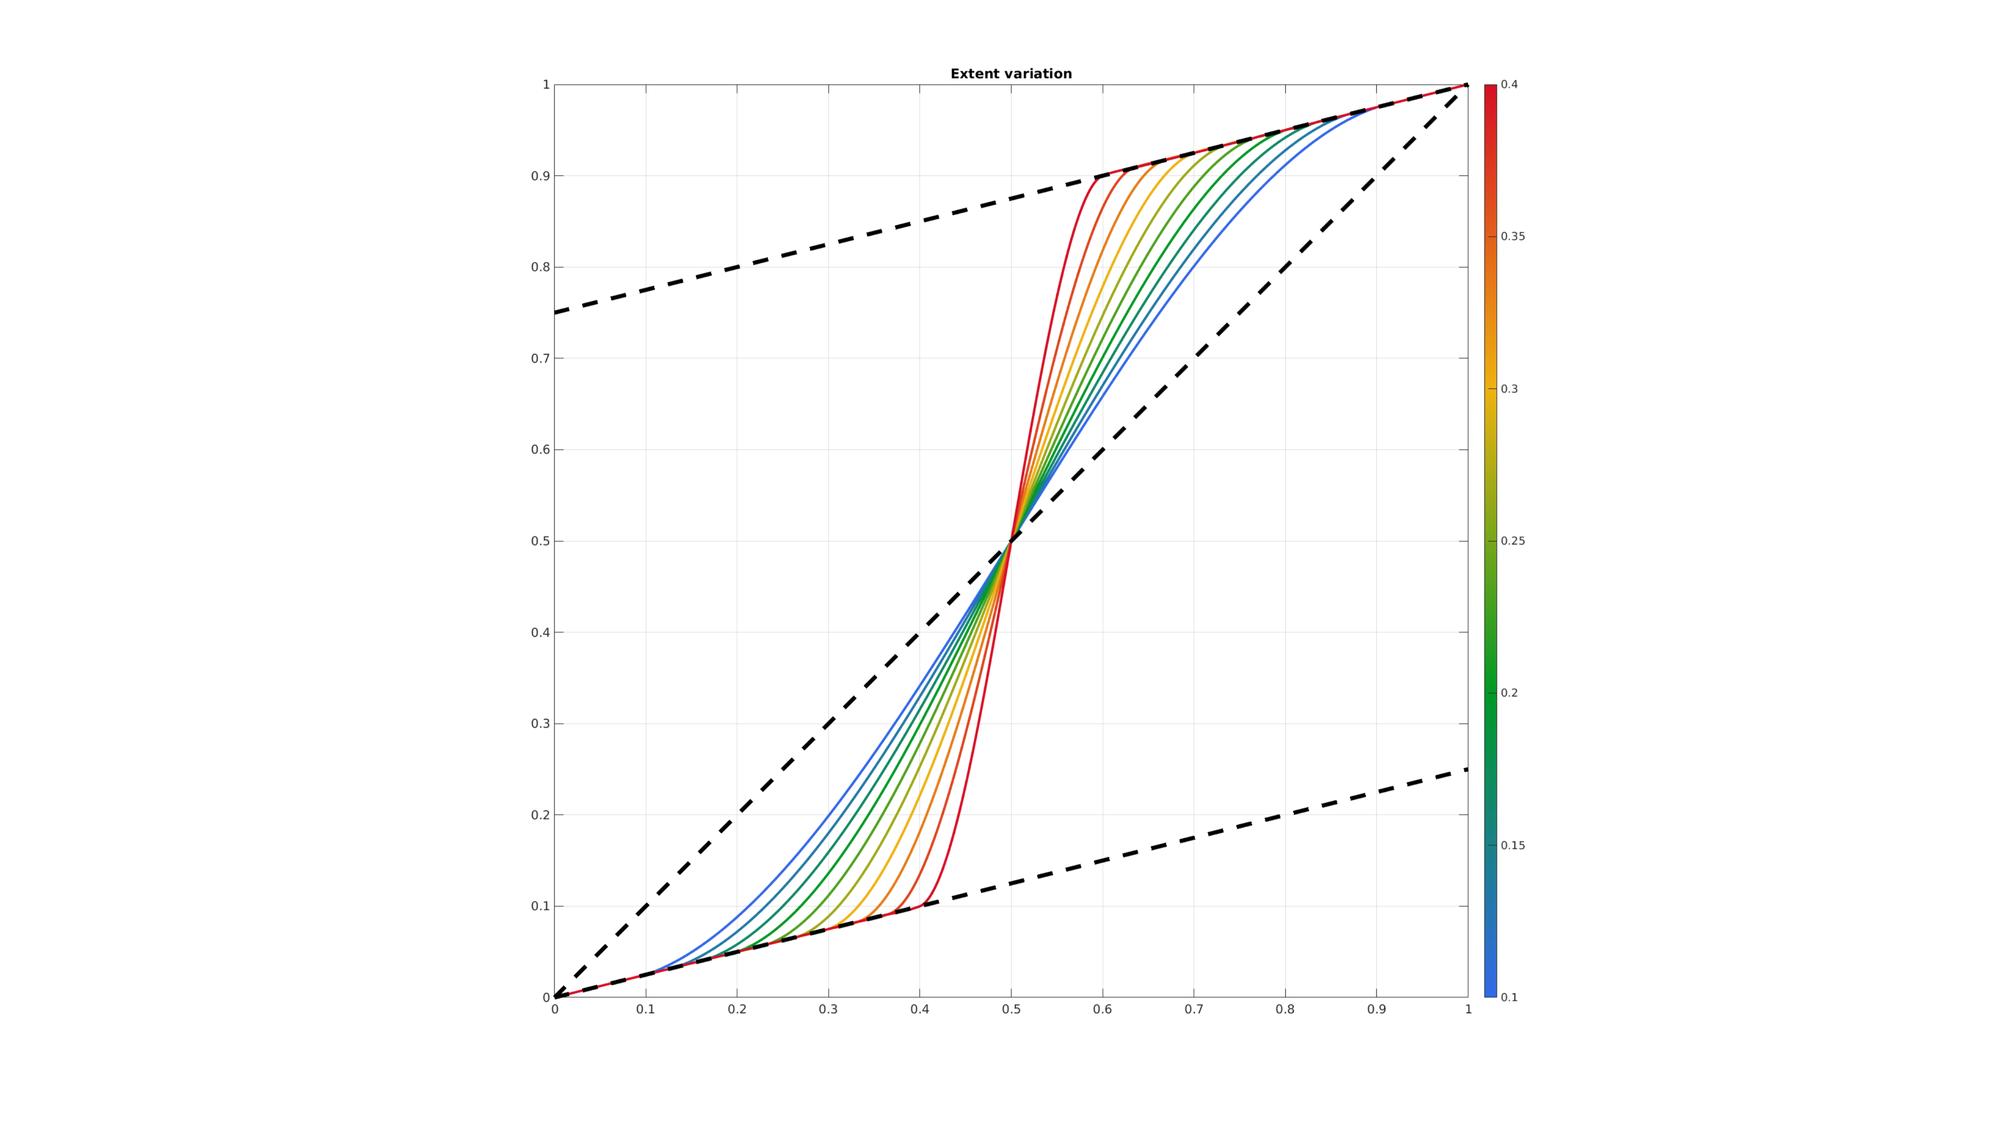
Varying extent of slope at ends
cFigure;
hold on;
title('Extent variation','fontSize',fontSize);

r1_q=linspace(0.1,0.4,n); %Extent variations
for q=1:1:n

    optStruct.c1=0.25;
    optStruct.c2=optStruct.c1;
    optStruct.r1=r1_q(q);
    optStruct.r2=optStruct.r1;

    [Vi]=sigmoid_pchip(optStruct);

    hp=plotV(Vi,'r-','LineWidth',3); set(hp,'Color',plotColor(q,:));
end

plotV([t(:) t(:)],'k--','LineWidth',5);
plotV([t(:) optStruct.c1*t(:)],'k--','LineWidth',5);
plotV([t(:) optStruct.c1*t(:)+(1-optStruct.c1)],'k--','LineWidth',5);
colormap(gjet(250)); colorbar; caxis([min(r1_q) max(r1_q)]);
axis tight; axis equal; hold on; box on; grid on; view(2);
set(gca,'FontSize',15);
drawnow;
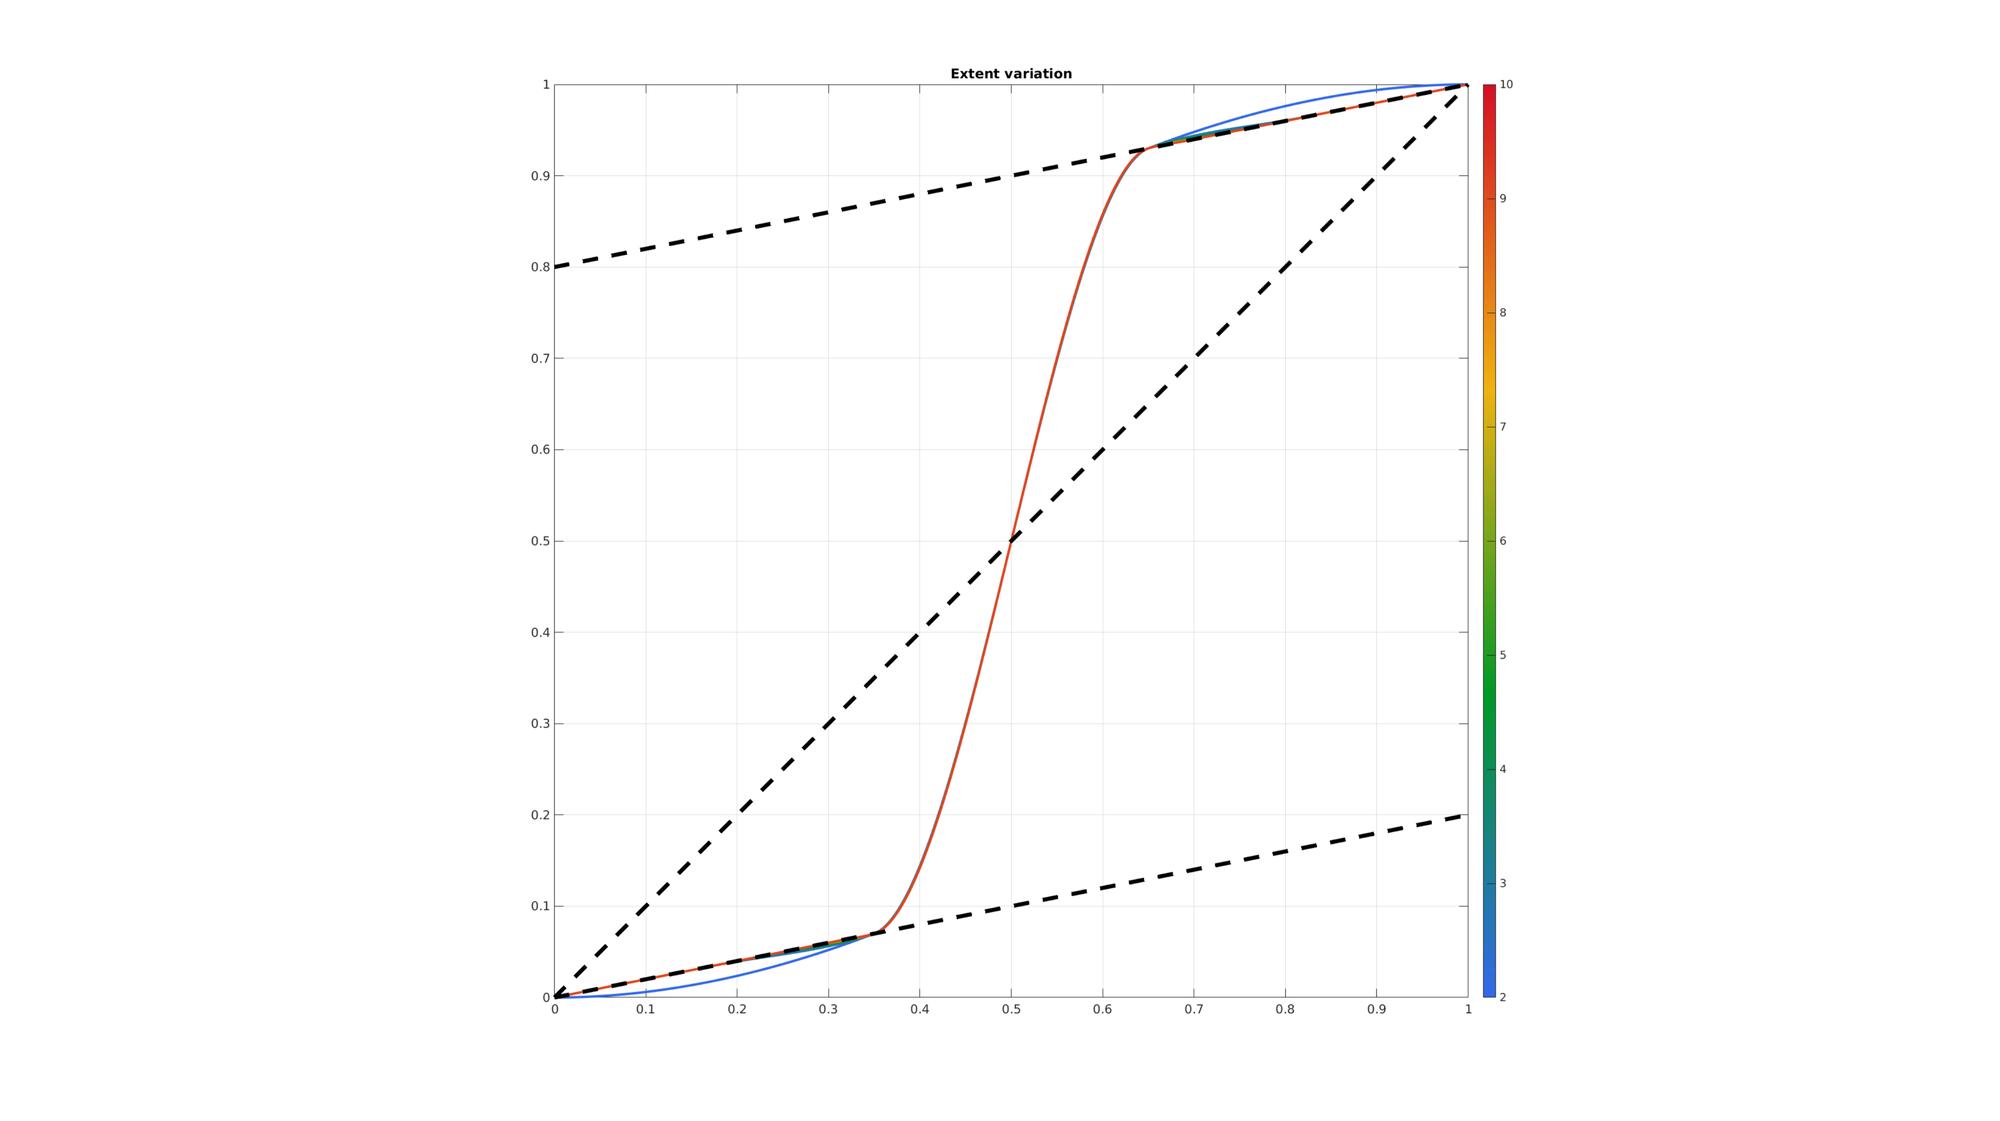
Varying number of points on the initial linear slope
optStruct.c1=0.2;
optStruct.c2=optStruct.c1;
optStruct.r1=0.35;
optStruct.r2=optStruct.r1;
optStruct.rMode=1;
optStruct.n=nPlot;

cFigure;
hold on;
title('Extent variation','fontSize',fontSize);

nLin_q=2:1:10; %Extent variations
n=numel(nLin_q);
for q=1:1:n

    optStruct.nLin=nLin_q(q);

    [Vi]=sigmoid_pchip(optStruct);

    hp=plotV(Vi,'r-','LineWidth',3); set(hp,'Color',plotColor(q,:));
end

plotV([t(:) t(:)],'k--','LineWidth',5);
plotV([t(:) optStruct.c1*t(:)],'k--','LineWidth',5);
plotV([t(:) optStruct.c1*t(:)+(1-optStruct.c1)],'k--','LineWidth',5);
colormap(gjet(250)); colorbar; caxis([min(nLin_q) max(nLin_q)]);
axis tight; axis equal; hold on; box on; grid on; view(2);
set(gca,'FontSize',15);
drawnow;

GIBBON www.gibboncode.org
Kevin Mattheus Moerman, [email protected]
GIBBON footer text
License: https://github.com/gibbonCode/GIBBON/blob/master/LICENSE
GIBBON: The Geometry and Image-based Bioengineering add-On. A toolbox for image segmentation, image-based modeling, meshing, and finite element analysis.
Copyright (C) 2019 Kevin Mattheus Moerman
This program is free software: you can redistribute it and/or modify it under the terms of the GNU General Public License as published by the Free Software Foundation, either version 3 of the License, or (at your option) any later version.
This program is distributed in the hope that it will be useful, but WITHOUT ANY WARRANTY; without even the implied warranty of MERCHANTABILITY or FITNESS FOR A PARTICULAR PURPOSE. See the GNU General Public License for more details.
You should have received a copy of the GNU General Public License along with this program. If not, see http://www.gnu.org/licenses/.