pointSetDistMap
Below is a basic demonstration of the features of the pointSetDistMap function.
Contents
clear; close all; clc;

% PLOT SETTINGS
markerSize1=5;
markerSize2=5;
lineWidth=2;
fontSize=10;
faceAlpha=0.8;
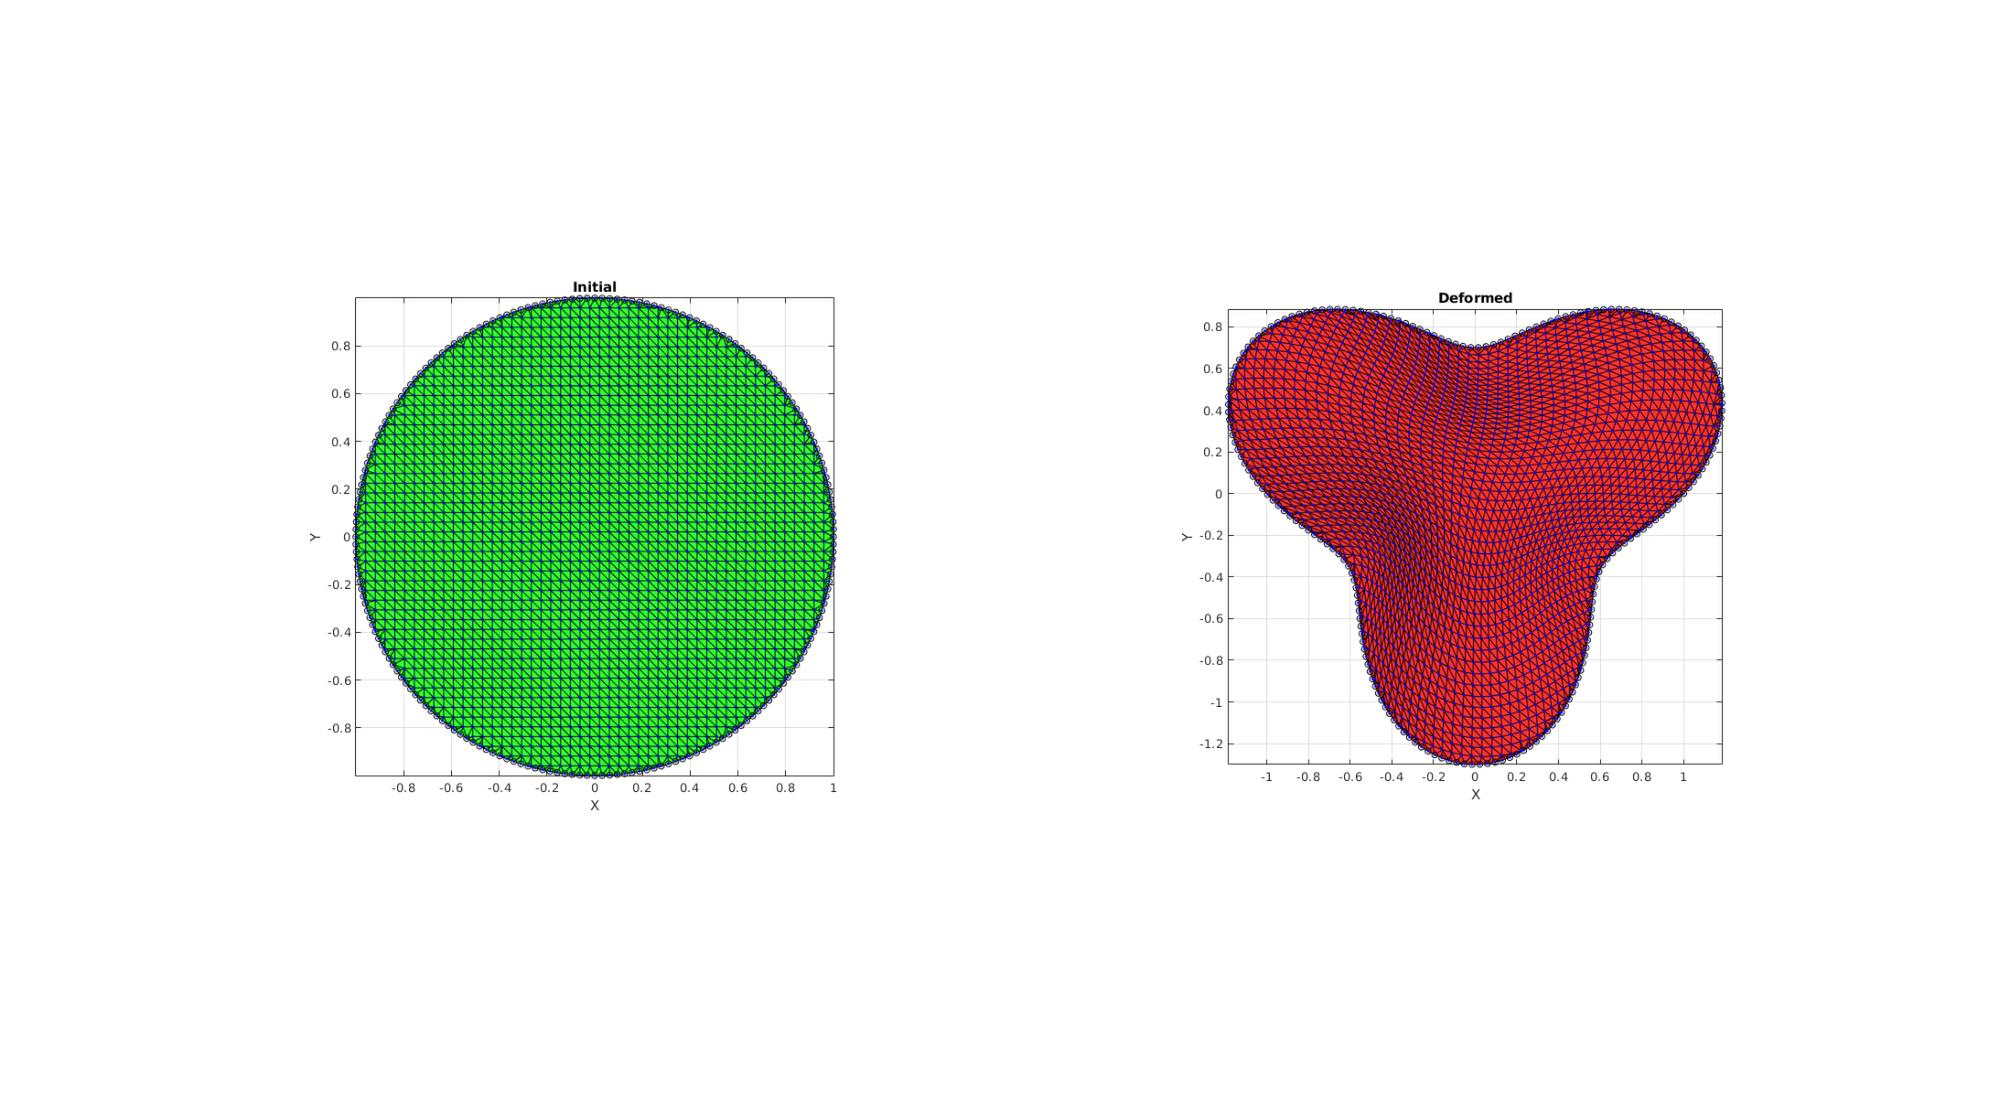
DEFORMING A 2D MESH
SIMULATING A 2D EXAMPLE
interpMethod='pchip';
closeLoopOpt=1;
n=200;

%P1
t=linspace(0,2*pi,n);
t=t(1:end-1);
r=ones(size(t));
[x,y] = pol2cart(t,r);
P1=[x(:) y(:)];
[P1]=evenlySampleCurve(P1,n,interpMethod,closeLoopOpt);

%P2
t=linspace(0,2*pi,n);
t=t(1:end-1);
r=1+0.3*sin(3*t);
[x,y] = pol2cart(t,r);
P2=[x(:) y(:)];
[P2]=evenlySampleCurve(P2,n,interpMethod,closeLoopOpt);

%P1i
np=50;
[x,y]=meshgrid(linspace(-1,1,np));
P1i=zeros(numel(x(:)),2);
P1i(:,1)=x(:);
P1i(:,2)=y(:);
[IN,~] = inpolygon(P1i(:,1),P1i(:,2),P1(:,1),P1(:,2));
P1i=P1i(IN(:),:);
P1i=[P1i; P1];
P1i=unique(P1i,'rows');
DT = delaunayTriangulation(P1i(:,[1 2]));

%P2i
Fw=5;
[P2i]=pointSetDistMap(P1,P1i,P2,Fw);
PLOTTING RESULTS: Circles are boundary points which should be mapped exactly. Blue points are the initial and mapped points. Tesselation shows connectivity (which may become distorted)
hf1=cFigure;
subplot(1,2,1); hold on;
title('Initial','FontSize',fontSize);
gpatch(DT.ConnectivityList,P1i,'g','k',faceAlpha);
plot(P1(:,1),P1(:,2),'ko-','MarkerSize',markerSize1);
plot(P1i(:,1),P1i(:,2),'b.','MarkerSize',markerSize2);
axisGeom(gca,fontSize); view(2);

subplot(1,2,2); hold on;
title('Deformed','FontSize',fontSize);
gpatch(DT.ConnectivityList,P2i,'r','k',faceAlpha);
plot(P2(:,1),P2(:,2),'ko-','MarkerSize',markerSize1);
plot(P2i(:,1),P2i(:,2),'b.','MarkerSize',markerSize2);
axisGeom(gca,fontSize); view(2);
drawnow;
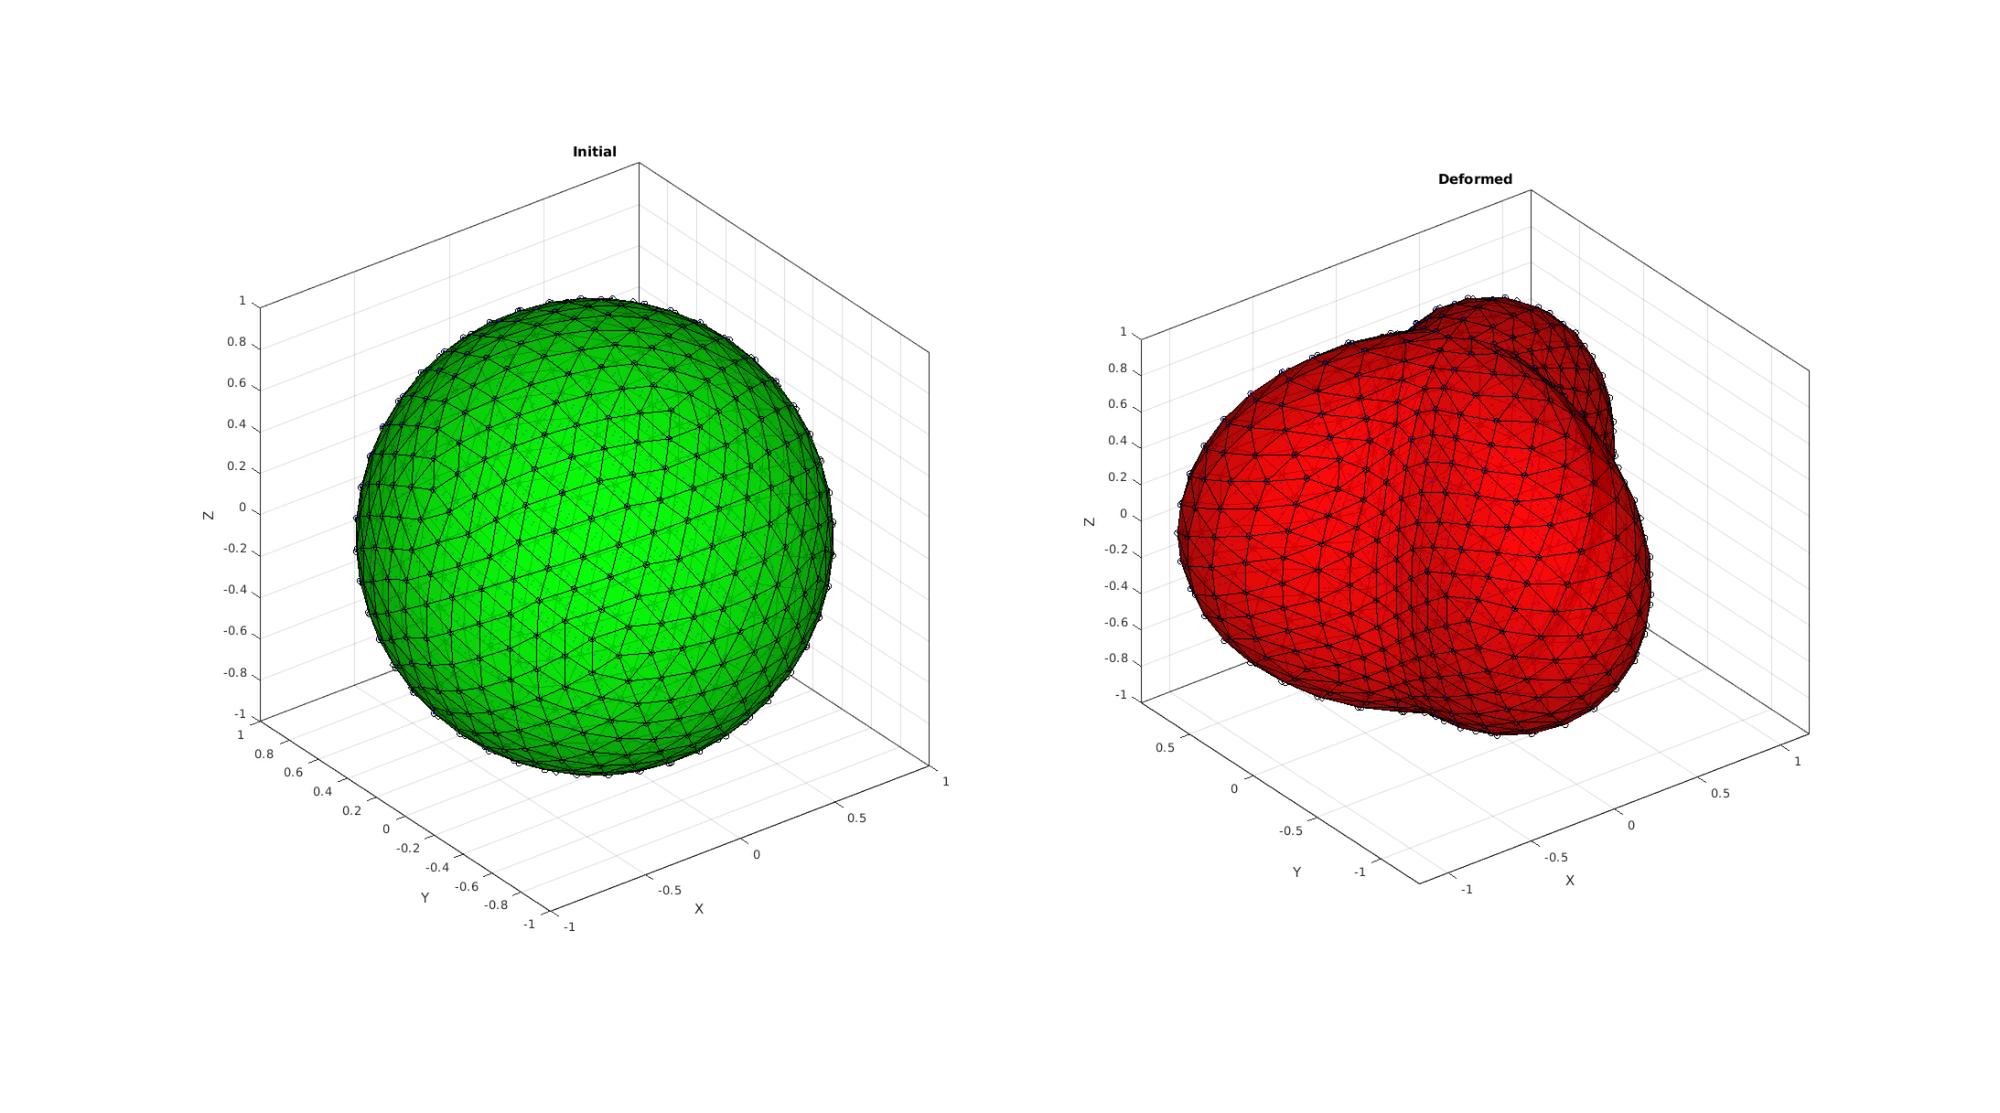
DEFORMING A 3D MESH
SIMULATING A 3D EXAMPLE
%P1
[F,P1,~]=geoSphere(3,1);

%P1i
np=15;
[x,y,z]=meshgrid(linspace(-1,1,np));
P1i=[x(:) y(:) z(:)];
DT = delaunayTriangulation(P1);
LI = ~isnan(pointLocation(DT,P1i));
P1i=[P1; P1i(LI,:)];
P1i=unique(P1i,'rows');
DT = delaunayTriangulation(P1i(:,[1 2]));

%P2
[PHI,THETA,~] = cart2sph(P1(:,1),P1(:,2),P1(:,3));
R=1+0.3*sin(3*PHI);
P2=P1;
[P2(:,1),P2(:,2),~]=sph2cart(PHI,THETA,R);

%P2i
Fw=5;
[P2i]=pointSetDistMap(P1,P1i,P2,Fw);
Warning: Duplicate data points have been detected and removed.
 The Triangulation indices are defined with respect to the unique set of points
 in delaunayTriangulation.
PLOTTING RESULTS: Circles are boundary points which should be mapped exactly. Blue points are the initial and mapped points. Tesselation shows connectivity (which may become distorted)
hf2=cFigure;
subplot(1,2,1); hold on;
title('Initial','FontSize',fontSize);
gpatch(F,P1,'g','k',faceAlpha);
plot3(P1(:,1),P1(:,2),P1(:,3),'ko','MarkerSize',markerSize1);
plot3(P1i(:,1),P1i(:,2),P1i(:,3),'b.','MarkerSize',markerSize2);
axisGeom(gca,fontSize); camlight('headlight');

subplot(1,2,2); hold on;
title('Deformed','FontSize',fontSize);
gpatch(F,P2,'r','k',faceAlpha);
plot3(P2(:,1),P2(:,2),P2(:,3),'ko','MarkerSize',markerSize1);
plot3(P2i(:,1),P2i(:,2),P2i(:,3),'b.','MarkerSize',markerSize2);
set(gca,'FontSize',fontSize);
axisGeom(gca,fontSize); camlight('headlight');
drawnow;
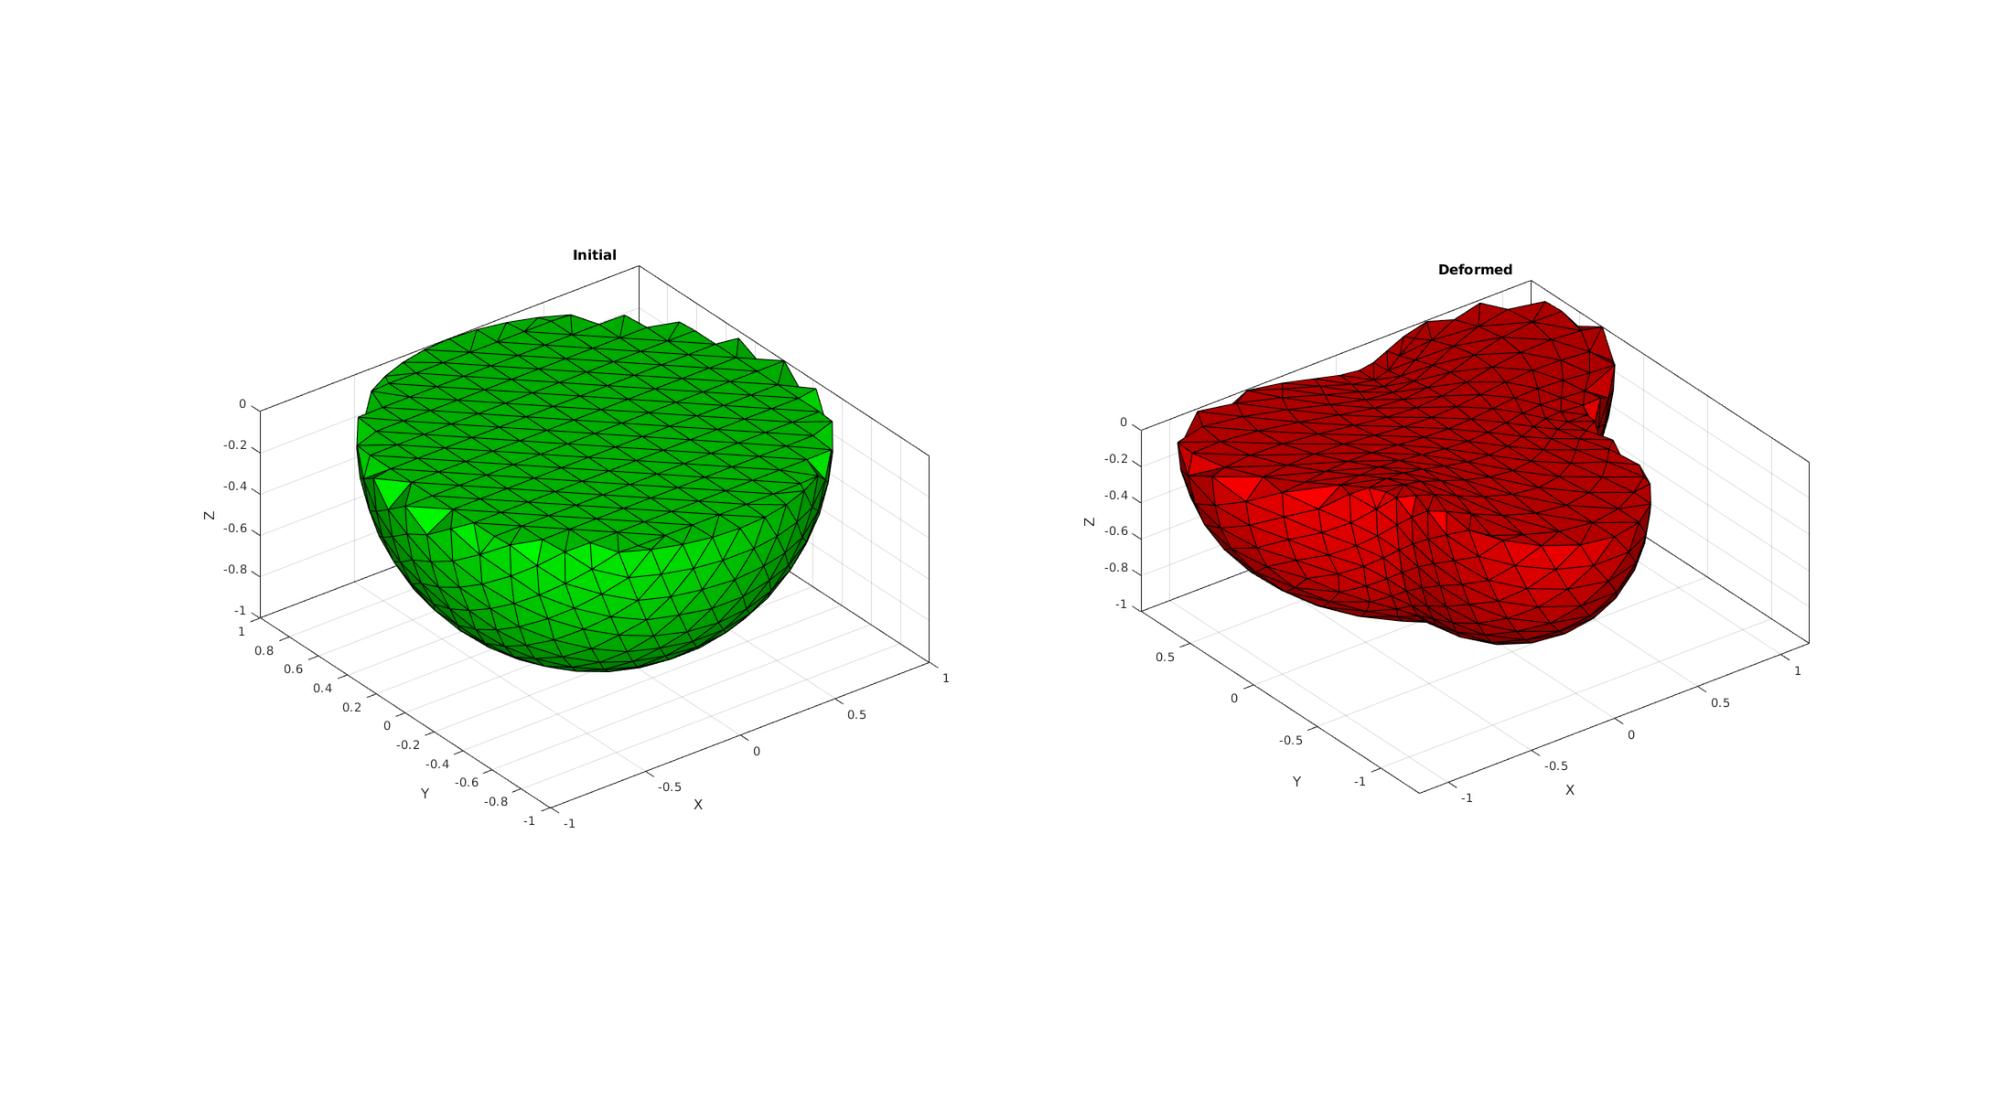
%Create tesselations for vizualisation
V1=[P1; P1i]; V2=[P2; P2i];
[~,ind1,ind2]=unique(V1,'rows'); %remove double points
V1=V1(ind1,:);
V2=V2(ind1,:);
DT1 = delaunayTriangulation(V1);
TET=DT1.ConnectivityList;

%Create cut
Z=V1(:,3);
Ztet=mean(Z(TET),2);
Ltet=(Ztet<0);

%Convert elements of interest to patchable faces
[Ft,~]=element2patch(TET(Ltet,:),1:size(TET(Ltet,:),1));

%Only plot outer faces

%Get face counts
Fs=sort(Ft,2); %Sort so faces with same nodes have the same rows
[~,IND_F,IND_F_2]=unique(Fs,'rows');
F_uni=Ft(IND_F,:);
numF=size(Fs,1);
numFuni=size(F_uni,1);
logicColourMatrixEntry=sparse(IND_F_2,1:numF,1,numFuni,numF,numF);
F_count=full(sum(logicColourMatrixEntry,2));
Ftu=F_uni(F_count==1,:); %Get outer surfaces

hf3=cFigure;
subplot(1,2,1); hold on;
title('Initial','FontSize',fontSize);
gpatch(Ftu,V1,'g');
set(gca,'FontSize',fontSize);
axisGeom(gca,fontSize); camlight('headlight');

subplot(1,2,2); hold on;
title('Deformed','FontSize',fontSize);
gpatch(Ftu,V2,'r');
set(gca,'FontSize',fontSize);
axisGeom(gca,fontSize); camlight('headlight');

drawnow;

GIBBON www.gibboncode.org
Kevin Mattheus Moerman, [email protected]
GIBBON footer text
License: https://github.com/gibbonCode/GIBBON/blob/master/LICENSE
GIBBON: The Geometry and Image-based Bioengineering add-On. A toolbox for image segmentation, image-based modeling, meshing, and finite element analysis.
Copyright (C) 2006-2021 Kevin Mattheus Moerman and the GIBBON contributors
This program is free software: you can redistribute it and/or modify it under the terms of the GNU General Public License as published by the Free Software Foundation, either version 3 of the License, or (at your option) any later version.
This program is distributed in the hope that it will be useful, but WITHOUT ANY WARRANTY; without even the implied warranty of MERCHANTABILITY or FITNESS FOR A PARTICULAR PURPOSE. See the GNU General Public License for more details.
You should have received a copy of the GNU General Public License along with this program. If not, see http://www.gnu.org/licenses/.