patchPathAngles
Below is a demonstration of the features of the patchPathAngles function
Contents
clear; close all; clc;
Syntax
[indAngles]=patchPathAngles(F,V,ind,isClosedLoop);
Description
The patchPathAngles function computes the angles between adjacent edges on a curve on a patch.
Examples
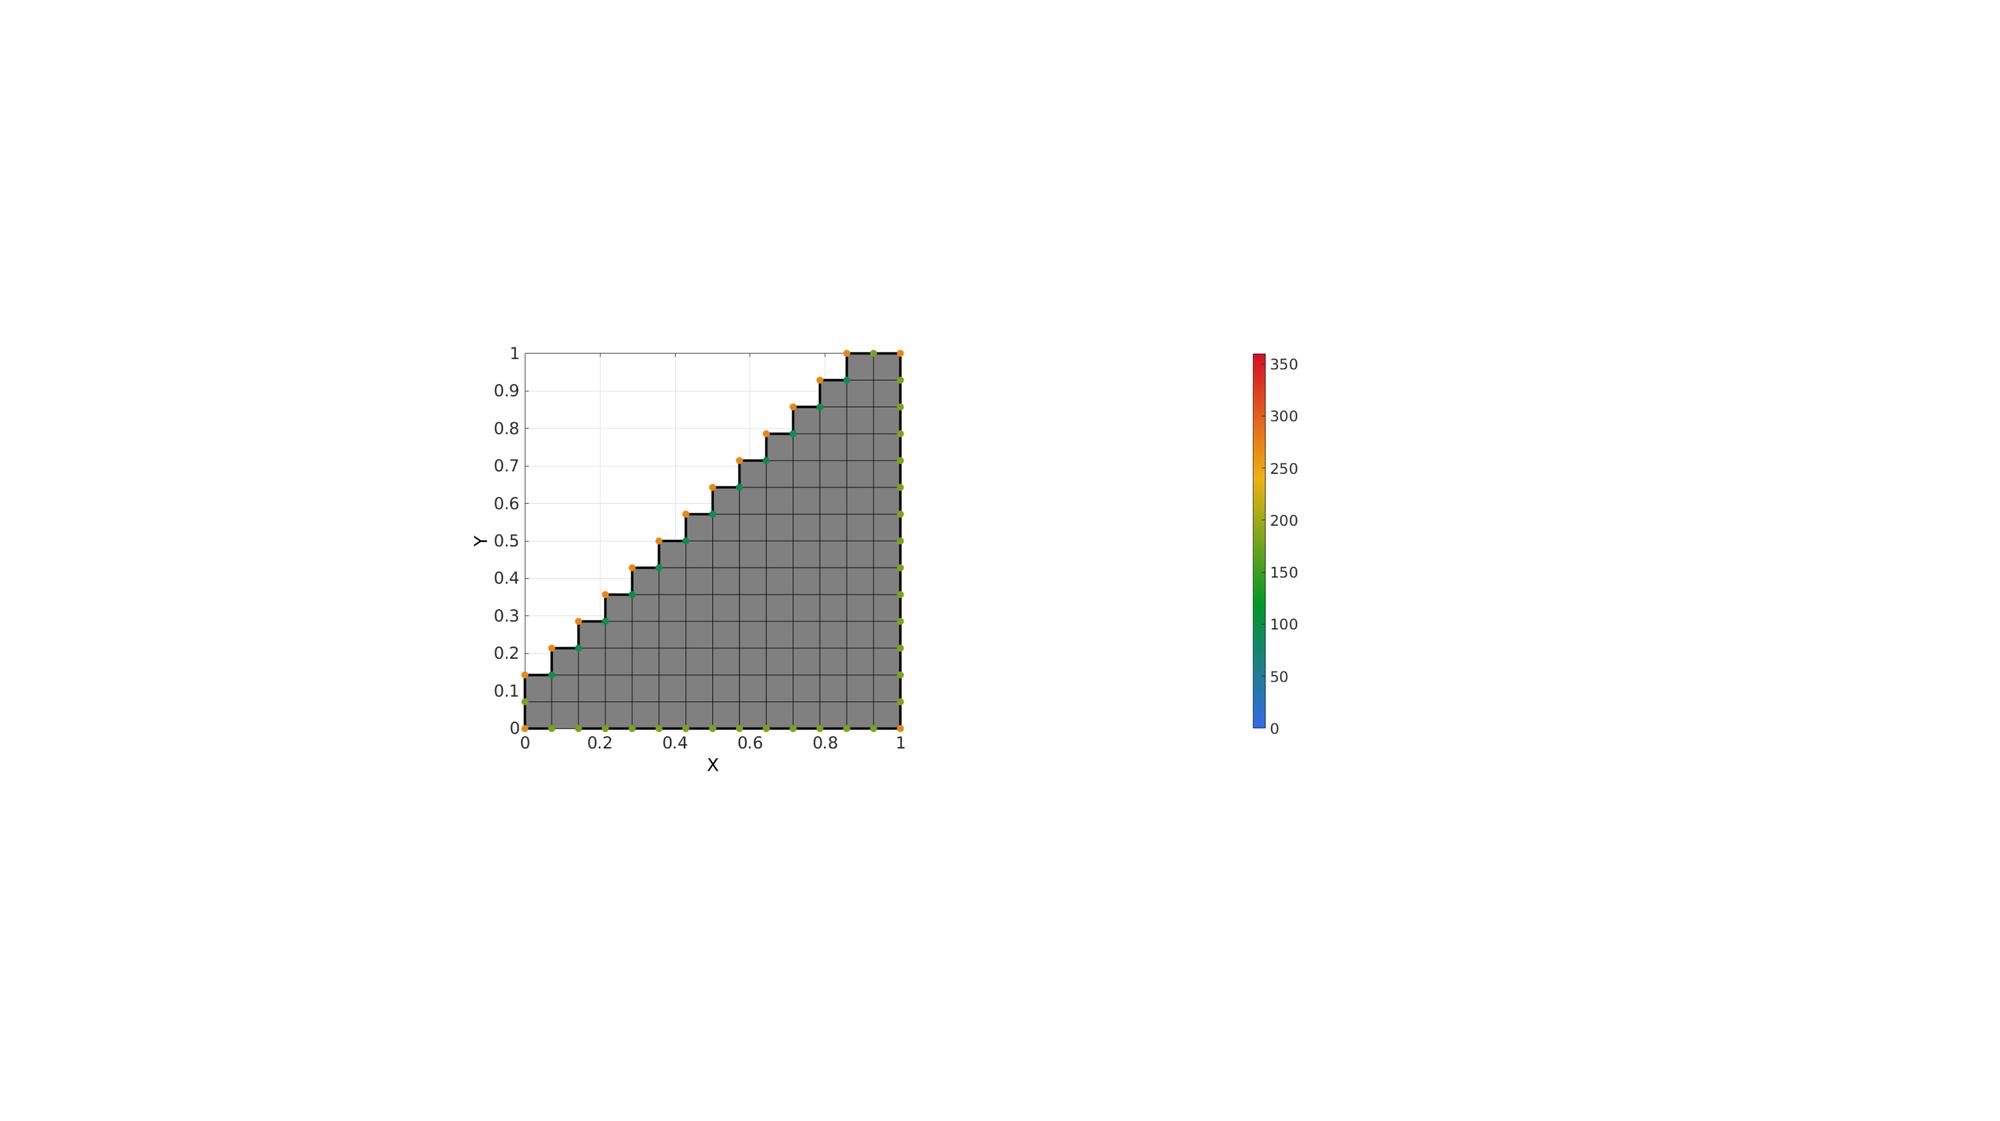
Example 1: Get angles on a closed path defined on the the boundary of a patch
Create test data set
w=1;
[X,Y]=ndgrid(linspace(0,w,15));
Z=ones(size(X));
C=tril(Z);
[F,V,C]=surf2patch(X,Y,Z,C);
C=vertexToFaceMeasure(F,C)>0;

logicKeep=C>0;
F=F(logicKeep,:);
C=C(logicKeep,:);
[F,V]=patchCleanUnused(F,V);
Get boundary curve
Eb=patchBoundary(F,V);
indBoundaryCurve=edgeListToCurve(Eb);
indBoundaryCurve=indBoundaryCurve(1:end-1)'; %Start=End for closed curve so remove double entry
Calculate mesh path angles
isClosedPath=1;
[A]=patchPathAngles(F,V,indBoundaryCurve,isClosedPath);
A=180*(A./pi); % Conver to degrees

% Display unique angles in set
unique(A)
ans =

    90
   180
   270
cFigure; hold on;
gpatch(F,V,'kw');
plotV(V(indBoundaryCurve,:),'k-','LineWidth',3);
scatterV(V(indBoundaryCurve,:),75,A,'filled');
colormap gjet; colorbar; caxis([0 360]);
axisGeom; view(2);
drawnow;
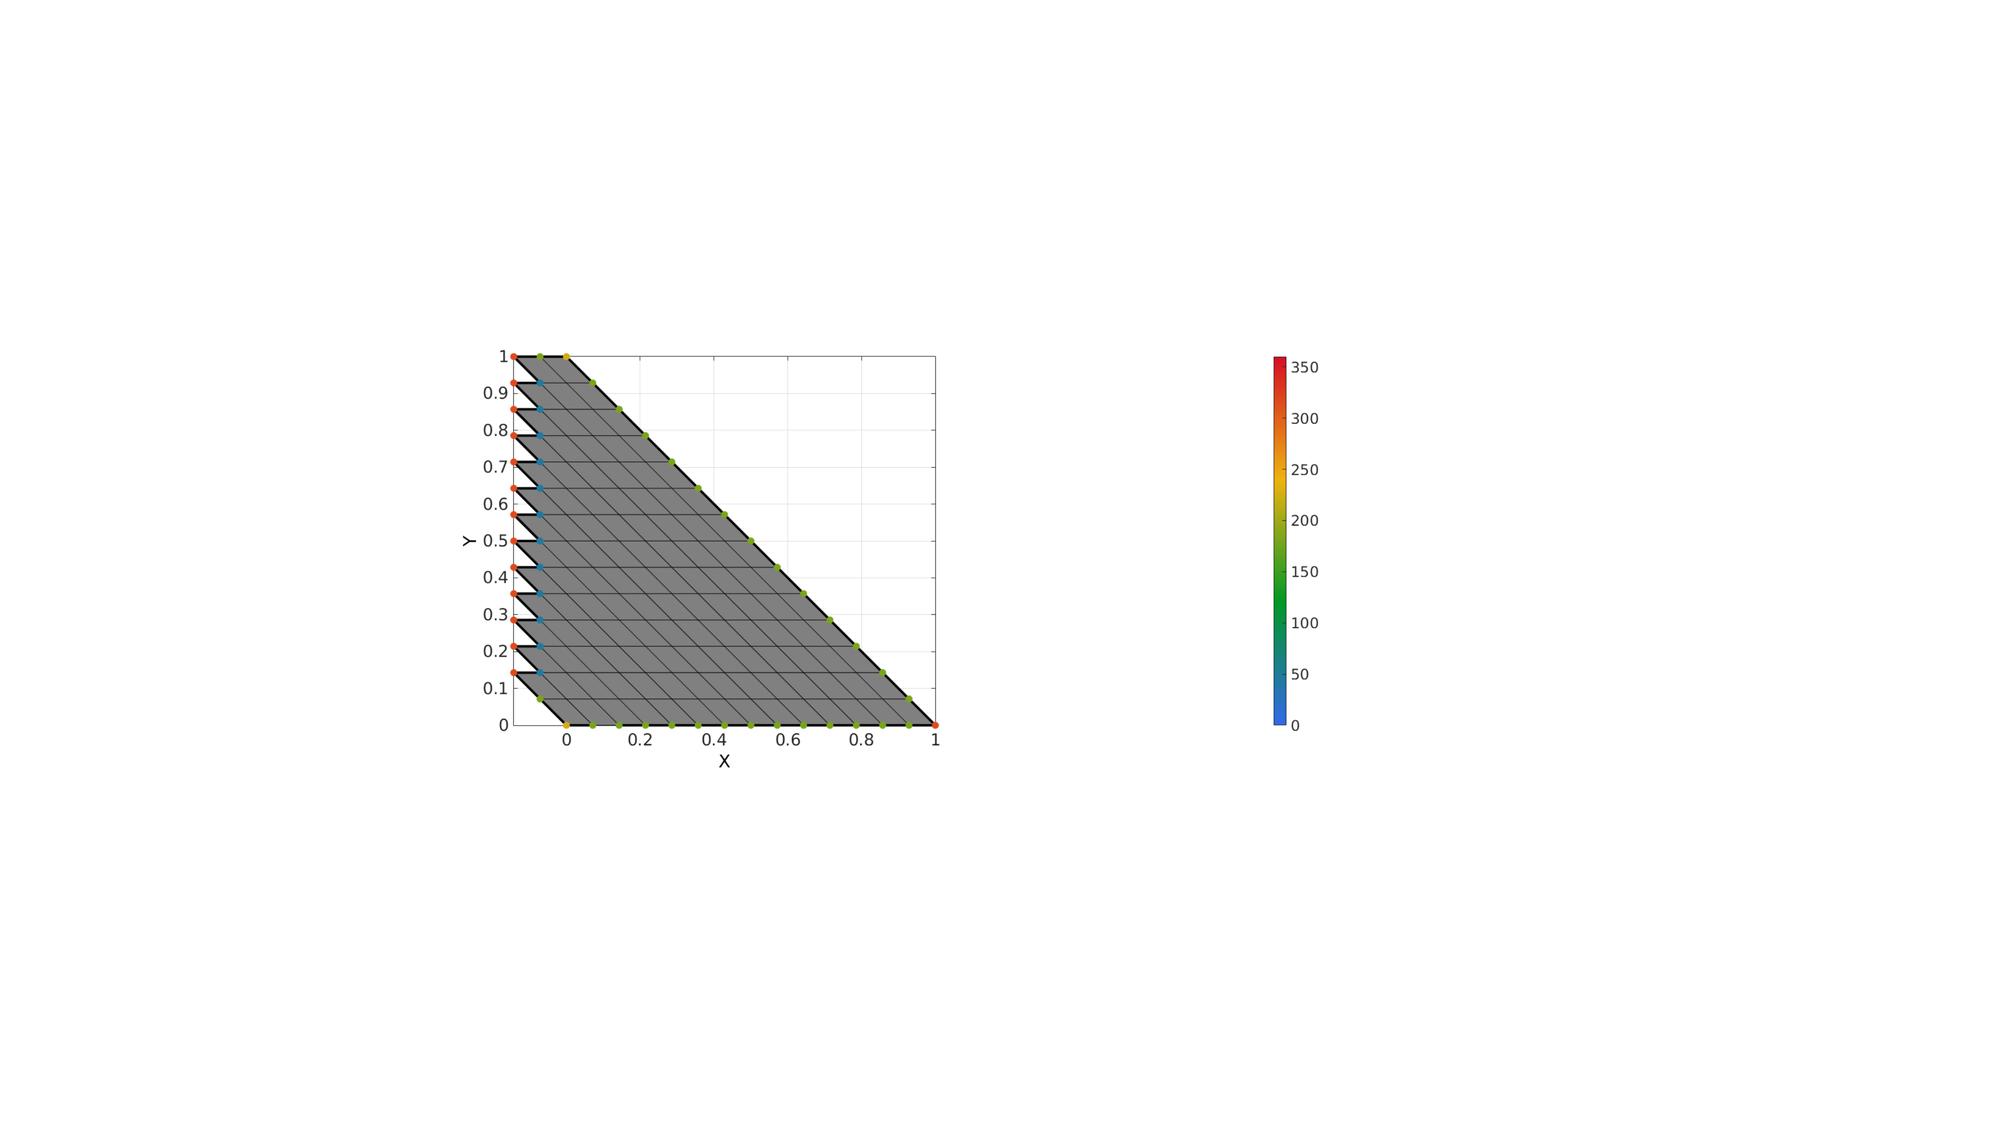
Example 2: Study angles for altered shape
V(:,1)=V(:,1)-V(:,2);
Calculate mesh path angles
isClosedPath=1;
[A]=patchPathAngles(F,V,indBoundaryCurve,isClosedPath);
A=180*(A./pi); % Conver to degrees

% Display unique angles in set
unique(A)
ans =

    45
   180
   225
   315
cFigure; hold on;
gpatch(F,V,'kw');
plotV(V(indBoundaryCurve,:),'k-','LineWidth',3);
scatterV(V(indBoundaryCurve,:),75,A,'filled');
colormap gjet; colorbar; caxis([0 360]);
axisGeom; view(2);
drawnow;
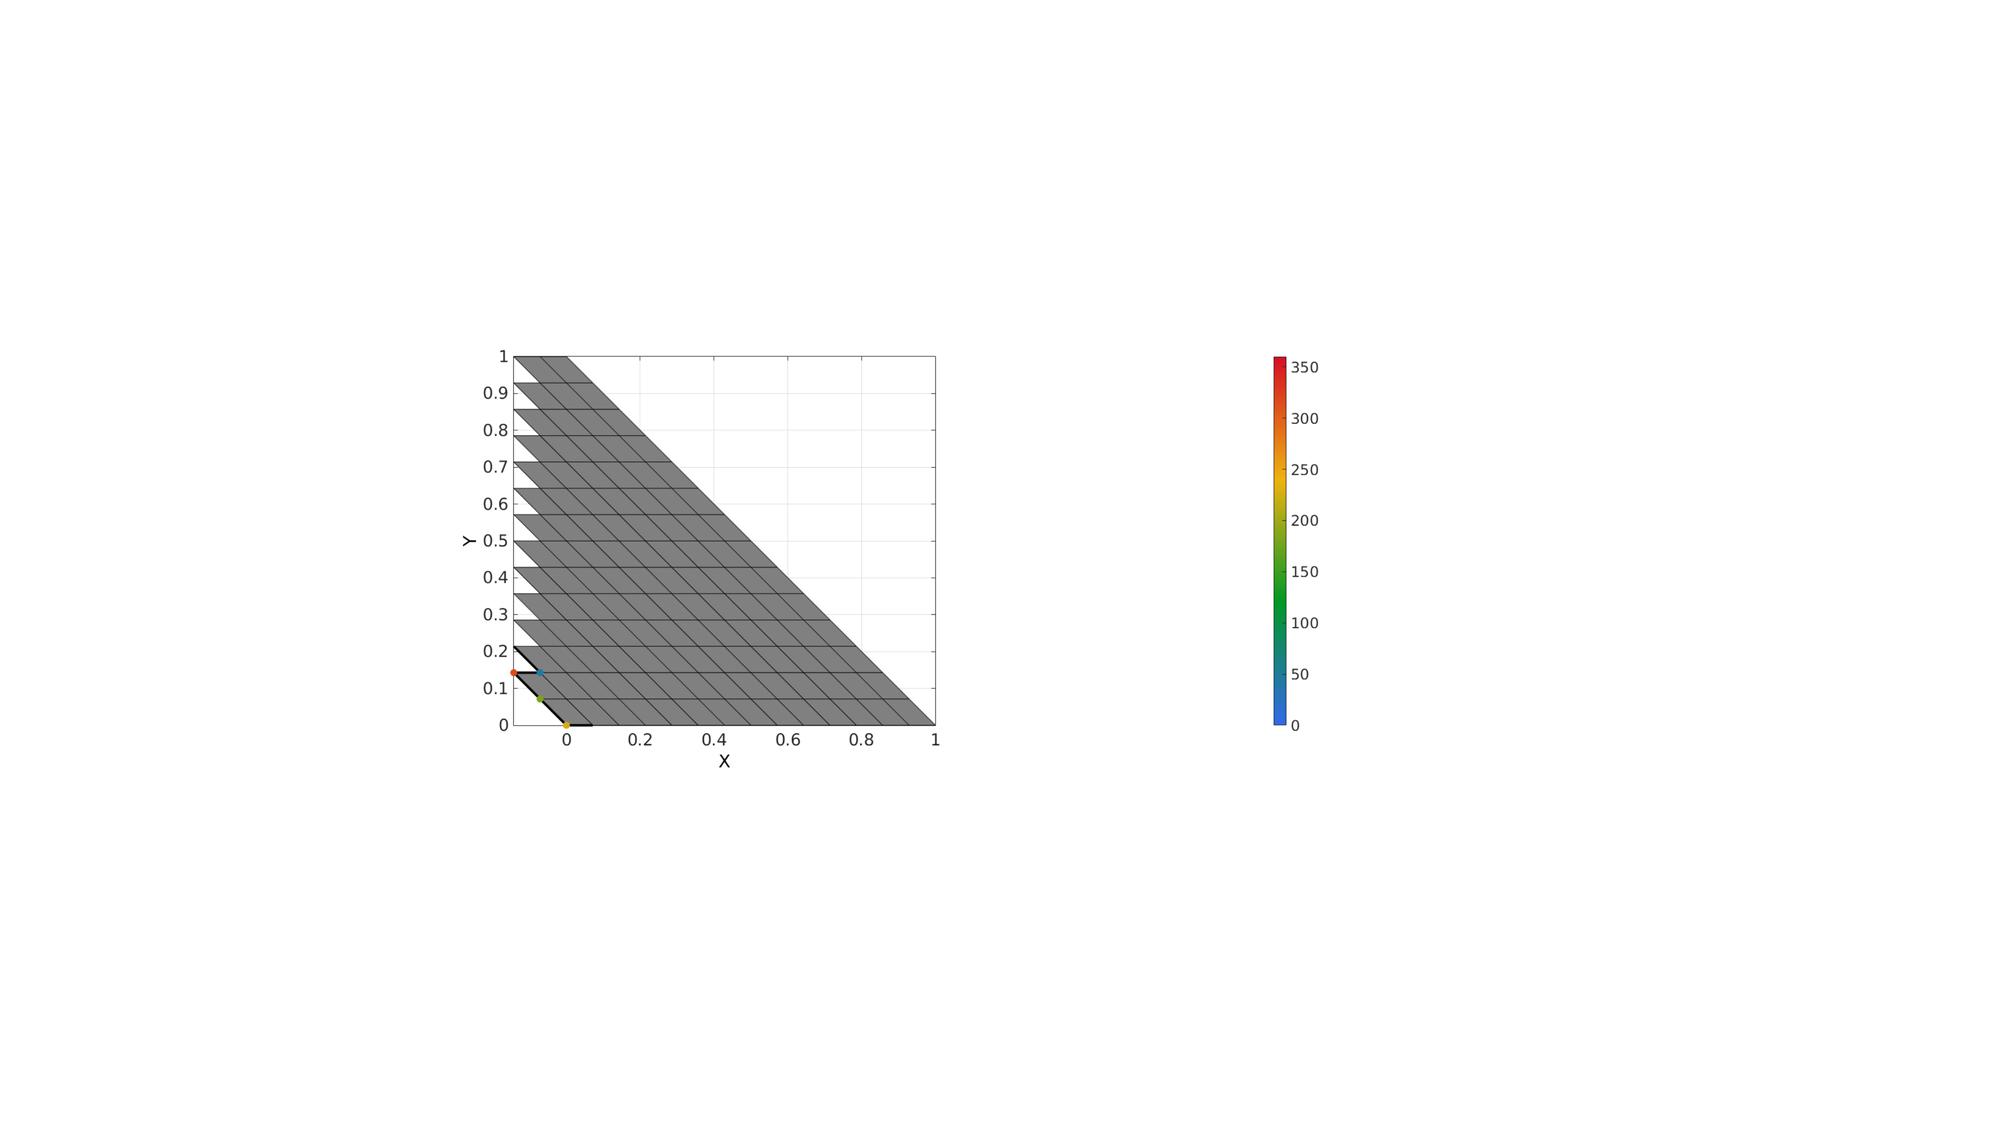
Example 3: Get angles on a non-closed path defined on the the boundary of a patch
Create path segment
indBoundaryCurve=indBoundaryCurve(1:6);
Calculate mesh path angles
isClosedPath=0;
[A]=patchPathAngles(F,V,indBoundaryCurve,isClosedPath);
A=180*(A./pi); % Conver to degrees

% Display unique angles in set
unique(A(~isnan(A)))
ans =

    45
   180
   225
   315
cFigure; hold on;
gpatch(F,V,'kw');
plotV(V(indBoundaryCurve,:),'k-','LineWidth',3);
scatterV(V(indBoundaryCurve,:),75,A,'filled');
colormap gjet; colorbar; caxis([0 360]);
axisGeom; view(2);
drawnow;

GIBBON www.gibboncode.org
Kevin Mattheus Moerman, [email protected]
GIBBON footer text
License: https://github.com/gibbonCode/GIBBON/blob/master/LICENSE
GIBBON: The Geometry and Image-based Bioengineering add-On. A toolbox for image segmentation, image-based modeling, meshing, and finite element analysis.
Copyright (C) 2019 Kevin Mattheus Moerman
This program is free software: you can redistribute it and/or modify it under the terms of the GNU General Public License as published by the Free Software Foundation, either version 3 of the License, or (at your option) any later version.
This program is distributed in the hope that it will be useful, but WITHOUT ANY WARRANTY; without even the implied warranty of MERCHANTABILITY or FITNESS FOR A PARTICULAR PURPOSE. See the GNU General Public License for more details.
You should have received a copy of the GNU General Public License along with this program. If not, see http://www.gnu.org/licenses/.