patch2Im
Below is a demonstration of the features of the patch2Im function
Contents
clear; close all; clc;
Syntax
[M,G,bwLabels]=patch2Im(F,V,C,voxelSize,imOrigin,imSiz);
Description
This function converts patch surface data to images. The input C can be used to set the label for each surface and corresponding image region. The regions are assigned in order according to the color label in C. See also triSurf2Im
Examples
Plot settings
fontSize=10;
faceAlpha1=1;
faceAlpha2=0.3;
cMap=[0.5 0.5 0.5; gjet(4)];
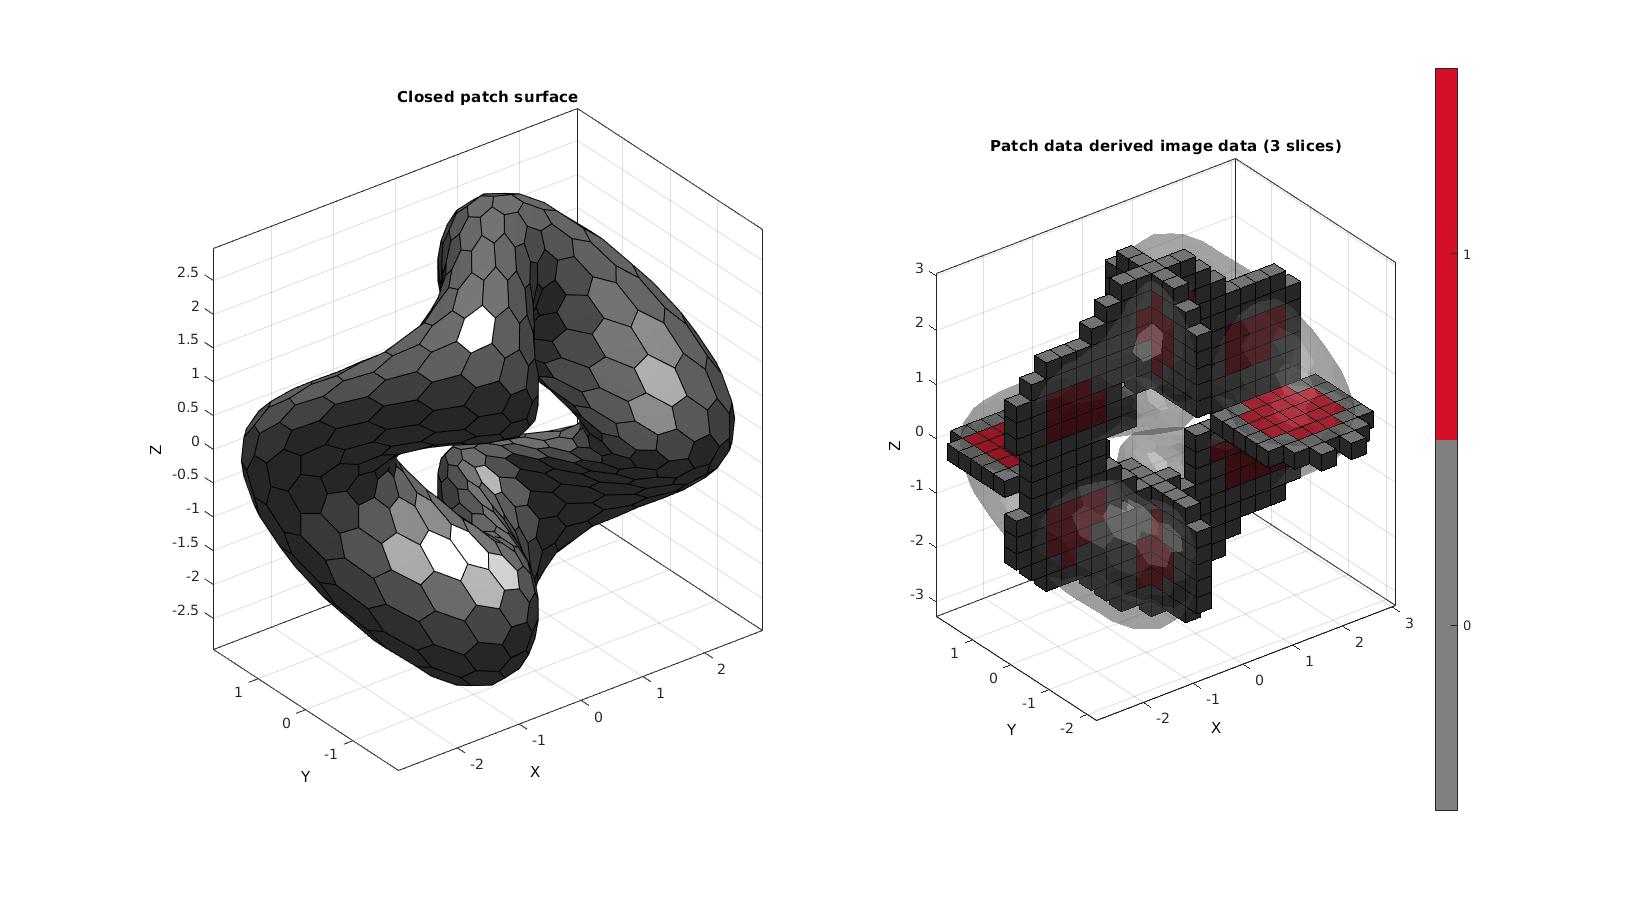
EXAMPLE 1: CONVERTING PATCH DATA WITH A SINGLE BOUNDARY TO AN IMAGE
Defining an example surface model
% Defining a deformed and rotated torus shape
r=1; %Sphere radius
rc=2; %Central radius
nr=16;
nc=30;
ptype='honey';
[F,V]=patchTorus(r,nr,rc,nc,ptype);
[THETA,RHO] = cart2pol(V(:,1),V(:,2));
V(:,3)=V(:,3)+sin(3*THETA);
[R,~]=euler2DCM([0.5*pi 0.5*pi 0.*pi]);
V=V*R;
% Using |patch2Im| function to convert patch data to image data
[M,G,~]=patch2Im(F,V);
voxelSize=G.voxelSize;
imOrigin=G.origin;
Plotting the results
L_plot=false(size(M));
L_plot(:,:,round(size(M,3)/2))=1;
L_plot(round(size(M,1)/2),:,:)=1;
L_plot(:,round(size(M,2)/2),:)=1;
L_plot=L_plot & ~isnan(M);
[Fm,Vm,Cm]=im2patch(M,L_plot,'v');
[Vm(:,1),Vm(:,2),Vm(:,3)]=im2cart(Vm(:,2),Vm(:,1),Vm(:,3),voxelSize*ones(1,3));
Vm=Vm+imOrigin(ones(size(Vm,1),1),:);

cFigure;
subplot(1,2,1); hold on;
title('Closed patch surface','FontSize',fontSize);

gpatch(F,V,'kw','k',faceAlpha1);

camlight('headlight');
axisGeom(gca,fontSize);

subplot(1,2,2); hold on;
title('Patch data derived image data (3 slices)','FontSize',fontSize);

gpatch(F,V,'kw','none',faceAlpha2);
gpatch(Fm,Vm,Cm,'k',faceAlpha1);

colormap(cMap); icolorbar;
camlight('headlight');
axisGeom(gca,fontSize);

drawnow;
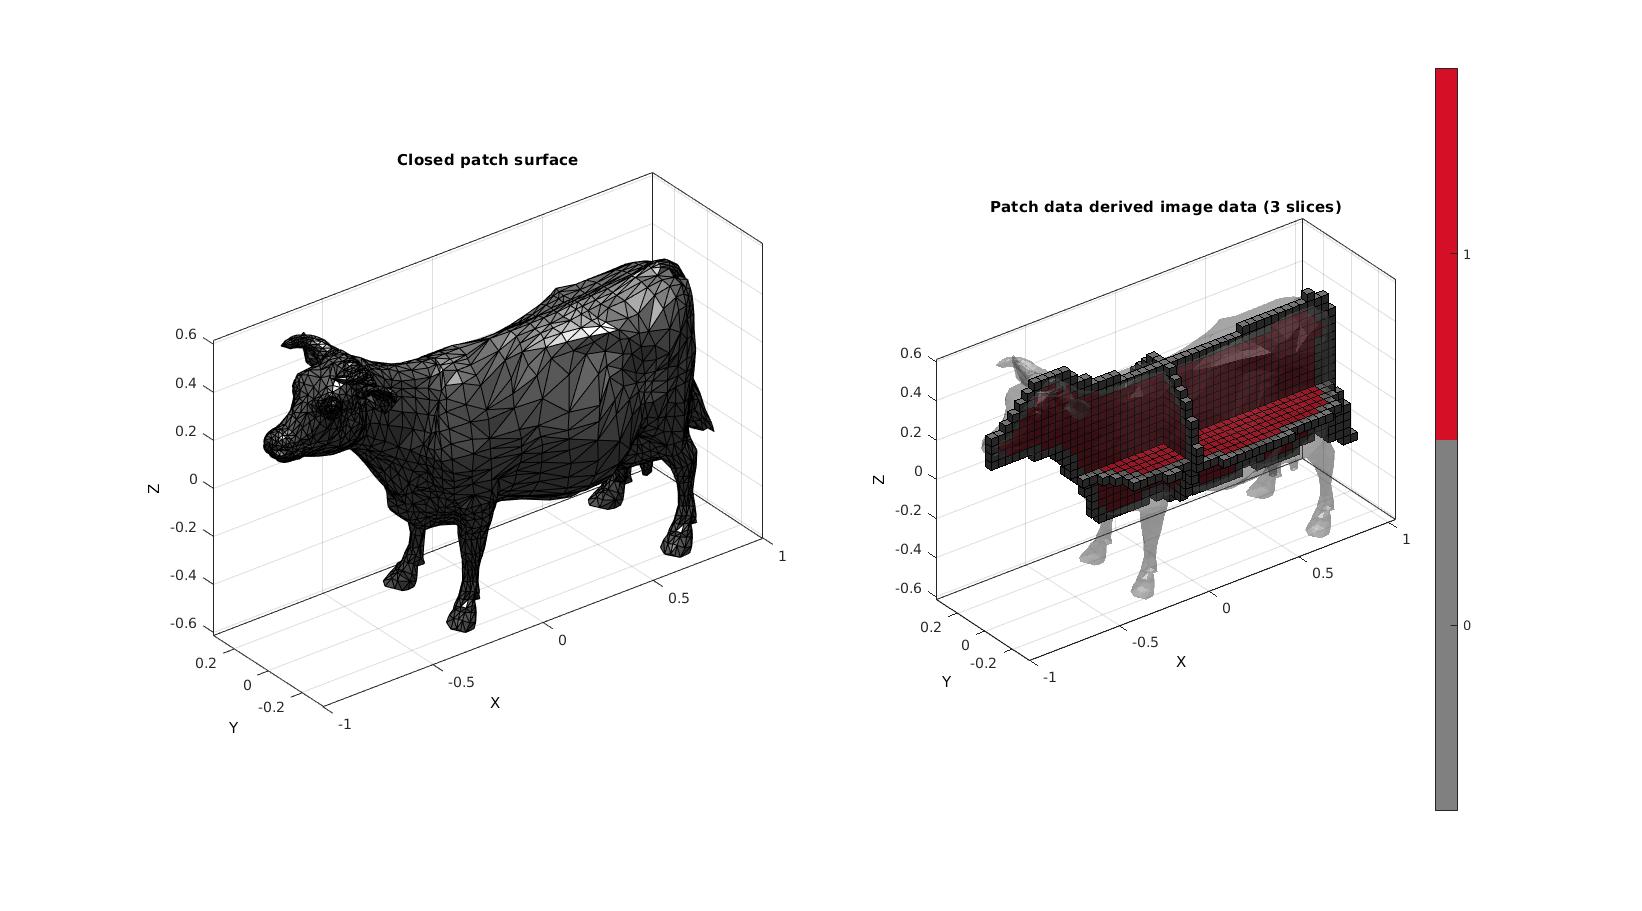
EXAMPLE 2: CONVERTING PATCH DATA WITH A SINGLE BOUNDARY TO AN IMAGE
Defining an example surface model
[F,V]=graphicsModels(3);
% Defining the full set of possible control parameters
voxelSize=(max(V(:,1))-min(V(:,1)))/50; % The output image voxel size.
imOrigin=min(V,[],1)-voxelSize;
imMax=max(V,[],1)+voxelSize;
imSiz=round((imMax-imOrigin)/voxelSize);
imSiz=imSiz([2 1 3]); %Image size (x, y corresponds to j,i in image coordinates, hence the permutation)

% Using |patch2Im| function to convert patch data to image data
[M]=patch2Im(F,V,ones(size(F,1),1),voxelSize,imOrigin,imSiz);
Plotting the results
L_plot=false(size(M));
L_plot(:,:,round(size(M,3)/2))=1;
L_plot(round(size(M,1)/2),:,:)=1;
L_plot(:,round(size(M,2)/2),:)=1;
L_plot=L_plot & ~isnan(M);
[Fm,Vm,Cm]=im2patch(M,L_plot,'v');
[Vm(:,1),Vm(:,2),Vm(:,3)]=im2cart(Vm(:,2),Vm(:,1),Vm(:,3),voxelSize*ones(1,3));
Vm=Vm+imOrigin(ones(size(Vm,1),1),:);

cFigure;
subplot(1,2,1); hold on;
title('Closed patch surface','FontSize',fontSize);

gpatch(F,V,'kw','k',faceAlpha1);

camlight('headlight');
axisGeom(gca,fontSize);

subplot(1,2,2); hold on;
title('Patch data derived image data (3 slices)','FontSize',fontSize);

gpatch(F,V,'kw','none',faceAlpha2);
gpatch(Fm,Vm,Cm,'k',faceAlpha1);

colormap(cMap); icolorbar;
camlight('headlight');
axisGeom(gca,fontSize);

drawnow;
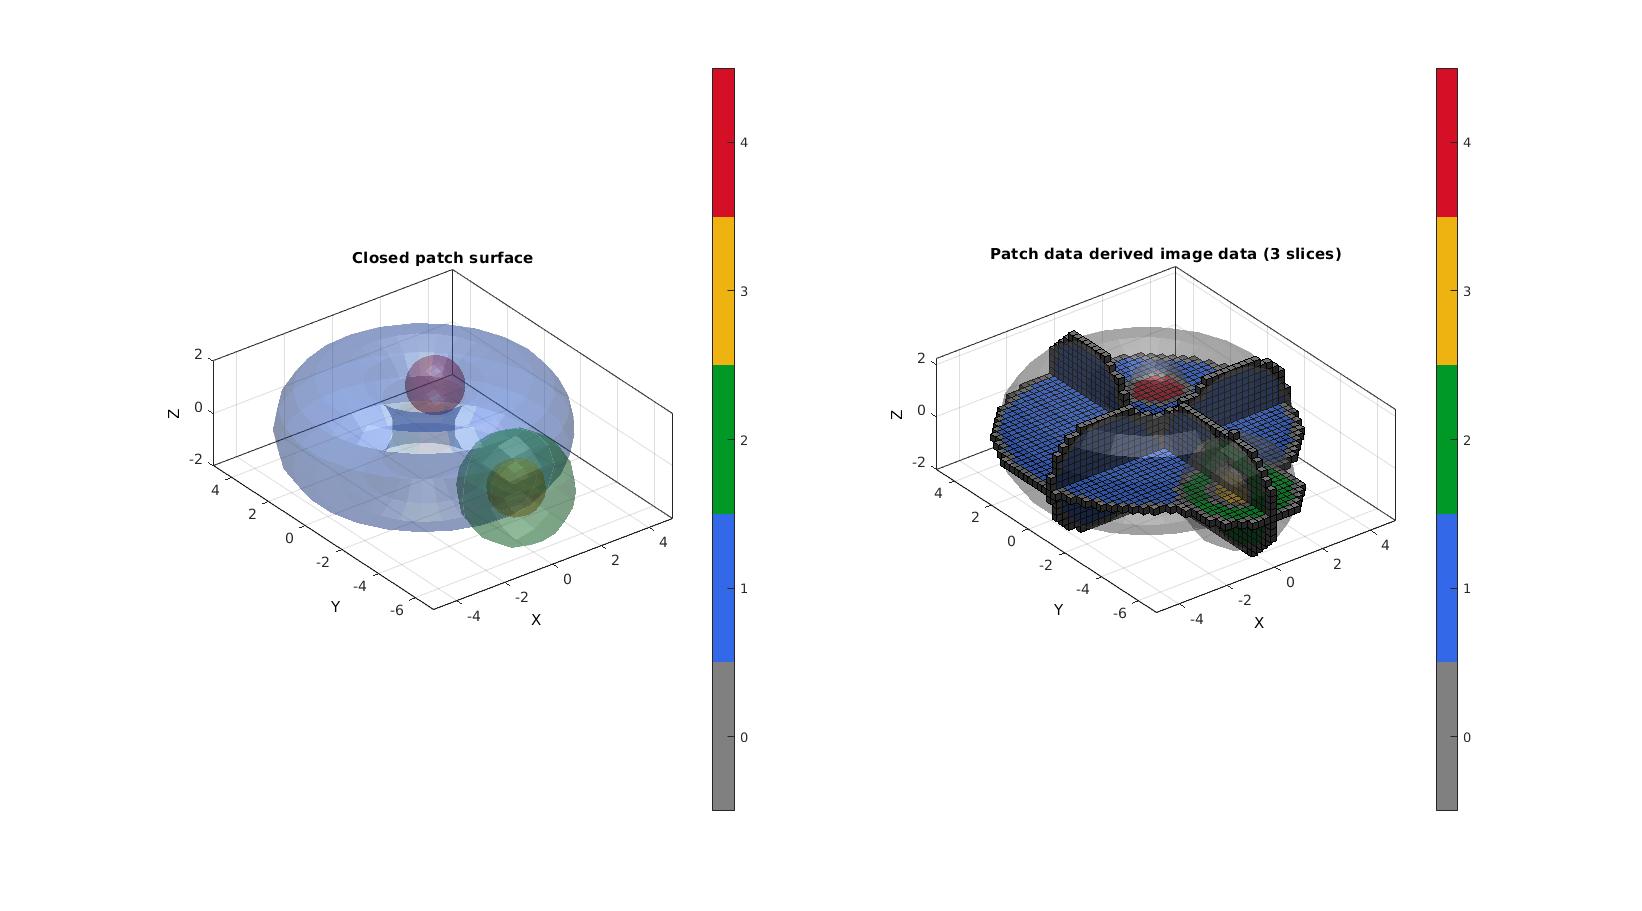
EXAMPLE 3: CONVERTING PATCH DATA WITH A MULTIPLE BOUNDARIES AND PATCH TYPES TO AN IMAGE
% Defining a multi boundary set

r=2; %Sphere radius
rc=3; %Central radius
nr=15;
nc=25;
ptype='quad';
[F1,V1]=patchTorus(r,nr,rc,nc,ptype);
[F2,V2]=quadSphere(2,r,2);
V2(:,2)=V2(:,2)-5;
[F3,V3]=quadSphere(2,r/2,2);
V3(:,2)=V3(:,2)-5;
[F4,V4]=quadSphere(3,r/2,2);
V4(:,1)=V4(:,1)+2;
V4(:,2)=V4(:,2)+2;

[F,V,C]=joinElementSets({F1,F2,F3,F4},{V1,V2,V3,V4});
% Defining the full set of possible control parameters
voxelSize=r/8; % The output image voxel size.
imOrigin=min(V,[],1)-voxelSize;
imMax=max(V,[],1)+voxelSize;
imSiz=round((imMax-imOrigin)/voxelSize);
imSiz=imSiz([2 1 3]); %Image size (x, y corresponds to j,i in image coordinates, hence the permutation)

% Using |patch2Im| function to convert patch data to image data
[M]=patch2Im(F,V,C,voxelSize,imOrigin,imSiz);
Plotting the results
L_plot=false(size(M));
L_plot(:,:,round(size(M,3)/2))=1;
L_plot(round(size(M,1)/2),:,:)=1;
L_plot(:,round(size(M,2)/2),:)=1;
L_plot=L_plot & ~isnan(M);
[Fm,Vm,Cm]=im2patch(M,L_plot,'v');
[Vm(:,1),Vm(:,2),Vm(:,3)]=im2cart(Vm(:,2),Vm(:,1),Vm(:,3),voxelSize*ones(1,3));
Vm=Vm+imOrigin(ones(size(Vm,1),1),:);

cFigure;
subplot(1,2,1); hold on;
title('Closed patch surface','FontSize',fontSize);

gpatch(F,V,C,'none',faceAlpha2);

camlight('headlight');
axisGeom(gca,fontSize);
colormap(gca,cMap); icolorbar([0 4]);

subplot(1,2,2); hold on;
title('Patch data derived image data (3 slices)','FontSize',fontSize);

gpatch(F,V,'kw','none',faceAlpha2);
gpatch(Fm,Vm,Cm,'k',faceAlpha1);

camlight('headlight');
axisGeom(gca,fontSize);
colormap(gca,cMap); icolorbar([0 4]);
drawnow;
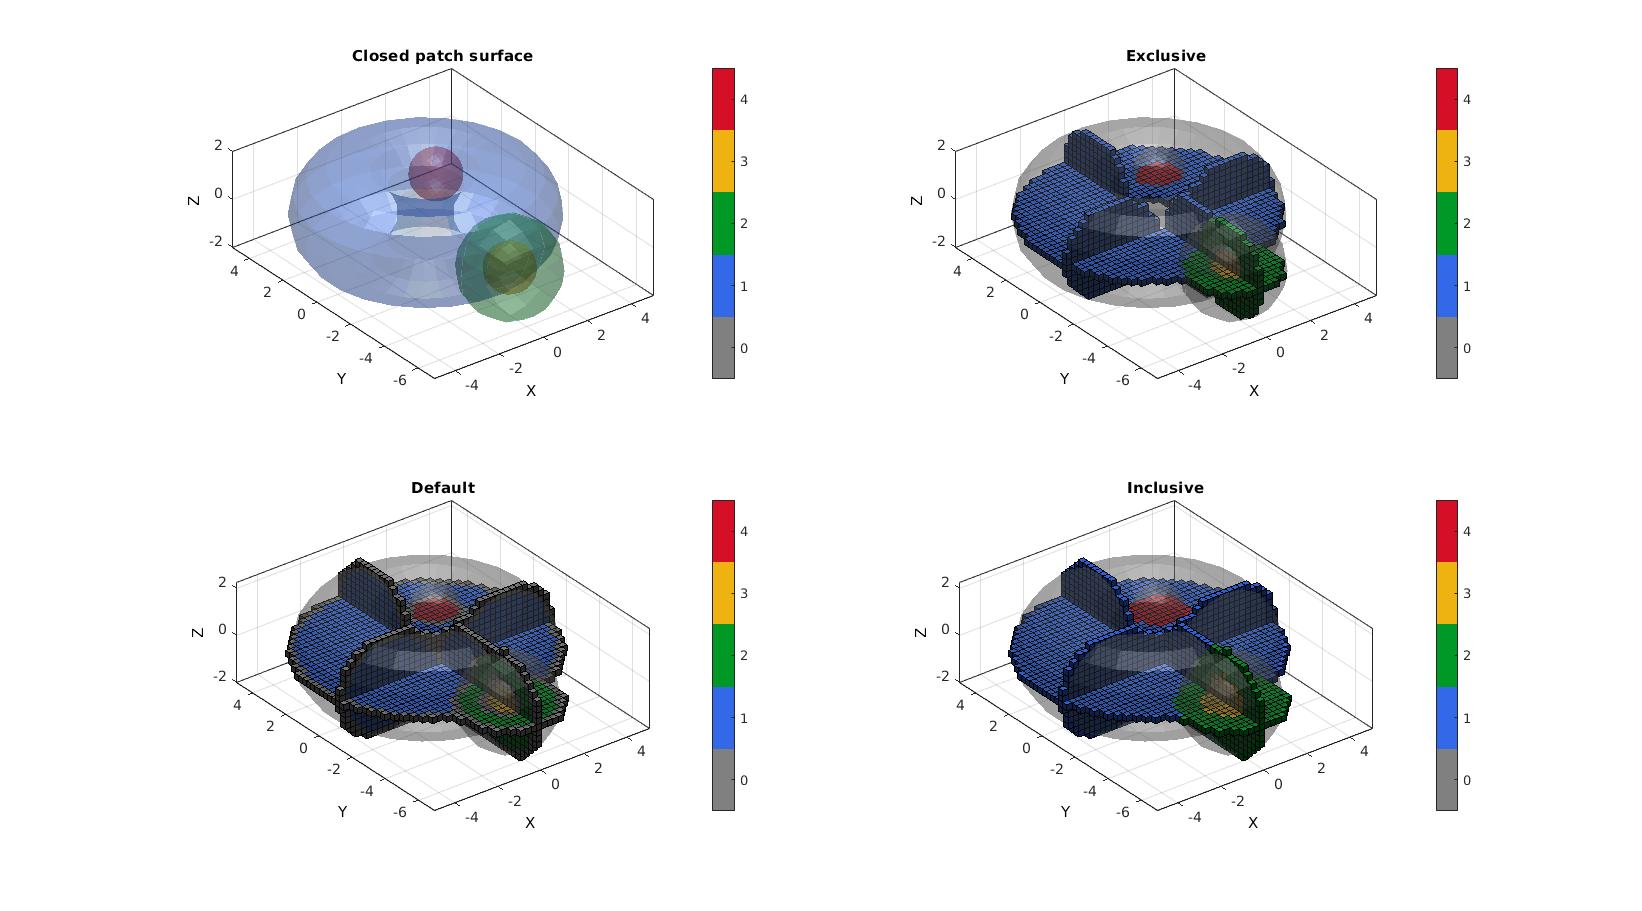
EXAMPLE 4: Special treatment of boundary voxels
% Defining a multi boundary set

r=2; %Sphere radius
rc=3; %Central radius
nr=15;
nc=25;
ptype='quad';
[F1,V1]=patchTorus(r,nr,rc,nc,ptype);
[F2,V2]=quadSphere(2,r,2);
V2(:,2)=V2(:,2)-5;
[F3,V3]=quadSphere(2,r/2,2);
V3(:,2)=V3(:,2)-5;
[F4,V4]=quadSphere(3,r/2,2);
V4(:,1)=V4(:,1)+2;
V4(:,2)=V4(:,2)+2;

[F,V,C]=joinElementSets({F1,F2,F3,F4},{V1,V2,V3,V4});
% Defining the full set of possible control parameters
voxelSize=r/8; % The output image voxel size.
imOrigin=min(V,[],1)-voxelSize;
imMax=max(V,[],1)+voxelSize;
imSiz=round((imMax-imOrigin)/voxelSize);
imSiz=imSiz([2 1 3]); %Image size (x, y corresponds to j,i in image coordinates, hence the permutation)
Plotting the results
cFigure;
subplot(2,2,1); hold on;
title('Closed patch surface','FontSize',fontSize);

gpatch(F,V,C,'none',faceAlpha2);

camlight('headlight');
axisGeom(gca,fontSize);
colormap(gca,cMap); icolorbar([0 4]);

boundaryTypes=[-1 0 1];
titleString={'Exclusive','Default','Inclusive'};

for q=1:numel(boundaryTypes)
    % Using |patch2Im| function to convert patch data to image data
    [M]=patch2Im(F,V,C,voxelSize,imOrigin,imSiz,boundaryTypes(q));

    L_plot=false(size(M));
    L_plot(:,:,round(size(M,3)/2))=1;
    L_plot(round(size(M,1)/2),:,:)=1;
    L_plot(:,round(size(M,2)/2),:)=1;
    L_plot=L_plot & ~isnan(M);
    [Fm,Vm,Cm]=im2patch(M,L_plot,'v');
    [Vm(:,1),Vm(:,2),Vm(:,3)]=im2cart(Vm(:,2),Vm(:,1),Vm(:,3),voxelSize*ones(1,3));
    Vm=Vm+imOrigin(ones(size(Vm,1),1),:);

    subplot(2,2,q+1); hold on;
    title(titleString{q},'FontSize',fontSize);

    gpatch(F,V,'kw','none',faceAlpha2);
    gpatch(Fm,Vm,Cm,'k',faceAlpha1);

    camlight('headlight');
    axisGeom(gca,fontSize);
    colormap(gca,cMap); icolorbar([0 4]);
end
drawnow;

GIBBON www.gibboncode.org
Kevin Mattheus Moerman, [email protected]
GIBBON footer text
License: https://github.com/gibbonCode/GIBBON/blob/master/LICENSE
GIBBON: The Geometry and Image-based Bioengineering add-On. A toolbox for image segmentation, image-based modeling, meshing, and finite element analysis.
Copyright (C) 2006-2020 Kevin Mattheus Moerman
This program is free software: you can redistribute it and/or modify it under the terms of the GNU General Public License as published by the Free Software Foundation, either version 3 of the License, or (at your option) any later version.
This program is distributed in the hope that it will be useful, but WITHOUT ANY WARRANTY; without even the implied warranty of MERCHANTABILITY or FITNESS FOR A PARTICULAR PURPOSE. See the GNU General Public License for more details.
You should have received a copy of the GNU General Public License along with this program. If not, see http://www.gnu.org/licenses/.