logit
Below is a demonstration of the features of the logit function
Contents
clear; close all; clc;
Syntax
[y]=logit(x);
Description
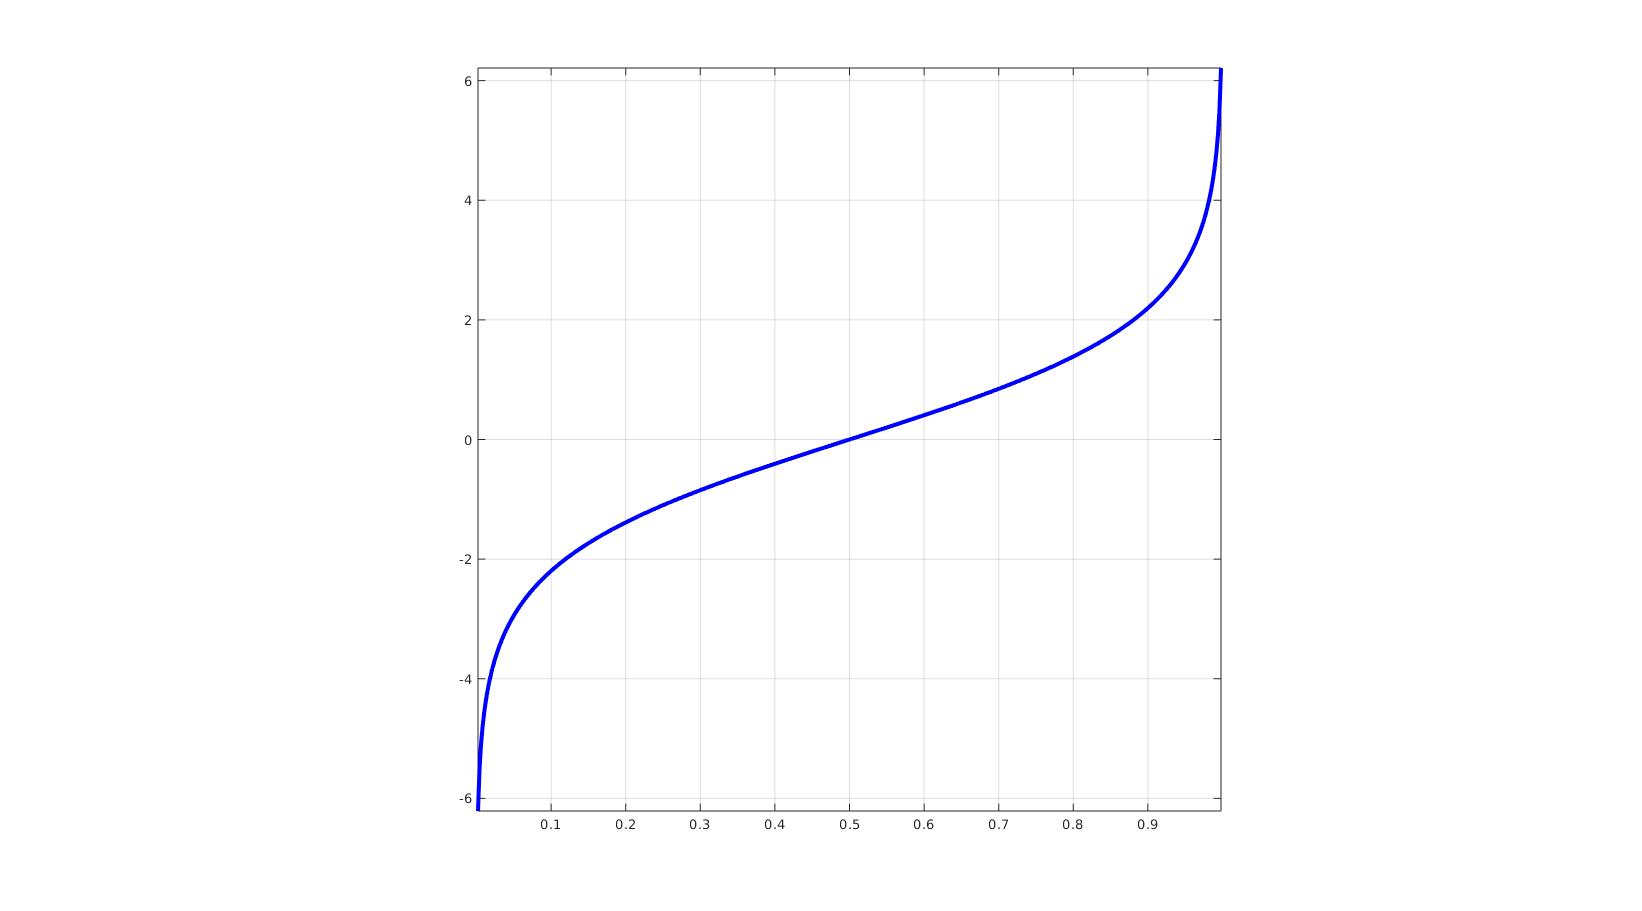
Inverse of the sigmoidal logistic function
Examples
n = 500; % Number of points
x = linspace(0,1,n);  % x range
y = logit(x); % Evaluate inverse of the signoidal logistic function
Visualize example graph
cFigure;
plot(x,y,'b-','LineWidth',3);
axis tight; axis square; grid on; box on;
drawnow;

GIBBON www.gibboncode.org
Kevin Mattheus Moerman, [email protected]
GIBBON footer text
License: https://github.com/gibbonCode/GIBBON/blob/master/LICENSE
GIBBON: The Geometry and Image-based Bioengineering add-On. A toolbox for image segmentation, image-based modeling, meshing, and finite element analysis.
Copyright (C) 2006-2023 Kevin Mattheus Moerman and the GIBBON contributors
This program is free software: you can redistribute it and/or modify it under the terms of the GNU General Public License as published by the Free Software Foundation, either version 3 of the License, or (at your option) any later version.
This program is distributed in the hope that it will be useful, but WITHOUT ANY WARRANTY; without even the implied warranty of MERCHANTABILITY or FITNESS FOR A PARTICULAR PURPOSE. See the GNU General Public License for more details.
You should have received a copy of the GNU General Public License along with this program. If not, see http://www.gnu.org/licenses/.