joinElementSets
Below is a demonstration of the features of the joinElementSets function
Contents
clear; close all; clc;
Syntax
[FT,VT,CT]=joinElementSets(Fc,Vc,Cc);
Description
This function joins element data. The node sets, element descriptions, and color data, are joined together.
Examples
Plot settings
fontSize=10;
faceAlpha1=1;
faceAlpha2=0.3;
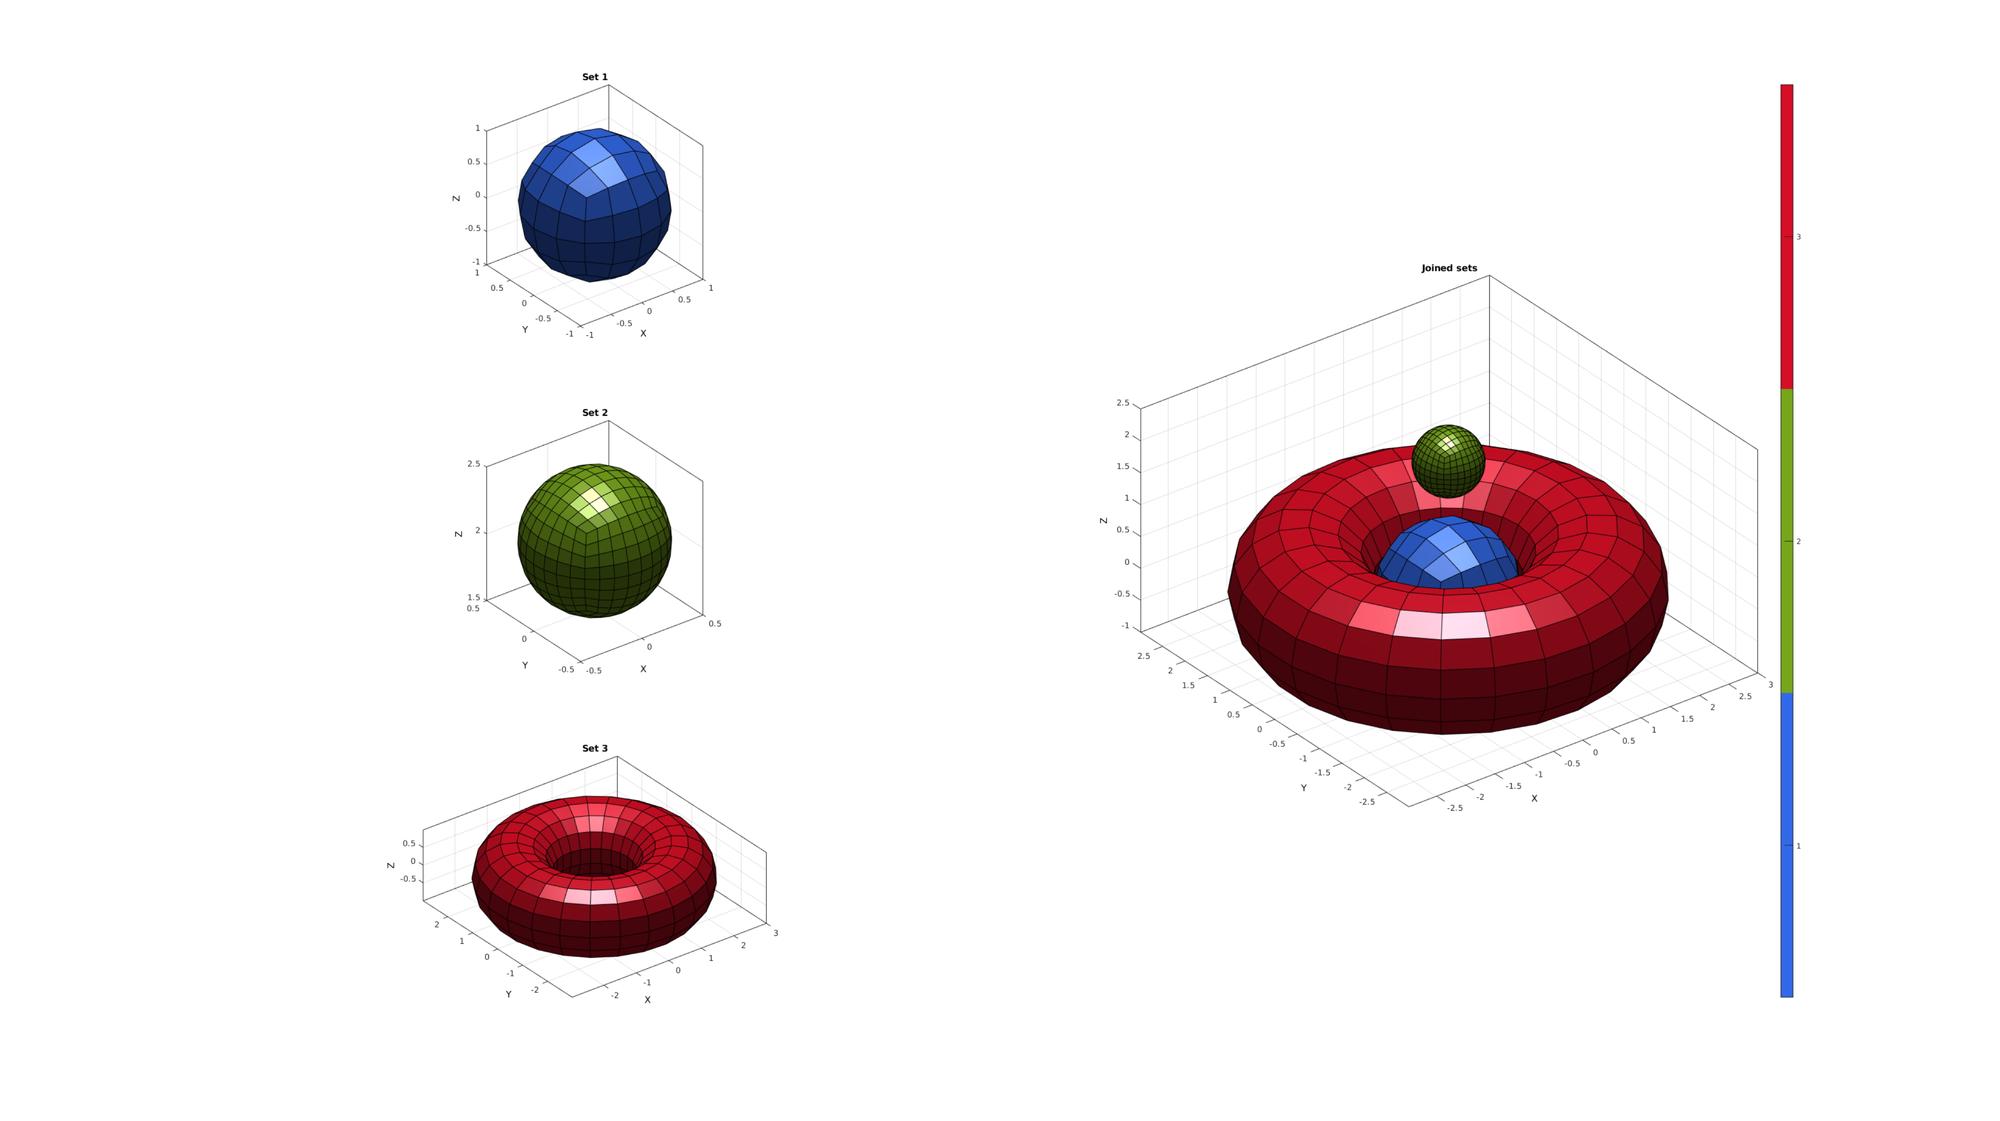
EXAMPLE 1: Joining sets of patch data of the same type
Defining an example triangulated surface model
% Defining a deformed and rotated torus shape
r=1; %Sphere radius
n=2;
[F1,V1]=quadSphere(n,r,2);
[F2,V2]=quadSphere(3,r/2,2);
V2(:,3)=V2(:,3)+2;

r=1; %Sphere radius
rc=2; %Central radius
nr=15;
nc=25;
ptype='quad';
[F3,V3]=patchTorus(r,nr,rc,nc,ptype);
Fc={F1,F2,F3};
Vc={V1,V2,V3};
[FT,VT,CT]=joinElementSets(Fc,Vc);
Plotting the results
cFigure;

p=[1 3 5];
for q=1:1:numel(Fc)
    subplot(3,2,p(q)); hold on;
    title(['Set ',num2str(q)],'FontSize',fontSize);
    gpatch(Fc{q},Vc{q},q*ones(size(Fc{q},1),1),'k',faceAlpha1);
    camlight('headlight');
    axisGeom(gca,fontSize);
    colormap(gjet(numel(Fc)));
    caxis([0.5 numel(Fc)+0.5]);
end

subplot(3,2,[2 4 6]); hold on;
title('Joined sets','FontSize',fontSize);
gpatch(FT,VT,CT,'k',faceAlpha1);
camlight('headlight');
axisGeom(gca,fontSize);
colormap(gjet(numel(Fc))); icolorbar;
drawnow;
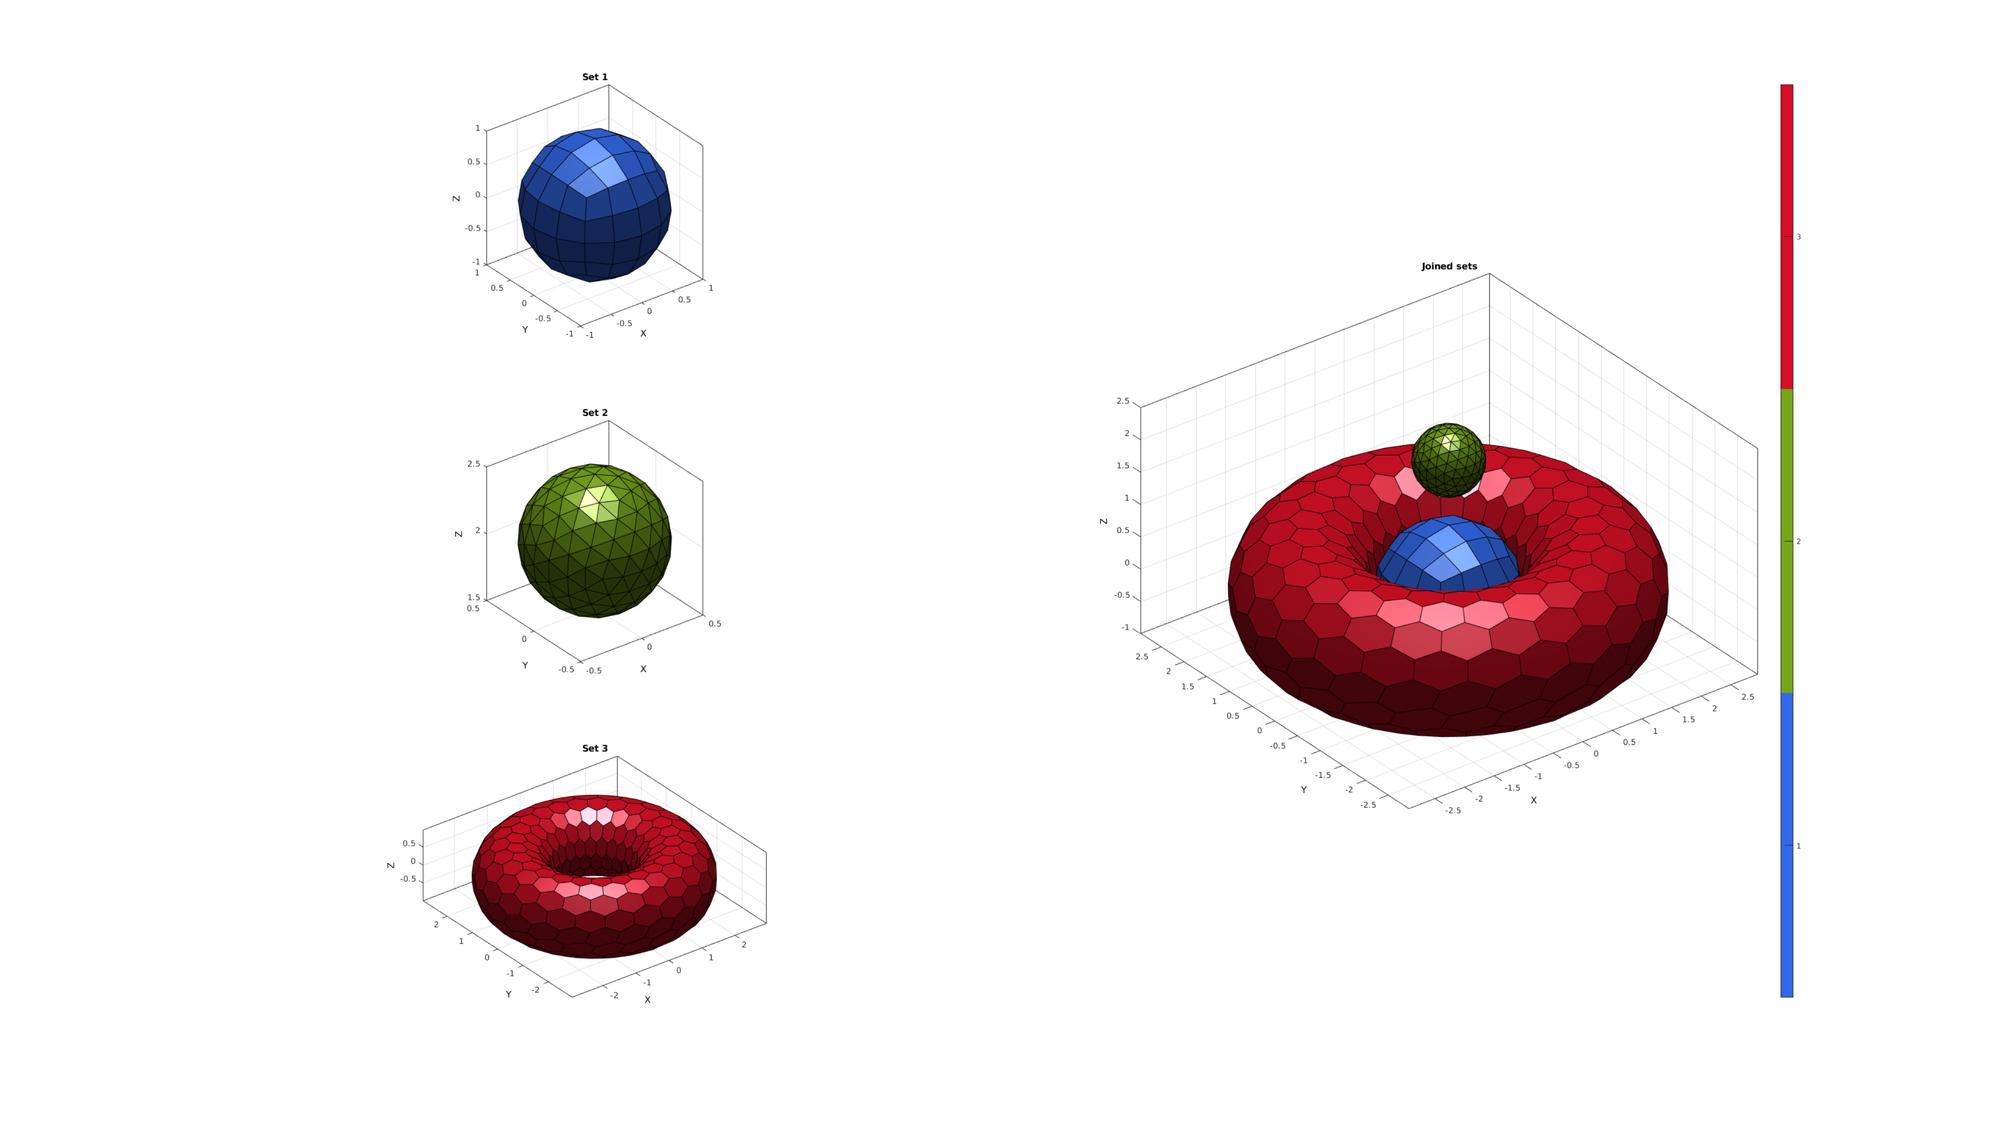
EXAMPLE 2: Joining sets of patch data of the different types
Defining an example triangulated surface model
% Defining a deformed and rotated torus shape
r=1; %Sphere radius
n=2;
[F1,V1]=quadSphere(n,r,2);
[F2,V2]=geoSphere(n,r/2);
V2(:,3)=V2(:,3)+2;

r=1; %Sphere radius
rc=2; %Central radius
nr=15;
nc=25;
ptype='honey';
[F3,V3]=patchTorus(r,nr,rc,nc,ptype);
Fc={F1,F2,F3};
Vc={V1,V2,V3};
[FT,VT,CT]=joinElementSets(Fc,Vc);
Plotting the results
cFigure;

p=[1 3 5];
for q=1:1:numel(Fc)
    subplot(3,2,p(q)); hold on;
    title(['Set ',num2str(q)],'FontSize',fontSize);
    gpatch(Fc{q},Vc{q},q*ones(size(Fc{q},1),1),'k',faceAlpha1);
    camlight('headlight');
    axisGeom(gca,fontSize);
    colormap(gjet(numel(Fc)));
    caxis([0.5 numel(Fc)+0.5]);
end

subplot(3,2,[2 4 6]); hold on;
title('Joined sets','FontSize',fontSize);
gpatch(FT,VT,CT,'k',faceAlpha1);
camlight('headlight');
axisGeom(gca,fontSize);
colormap(gjet(numel(Fc))); icolorbar;
drawnow;

GIBBON www.gibboncode.org
Kevin Mattheus Moerman, [email protected]
GIBBON footer text
License: https://github.com/gibbonCode/GIBBON/blob/master/LICENSE
GIBBON: The Geometry and Image-based Bioengineering add-On. A toolbox for image segmentation, image-based modeling, meshing, and finite element analysis.
Copyright (C) 2019 Kevin Mattheus Moerman
This program is free software: you can redistribute it and/or modify it under the terms of the GNU General Public License as published by the Free Software Foundation, either version 3 of the License, or (at your option) any later version.
This program is distributed in the hope that it will be useful, but WITHOUT ANY WARRANTY; without even the implied warranty of MERCHANTABILITY or FITNESS FOR A PARTICULAR PURPOSE. See the GNU General Public License for more details.
You should have received a copy of the GNU General Public License along with this program. If not, see http://www.gnu.org/licenses/.