icolorbar
Below is a demonstration of the features of the icolorbar function
Contents
clear; close all; clc;
Syntax
[varargout]=icolorbar(varargin);
Description
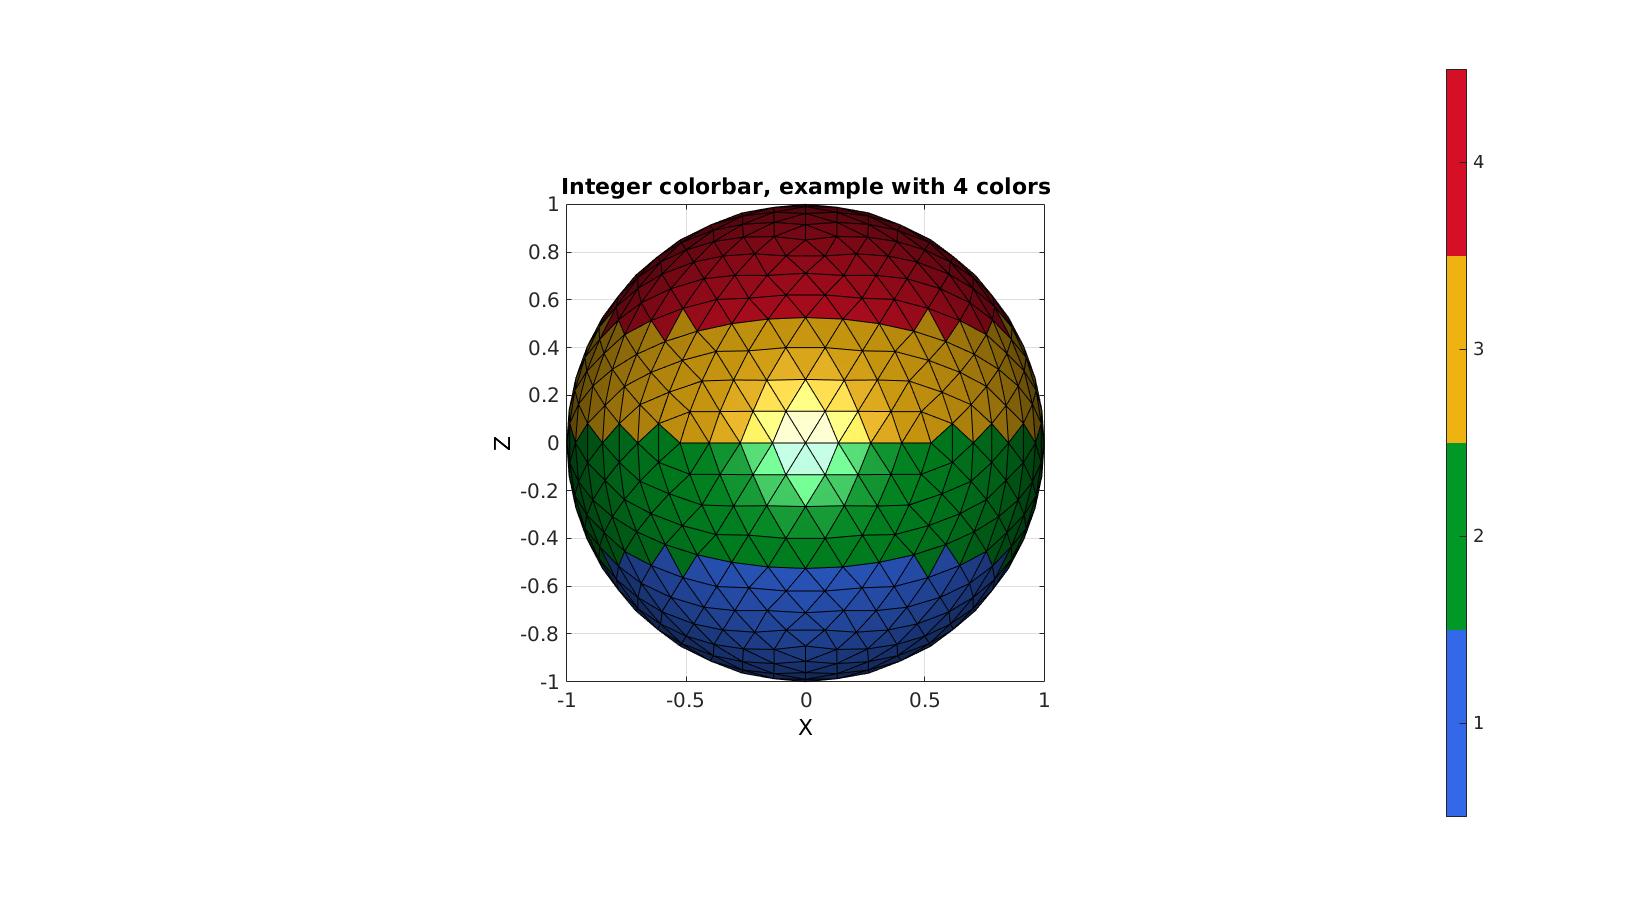
The icolorbar function adds an "integer colorbar" to the current axis. An interger colorbar has integer levels which and denotes at the center of the color bins.
Examples
Create example patch data
[F,V]=geoSphere(3,1); %Create patch data for a sphere

%Create color data
X=patchCentre(F,V);
C=ones(size(F,1),1); %1 for the bottom
C(X(:,3)>-0.5)=2; %2 for the next level
C(X(:,3)>0)=3; %3 for the next level
C(X(:,3)>0.5)=4; %4 for the next level
Visualize patch data with integer color data
cFigure;
title('Integer colorbar, example with 4 colors')
gpatch(F,V,C);
axisGeom;
colormap(gjet(4));
view([0,0]);
camlight headlight;
icolorbar;
drawnow;

GIBBON www.gibboncode.org
Kevin Mattheus Moerman, [email protected]
GIBBON footer text
License: https://github.com/gibbonCode/GIBBON/blob/master/LICENSE
GIBBON: The Geometry and Image-based Bioengineering add-On. A toolbox for image segmentation, image-based modeling, meshing, and finite element analysis.
Copyright (C) 2019 Kevin Mattheus Moerman
This program is free software: you can redistribute it and/or modify it under the terms of the GNU General Public License as published by the Free Software Foundation, either version 3 of the License, or (at your option) any later version.
This program is distributed in the hope that it will be useful, but WITHOUT ANY WARRANTY; without even the implied warranty of MERCHANTABILITY or FITNESS FOR A PARTICULAR PURPOSE. See the GNU General Public License for more details.
You should have received a copy of the GNU General Public License along with this program. If not, see http://www.gnu.org/licenses/.