cunique
Below is a demonstration of the features of the cunique function
Contents
clear; close all; clc;
Syntax
[A_uni,ind1,ind2,Ac]=cunique(A);
Description
The imx function provides a figure window based GUI for 3D image segmentation
Examples
Plot settings
fontSize=20;
Example 1: Getting unique entries and occurance counts for 1xN arrays
n=15;
A=round(25*rand(1,n)); %Rounded random set in range 0-25
A(1)=A(end); %Force at least one double occurance for this example
A

%Get unique set and counts
[A_uni,ind1,ind2,Ac]=cunique(A)
A =

  Columns 1 through 13

     9    10    15     5    22    25    24     0    22    20    19    14    13

  Columns 14 through 15

     9     9


A_uni =

     0     5     9    10    13    14    15    19    20    22    24    25


ind1 =

     8     4     1     2    13    12     3    11    10     5     7     6


ind2 =

  Columns 1 through 13

     3     4     7     2    10    12    11     1    10     9     8     6     5

  Columns 14 through 15

     3     3


Ac =

  Columns 1 through 13

     3     1     1     1     2     1     1     1     2     1     1     1     1

  Columns 14 through 15

     3     3
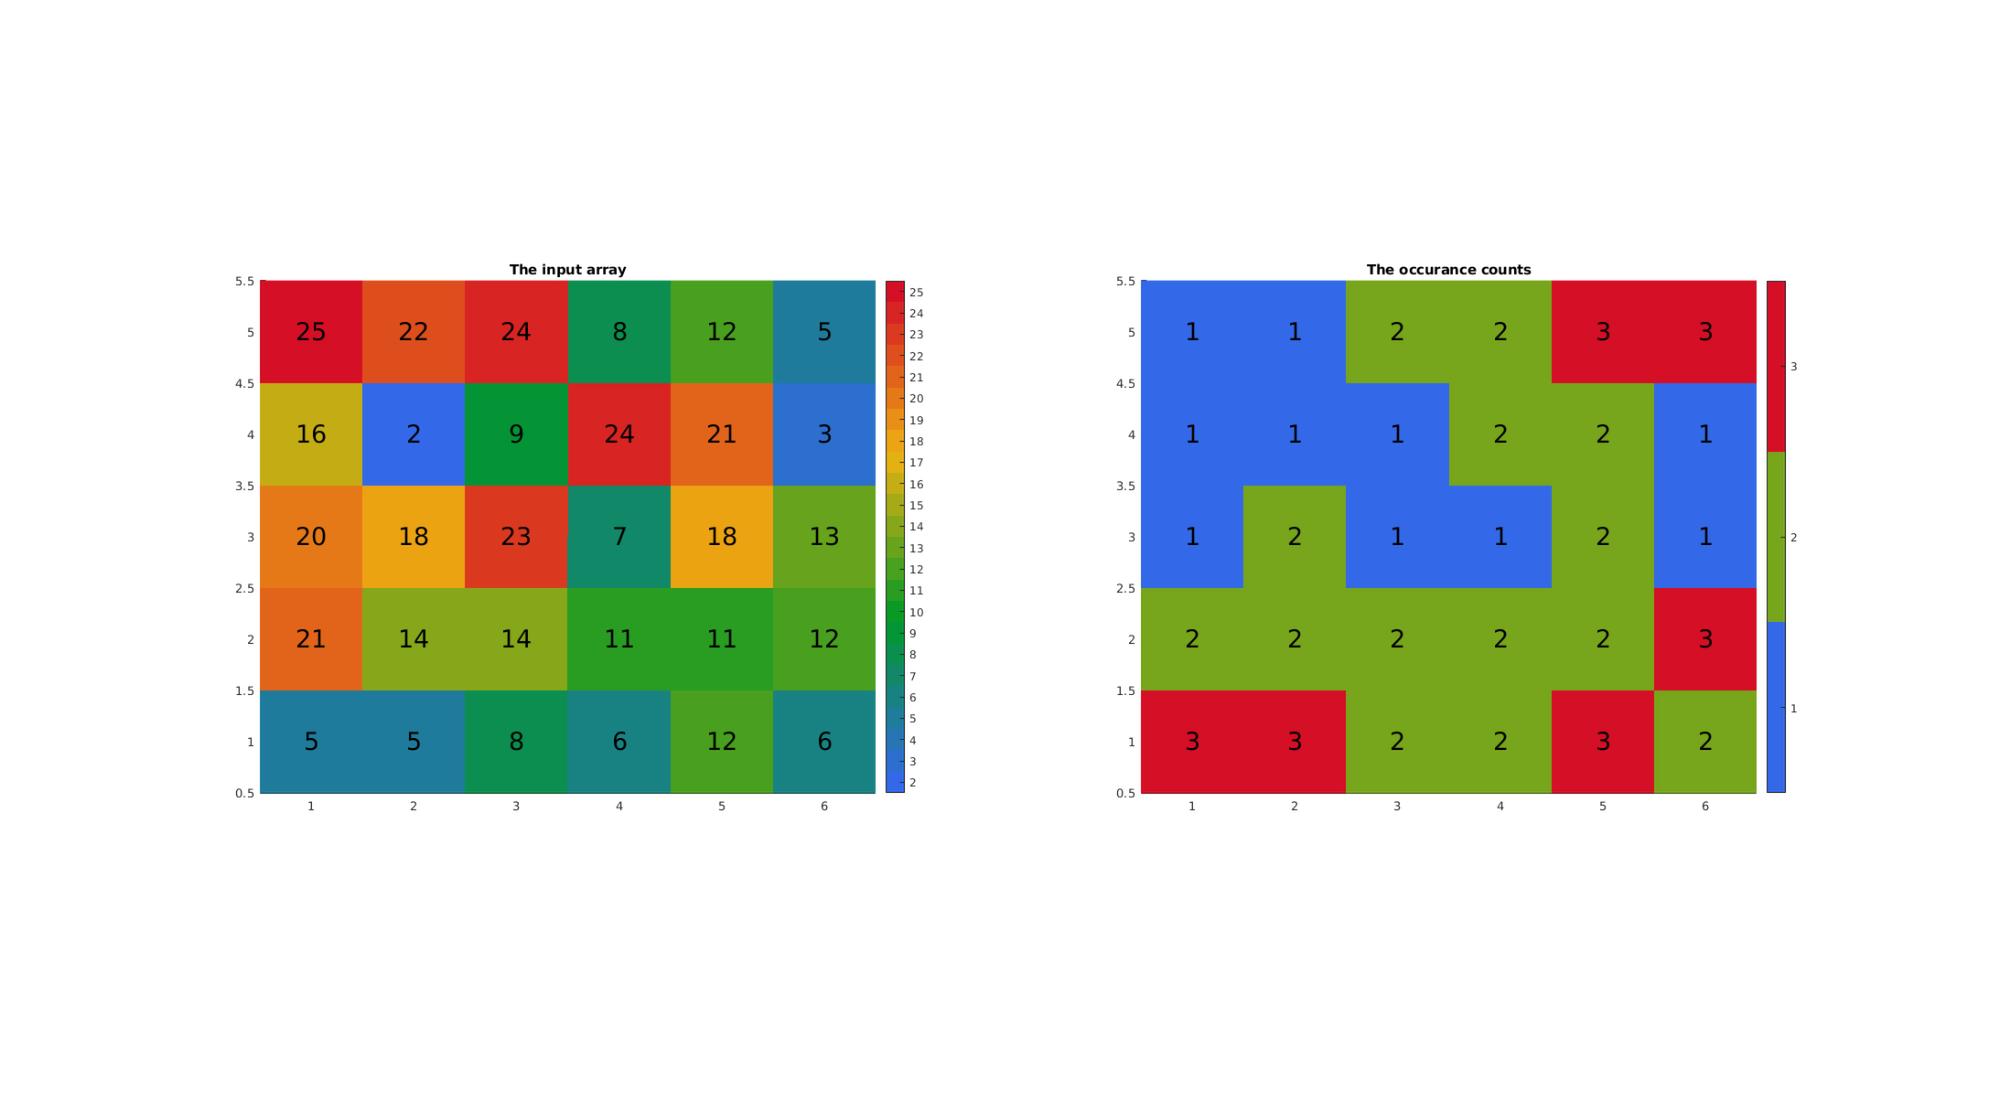
Example 2: Getting unique entries and occurance counts for NxM arrays
n=5;
m=6;
A=round(25*rand(n,m)); %Rounded random set in range 0-25
A(1)=A(end); %Force at least one double occurance for this example
A

%Get unique set and counts
[A_uni,ind1,ind2,Ac]=cunique(A)
A =

     5     5     8     6    12     6
    21    14    14    11    11    12
    20    18    23     7    18    13
    16     2     9    24    21     3
    25    22    24     8    12     5


A_uni =

     2
     3
     5
     6
     7
     8
     9
    11
    12
    13
    14
    16
    18
    20
    21
    22
    23
    24
    25


ind1 =

     9
    29
     1
    16
    18
    11
    14
    17
    21
    28
     7
     4
     8
     3
     2
    10
    13
    15
     5


ind2 =

     3     3     6     4     9     4
    15    11    11     8     8     9
    14    13    17     5    13    10
    12     1     7    18    15     2
    19    16    18     6     9     3


Ac =

     3     3     2     2     3     2
     2     2     2     2     2     3
     1     2     1     1     2     1
     1     1     1     2     2     1
     1     1     2     2     3     3
Visualizing input array and occurange counts
cFigure;
subplot(1,2,1);
title('The input array')
hold on;
imagesc(A);
image_numeric(A,[],0,fontSize);
axis tight; axis equal;
colormap(gca,gjet(max(A(:))));
icolorbar;

subplot(1,2,2);
title('The occurance counts')
hold on;
imagesc(Ac);
image_numeric(Ac,[],0,fontSize);
axis tight; axis equal;
colormap(gca,gjet(max(Ac(:))));
icolorbar;
drawnow;
Example 3: Getting unique entries and occurance counts for NxMx... arrays
n=3;
m=4;
l=2;

A=round(25*rand(n,m,l)); %Rounded random set in range 0-25
A(1)=A(end); %Force at least one double occurance for this example
A

%Get unique set and counts
[A_uni,ind1,ind2,Ac]=cunique(A)
A(:,:,1) =

     8    12    12     6
    22    19    18    22
     2    11    17    21


A(:,:,2) =

    24    14    16    15
     4    11    18    18
     2     2    15     8


A_uni =

     2
     4
     6
     8
    11
    12
    14
    15
    16
    17
    18
    19
    21
    22
    24


ind1 =

     3
    14
    10
     1
     6
     4
    16
    21
    19
     9
     8
     5
    12
     2
    13


ind2(:,:,1) =

     4     6     6     3
    14    12    11    14
     1     5    10    13


ind2(:,:,2) =

    15     7     9     8
     2     5    11    11
     1     1     8     4


Ac(:,:,1) =

     2     2     2     1
     2     1     3     2
     3     2     1     1


Ac(:,:,2) =

     1     1     1     2
     1     2     3     3
     3     3     2     2
Example 4: Using 'rows' option
n=5;
m=3;

A=round(25*rand(n,m)); %Rounded random set in range 0-25
A(1,:)=A(end,:); %Force at least one double row for this example
A

%Get unique set and counts
[A_uni,ind1,ind2,Ac]=cunique(A,'rows')
A =

    12    15    19
     6    18     4
    23    21    17
    21    25    21
    12    15    19


A_uni =

     6    18     4
    12    15    19
    21    25    21
    23    21    17


ind1 =

     2
     1
     4
     3


ind2 =

     2
     1
     4
     3
     2


Ac =

     2
     1
     1
     1
     2

GIBBON www.gibboncode.org
Kevin Mattheus Moerman, [email protected]
GIBBON footer text
License: https://github.com/gibbonCode/GIBBON/blob/master/LICENSE
GIBBON: The Geometry and Image-based Bioengineering add-On. A toolbox for image segmentation, image-based modeling, meshing, and finite element analysis.
Copyright (C) 2006-2022 Kevin Mattheus Moerman and the GIBBON contributors
This program is free software: you can redistribute it and/or modify it under the terms of the GNU General Public License as published by the Free Software Foundation, either version 3 of the License, or (at your option) any later version.
This program is distributed in the hope that it will be useful, but WITHOUT ANY WARRANTY; without even the implied warranty of MERCHANTABILITY or FITNESS FOR A PARTICULAR PURPOSE. See the GNU General Public License for more details.
You should have received a copy of the GNU General Public License along with this program. If not, see http://www.gnu.org/licenses/.