boxconstrain
Below is a demonstration of the features of the boxconstrain function
Contents
Syntax
[xb]=boxconstrain(x,lb,ub,m,s);
Description
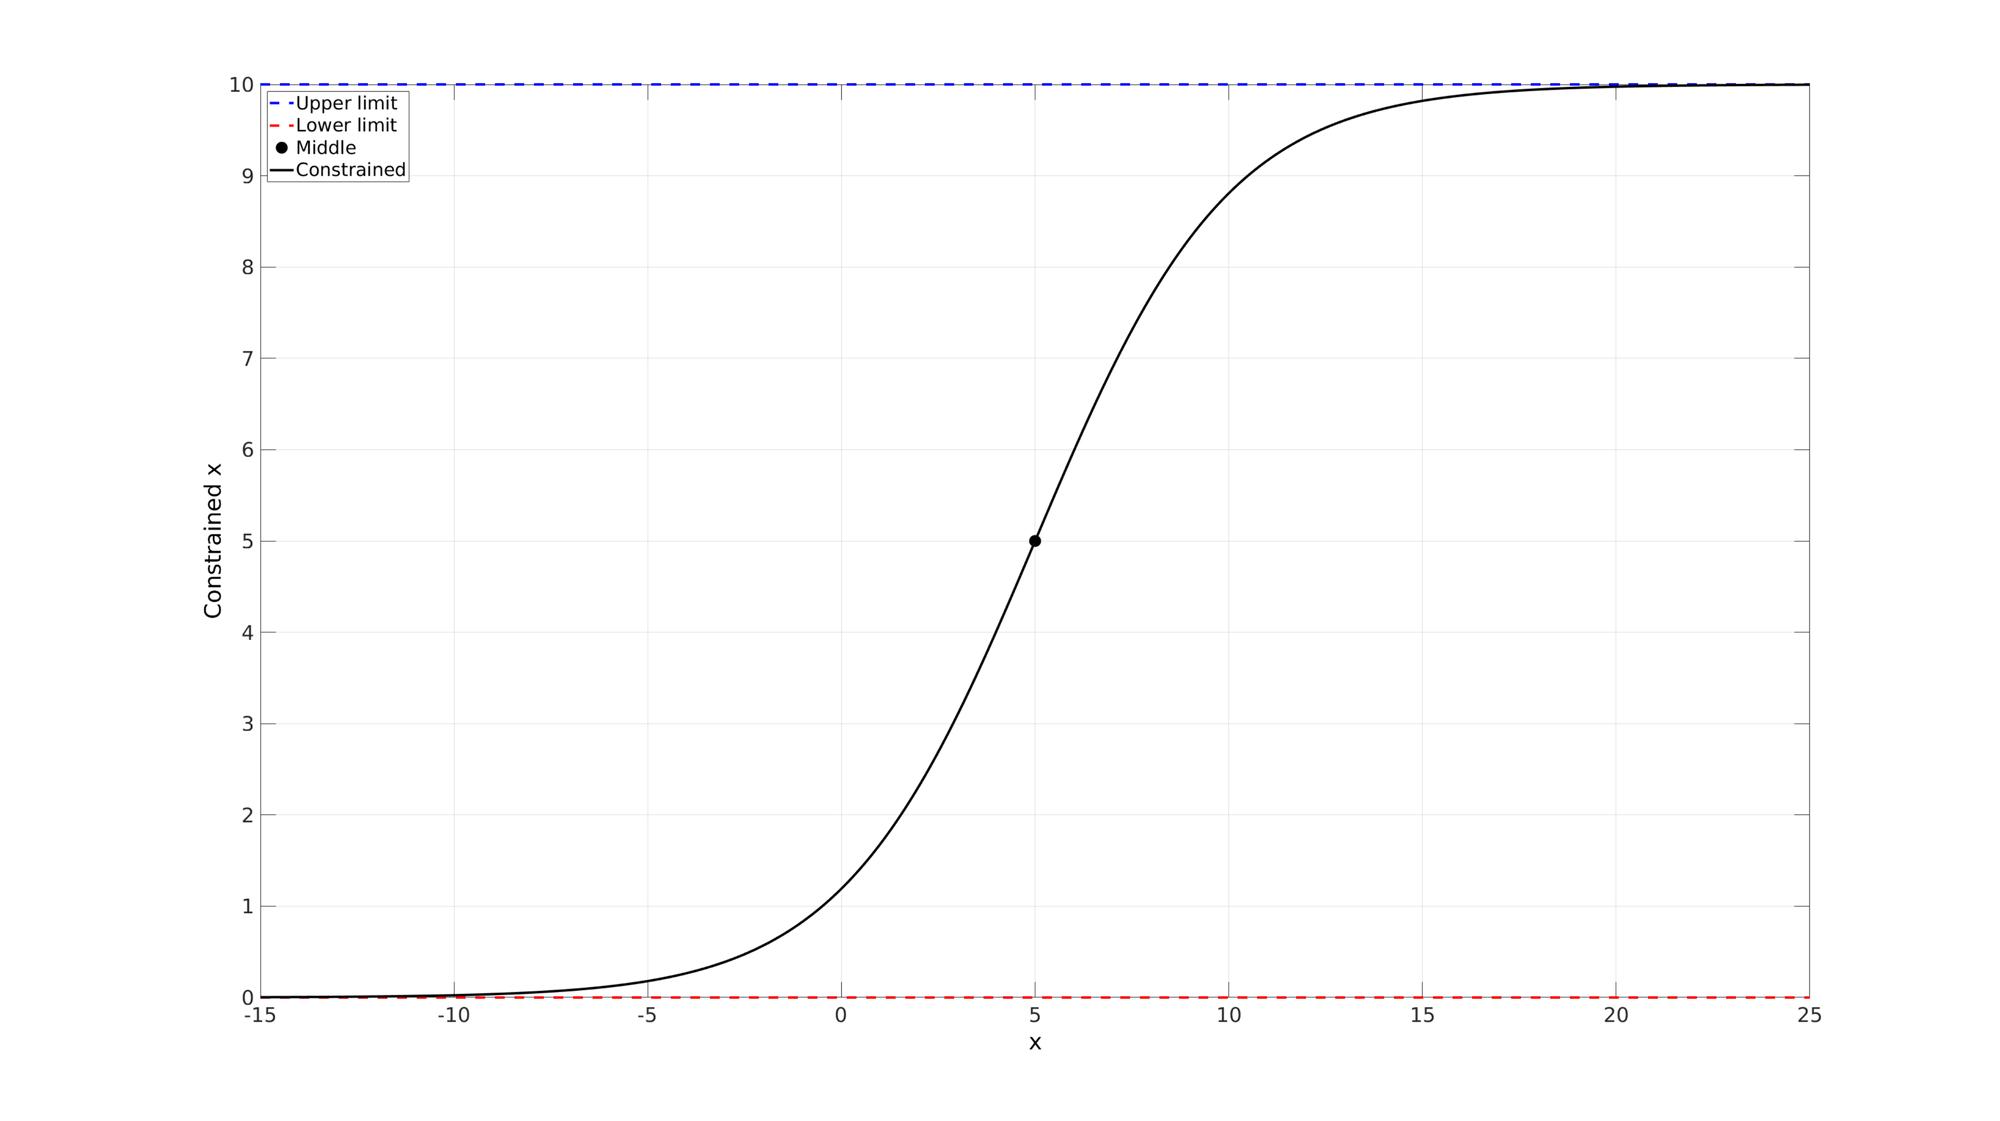
The boxconstrain function can be used to constrain parameters from [-inf,inf] to the range [lb ub]. The sigmoidal tanh function is used to do this mapping. The middle of the sigmoid, denoted by the parameter m need not be (lb+ub)/2. If x=m xb=m. The optional parameter s sets the slope of the sigmoid at x=m, the default slope is 1.
Examples
clear; close all; clc;
Example: Constraining parameters
m=5; %The middle
lb=0; %The lower bound
ub=10; %The upper bound
x=linspace(m-20,m+20,1000); % x paremeters for plotting
[y]=boxconstrain(x,lb,ub,m);
cFigure; hold on;
xlabel('x'); ylabel('Constrained x');
h1=plot([min(x) max(x)],[ub ub],'b--','LineWidth',3);
h2=plot([min(x) max(x)],[lb lb],'r--','LineWidth',3);
h3=plot(m,m,'k.','MarkerSize',50);
h4=plot(x,y,'k-','MarkerSize',25,'LineWidth',3);

legend([h1;h2;h3;h4],{'Upper limit','Lower limit','Middle','Constrained'},'Location','Northwest');

axis tight;
set(gca,'FontSize',25);
grid on; box on;
drawnow;
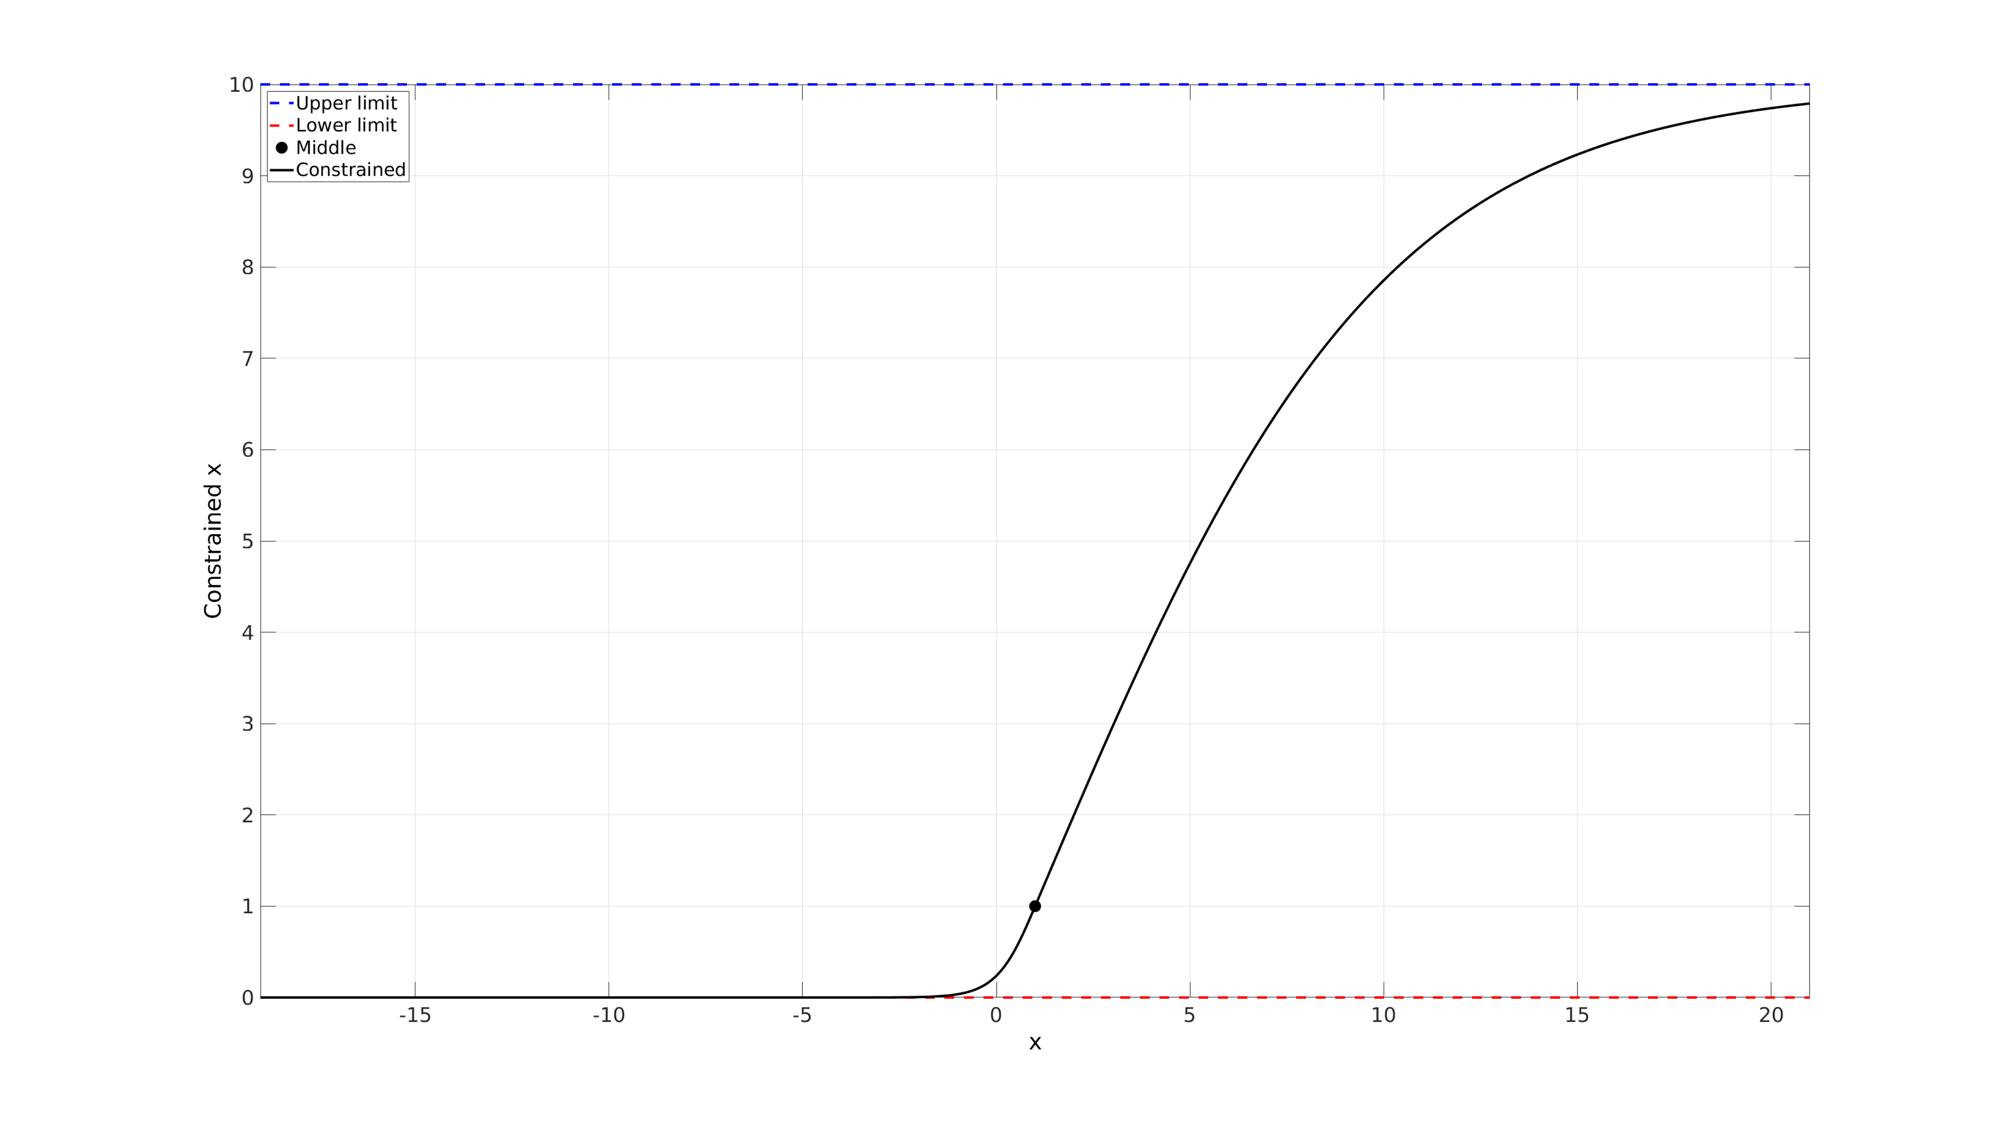
Example: Assymetric mappings
m=1; %The middle
lb=0; %The lower bound
ub=10; %The upper bound

x=linspace(m-20,m+20,1000); % x paremeters for plotting

[y]=boxconstrain(x,lb,ub,m);
cFigure; hold on;
xlabel('x'); ylabel('Constrained x');
h1=plot([min(x) max(x)],[ub ub],'b--','LineWidth',3);
h2=plot([min(x) max(x)],[lb lb],'r--','LineWidth',3);
h3=plot(m,m,'k.','MarkerSize',50);
h4=plot(x,y,'k-','MarkerSize',25,'LineWidth',3);

legend([h1;h2;h3;h4],{'Upper limit','Lower limit','Middle','Constrained'},'Location','Northwest');

axis tight;
set(gca,'FontSize',25);
grid on; box on;
drawnow;
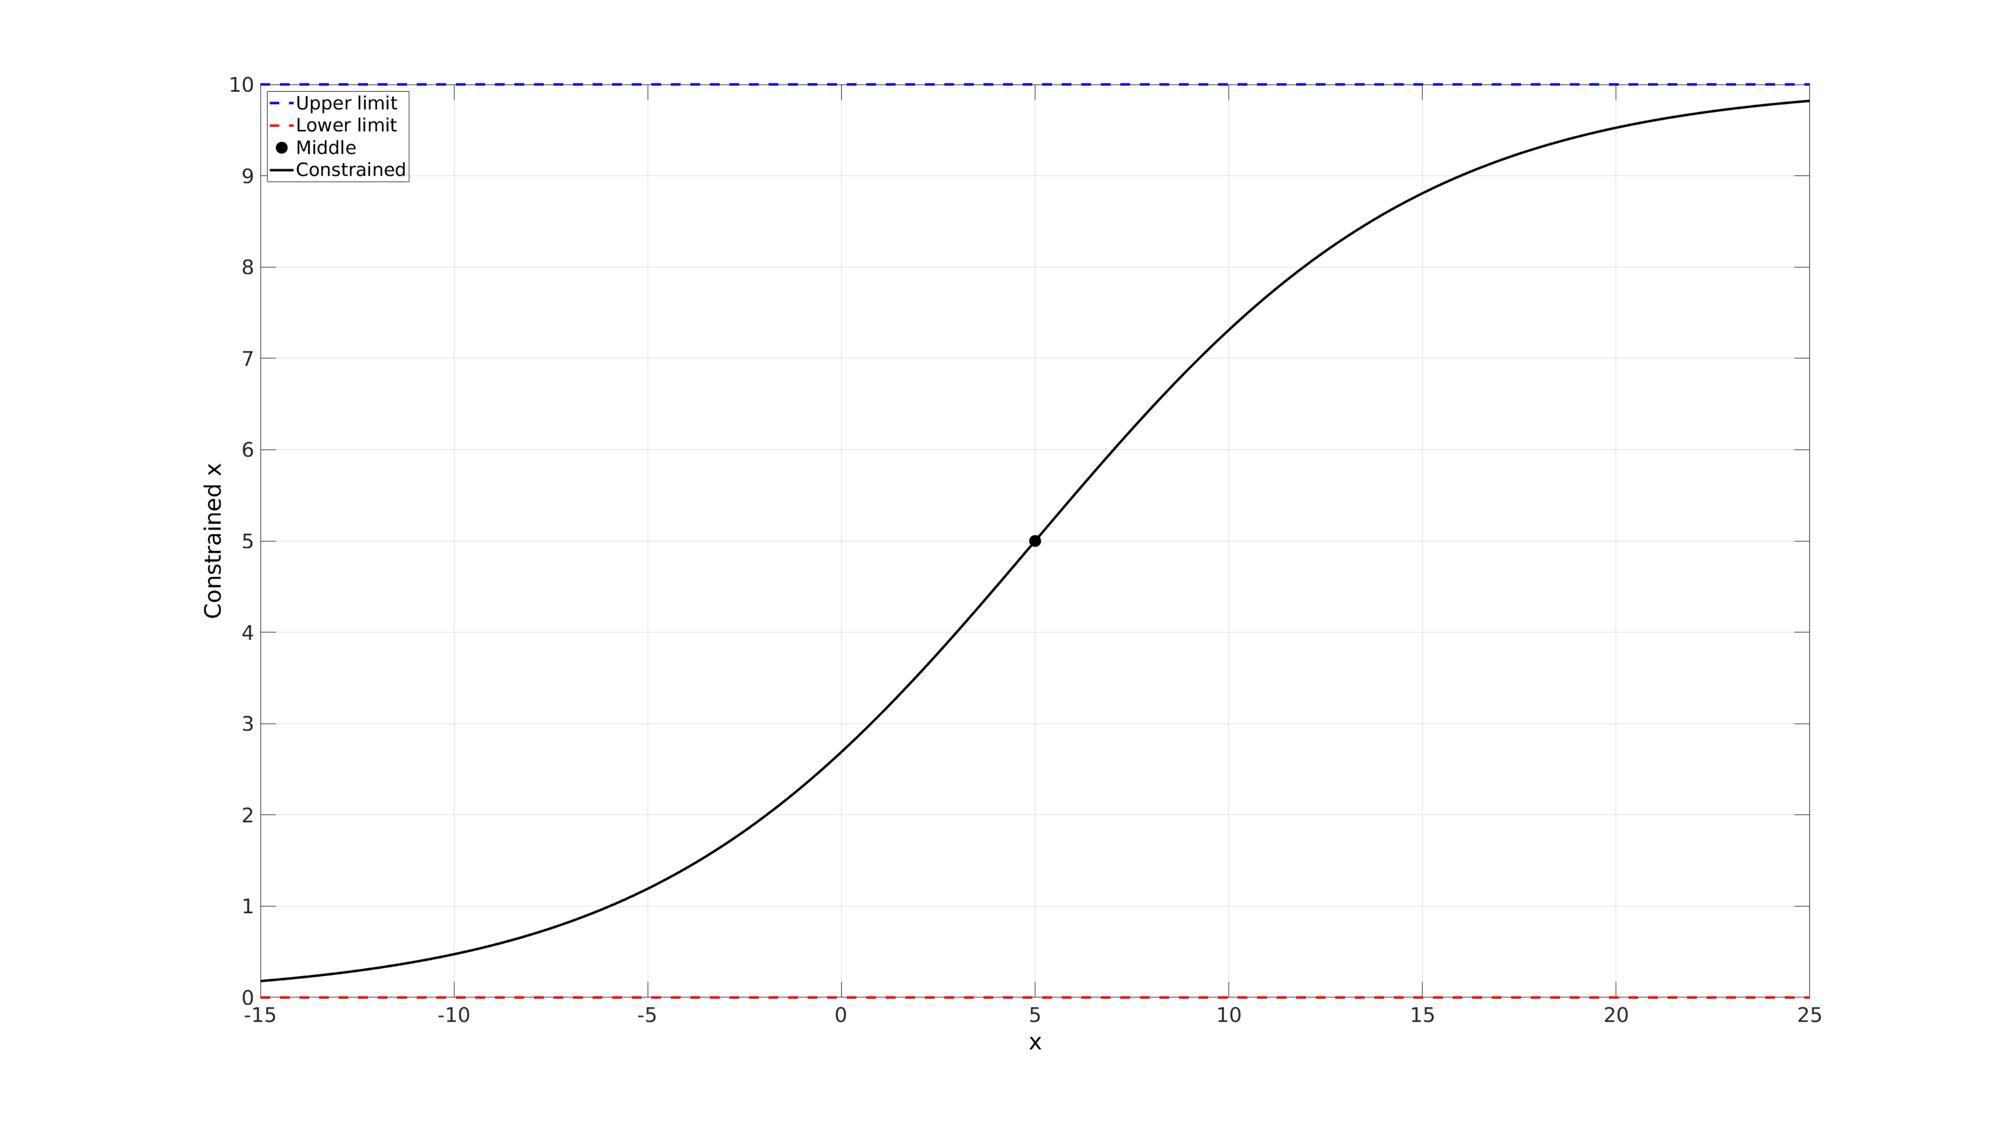
Example: Custom slop
m=5; %The middle
lb=0; %The lower bound
ub=10; %The upper bound
s=0.5; %Slope at the middle

x=linspace(m-20,m+20,1000); % x paremeters for plotting

[y]=boxconstrain(x,lb,ub,m,s);
cFigure; hold on;
xlabel('x'); ylabel('Constrained x');
h1=plot([min(x) max(x)],[ub ub],'b--','LineWidth',3);
h2=plot([min(x) max(x)],[lb lb],'r--','LineWidth',3);
h3=plot(m,m,'k.','MarkerSize',50);
h4=plot(x,y,'k-','MarkerSize',25,'LineWidth',3);

legend([h1;h2;h3;h4],{'Upper limit','Lower limit','Middle','Constrained'},'Location','Northwest');

axis tight;
set(gca,'FontSize',25);
grid on; box on;
drawnow;

GIBBON www.gibboncode.org
Kevin Mattheus Moerman, [email protected]
GIBBON footer text
License: https://github.com/gibbonCode/GIBBON/blob/master/LICENSE
GIBBON: The Geometry and Image-based Bioengineering add-On. A toolbox for image segmentation, image-based modeling, meshing, and finite element analysis.
Copyright (C) 2019 Kevin Mattheus Moerman
This program is free software: you can redistribute it and/or modify it under the terms of the GNU General Public License as published by the Free Software Foundation, either version 3 of the License, or (at your option) any later version.
This program is distributed in the hope that it will be useful, but WITHOUT ANY WARRANTY; without even the implied warranty of MERCHANTABILITY or FITNESS FOR A PARTICULAR PURPOSE. See the GNU General Public License for more details.
You should have received a copy of the GNU General Public License along with this program. If not, see http://www.gnu.org/licenses/.