batman
Below is a demonstration of the features of the batman function
Contents
Syntax
[x,y]=batman(n); [V]=batman(n);
Description
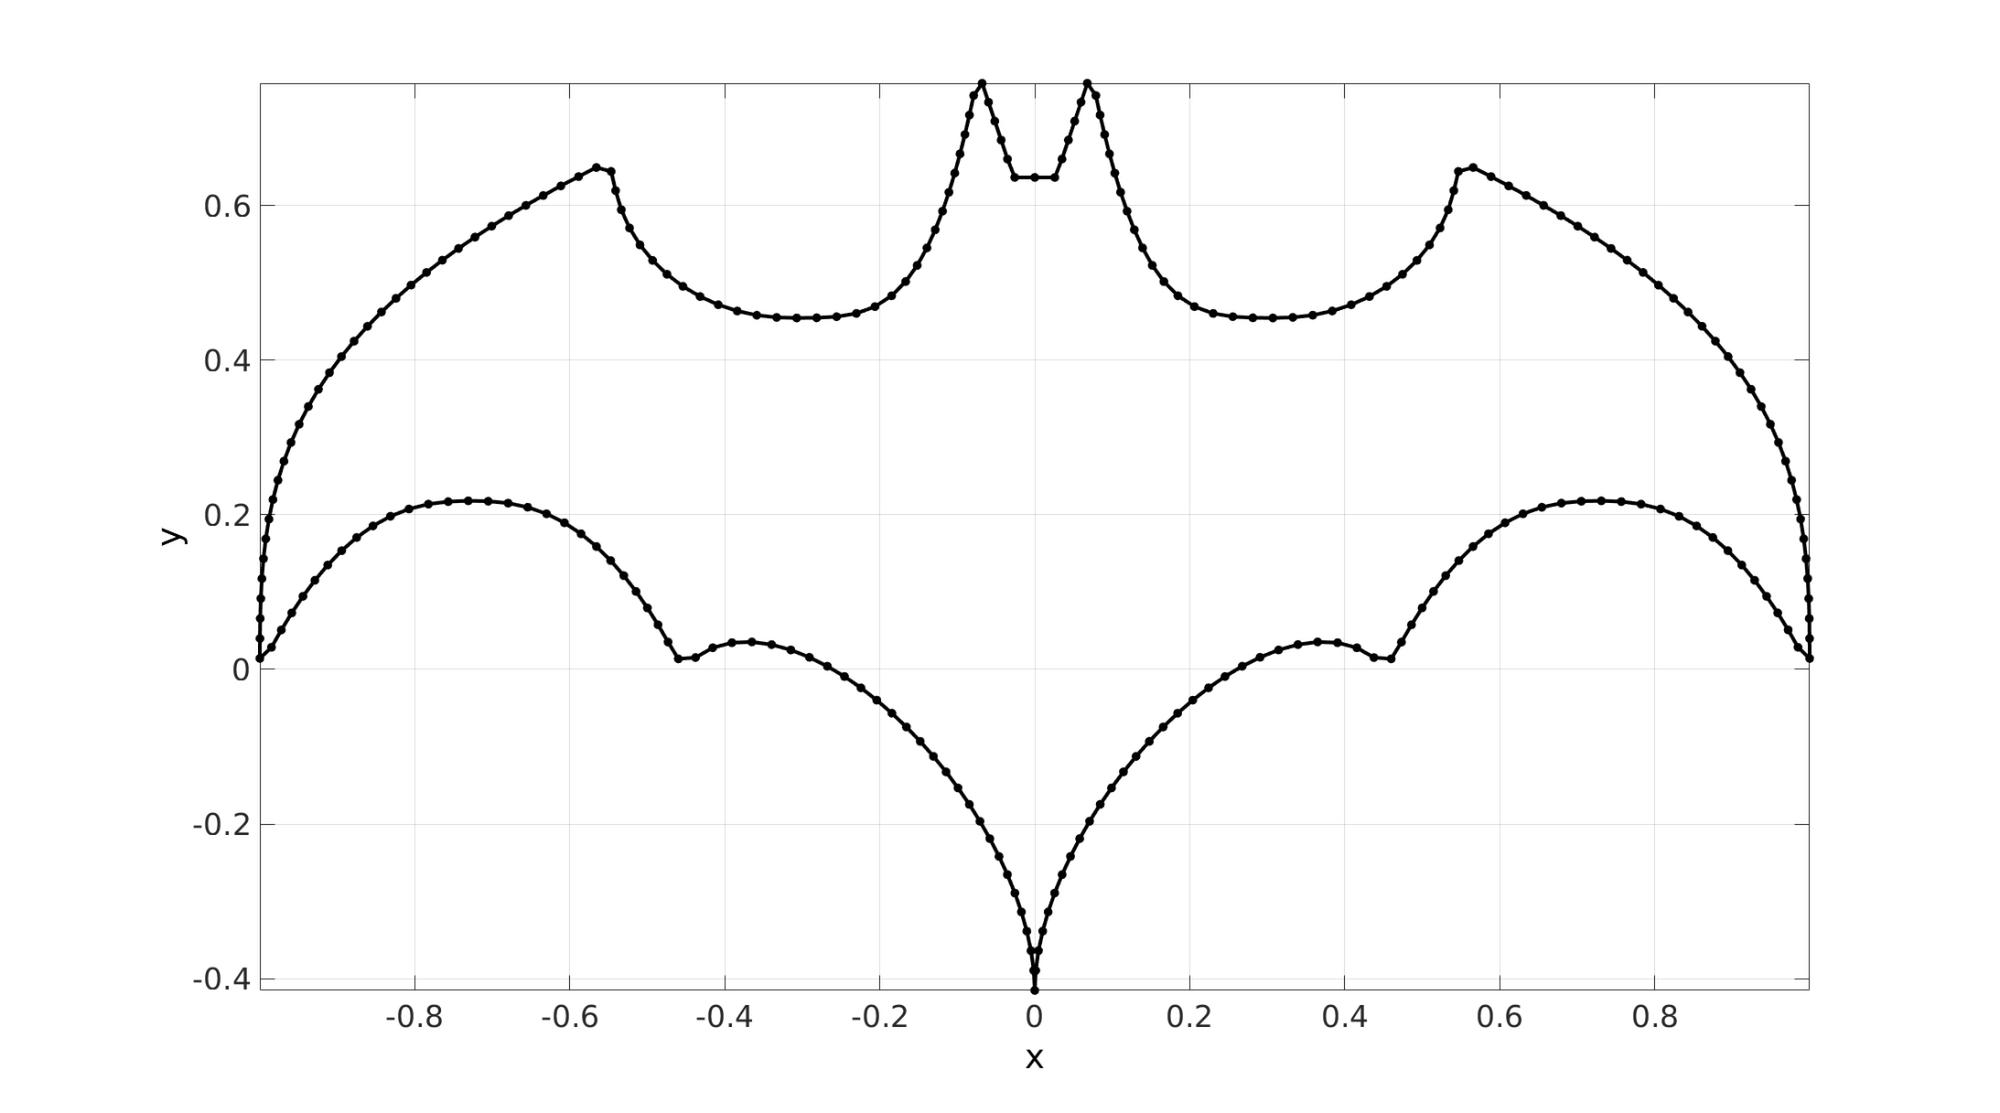
The batman function implements a particular version of the so called batmat-equation, a curve defining the batman logo. The input for this function is the number of desired points n. The user may request a sigle nx2 output array or two nx1 arrays (x and y coordinates).
Examples
clear; close all; clc;
Example 1:
n=250; %Number of points on curve
[x,y]=batman(n);
cFigure; hold on;
xlabel('x'); ylabel('y');
plot([x;x(1)],[y;y(1)],'k.-','LineWidth',3,'MarkerSize',25);
axis tight;
set(gca,'FontSize',25);
grid on; box on;
drawnow;

GIBBON www.gibboncode.org
Kevin Mattheus Moerman, [email protected]
GIBBON footer text
License: https://github.com/gibbonCode/GIBBON/blob/master/LICENSE
GIBBON: The Geometry and Image-based Bioengineering add-On. A toolbox for image segmentation, image-based modeling, meshing, and finite element analysis.
Copyright (C) 2019 Kevin Mattheus Moerman
This program is free software: you can redistribute it and/or modify it under the terms of the GNU General Public License as published by the Free Software Foundation, either version 3 of the License, or (at your option) any later version.
This program is distributed in the hope that it will be useful, but WITHOUT ANY WARRANTY; without even the implied warranty of MERCHANTABILITY or FITNESS FOR A PARTICULAR PURPOSE. See the GNU General Public License for more details.
You should have received a copy of the GNU General Public License along with this program. If not, see http://www.gnu.org/licenses/.