DEMO_stent_hexahedral_sweeping_02
Below is a demonstration for:
- Creating a hexahedral mesh for a vascular stent by sweeping allong a curve and copying over the segments.
Contents
Keywords
- Sweeping, sweepLoft
- Hexahedral mesh
- stent, vascular
- Exporting Abaqus, .inp
clear; close all; clc;
plot settings
fontSize=25;
markerSize=10;
lineWidth=3;
Contol parameters
controlParameterSet.stentRadius=3; %The outer radius of the stent
controlParameterSet.numPeriodsWave=10; %The number of periods to use for a sinusoidal modulation
numStepsPeriod=100; %Number of sweeping steps allong a single period segment for sweeping
controlParameterSet.stentSectionHeight=0.1; %Height of the stent wire
controlParameterSet.stentSectionWidth=0.1; %Width of the stent wire
controlParameterSet.numStepsCircumference=(controlParameterSet.numPeriodsWave*numStepsPeriod)+1; %Number of sweeping steps across curve
controlParameterSet.overSampleFactorCurve=10; %Oversample factor curve
controlParameterSet.numSplitSteps_axial=1;
controlParameterSet.numSplitSteps_inward=1;
controlParameterSet.plotOn=0;
% controlParameterSet.waveAmplitude=0.9; %Amplitude of the sinusoidal modulation

sheetLayerThickness=0.025;
numStepsSheet=1;
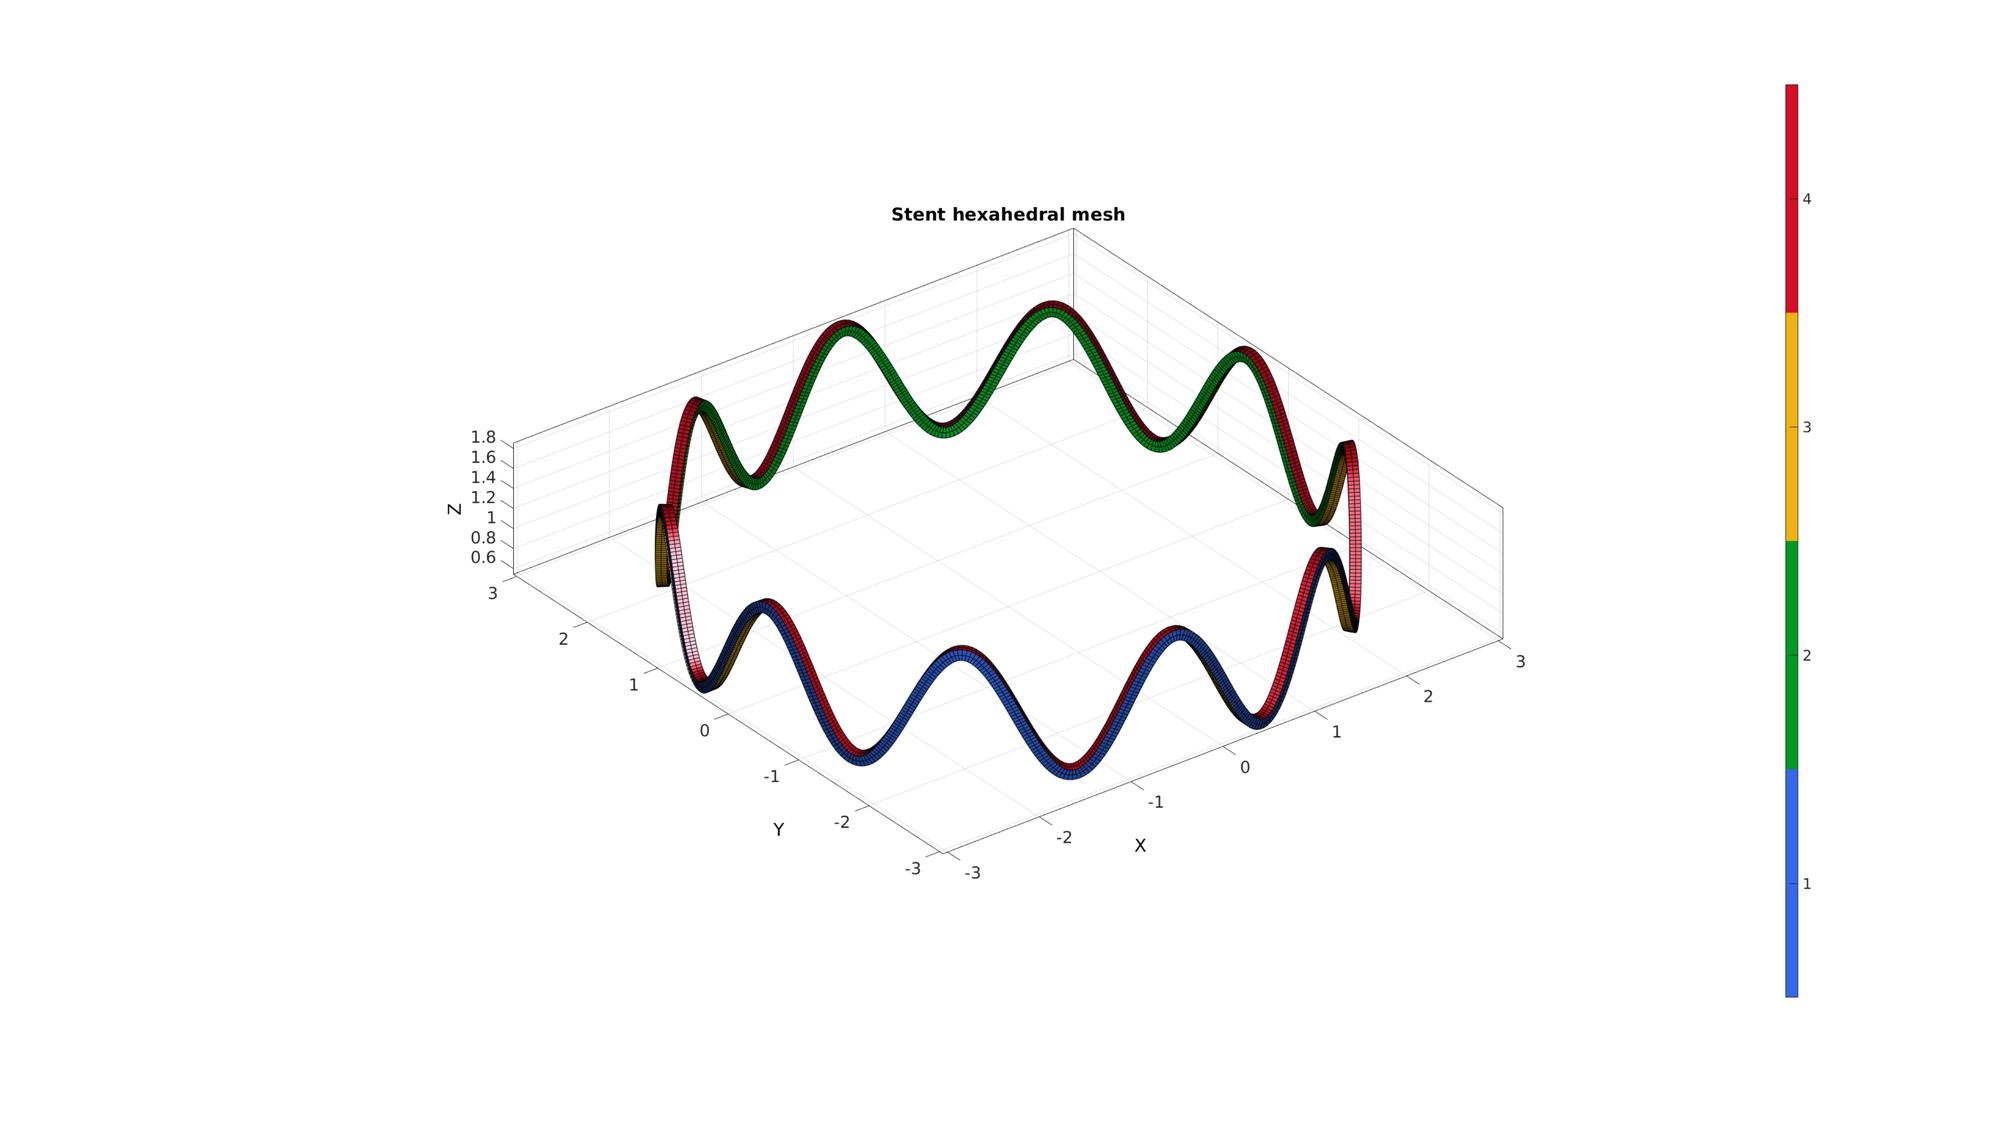
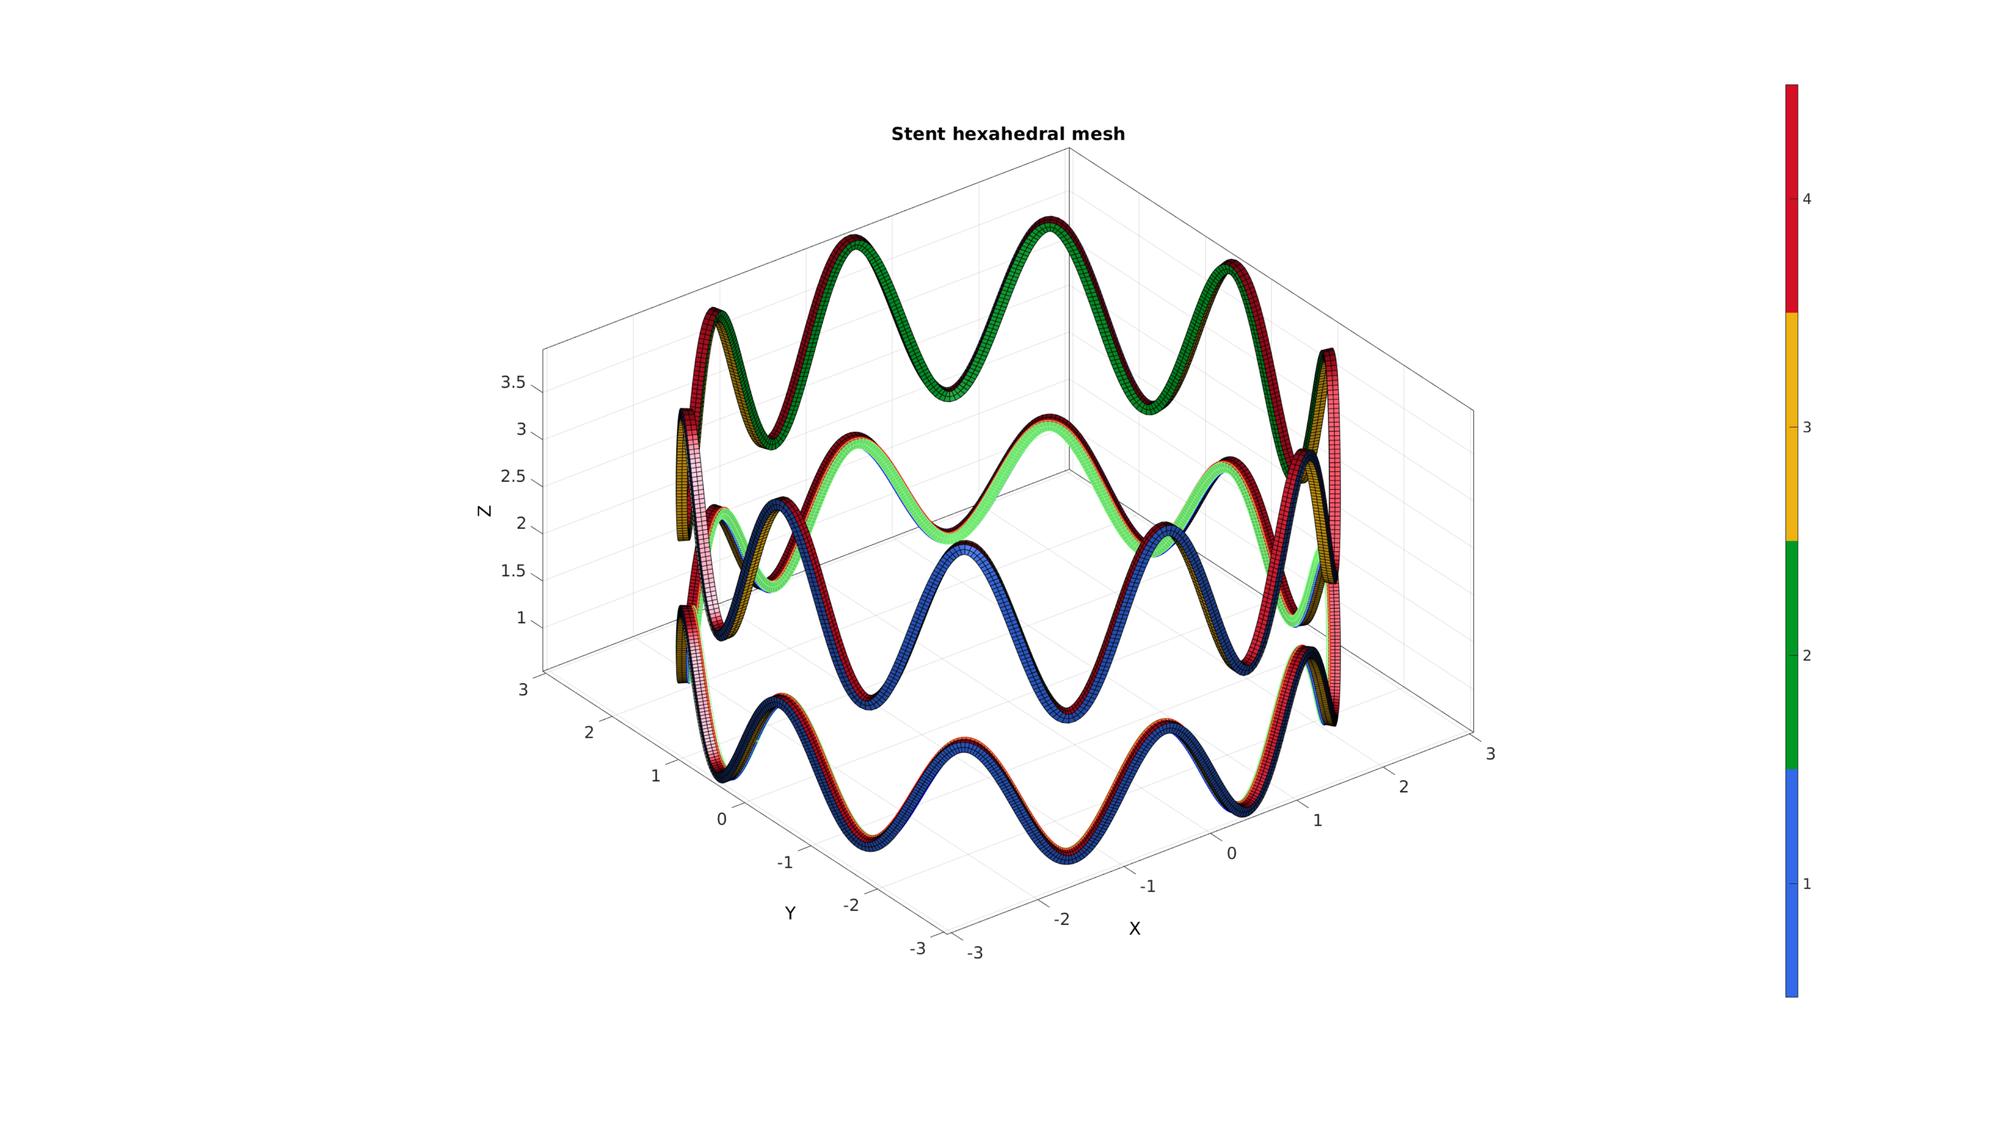
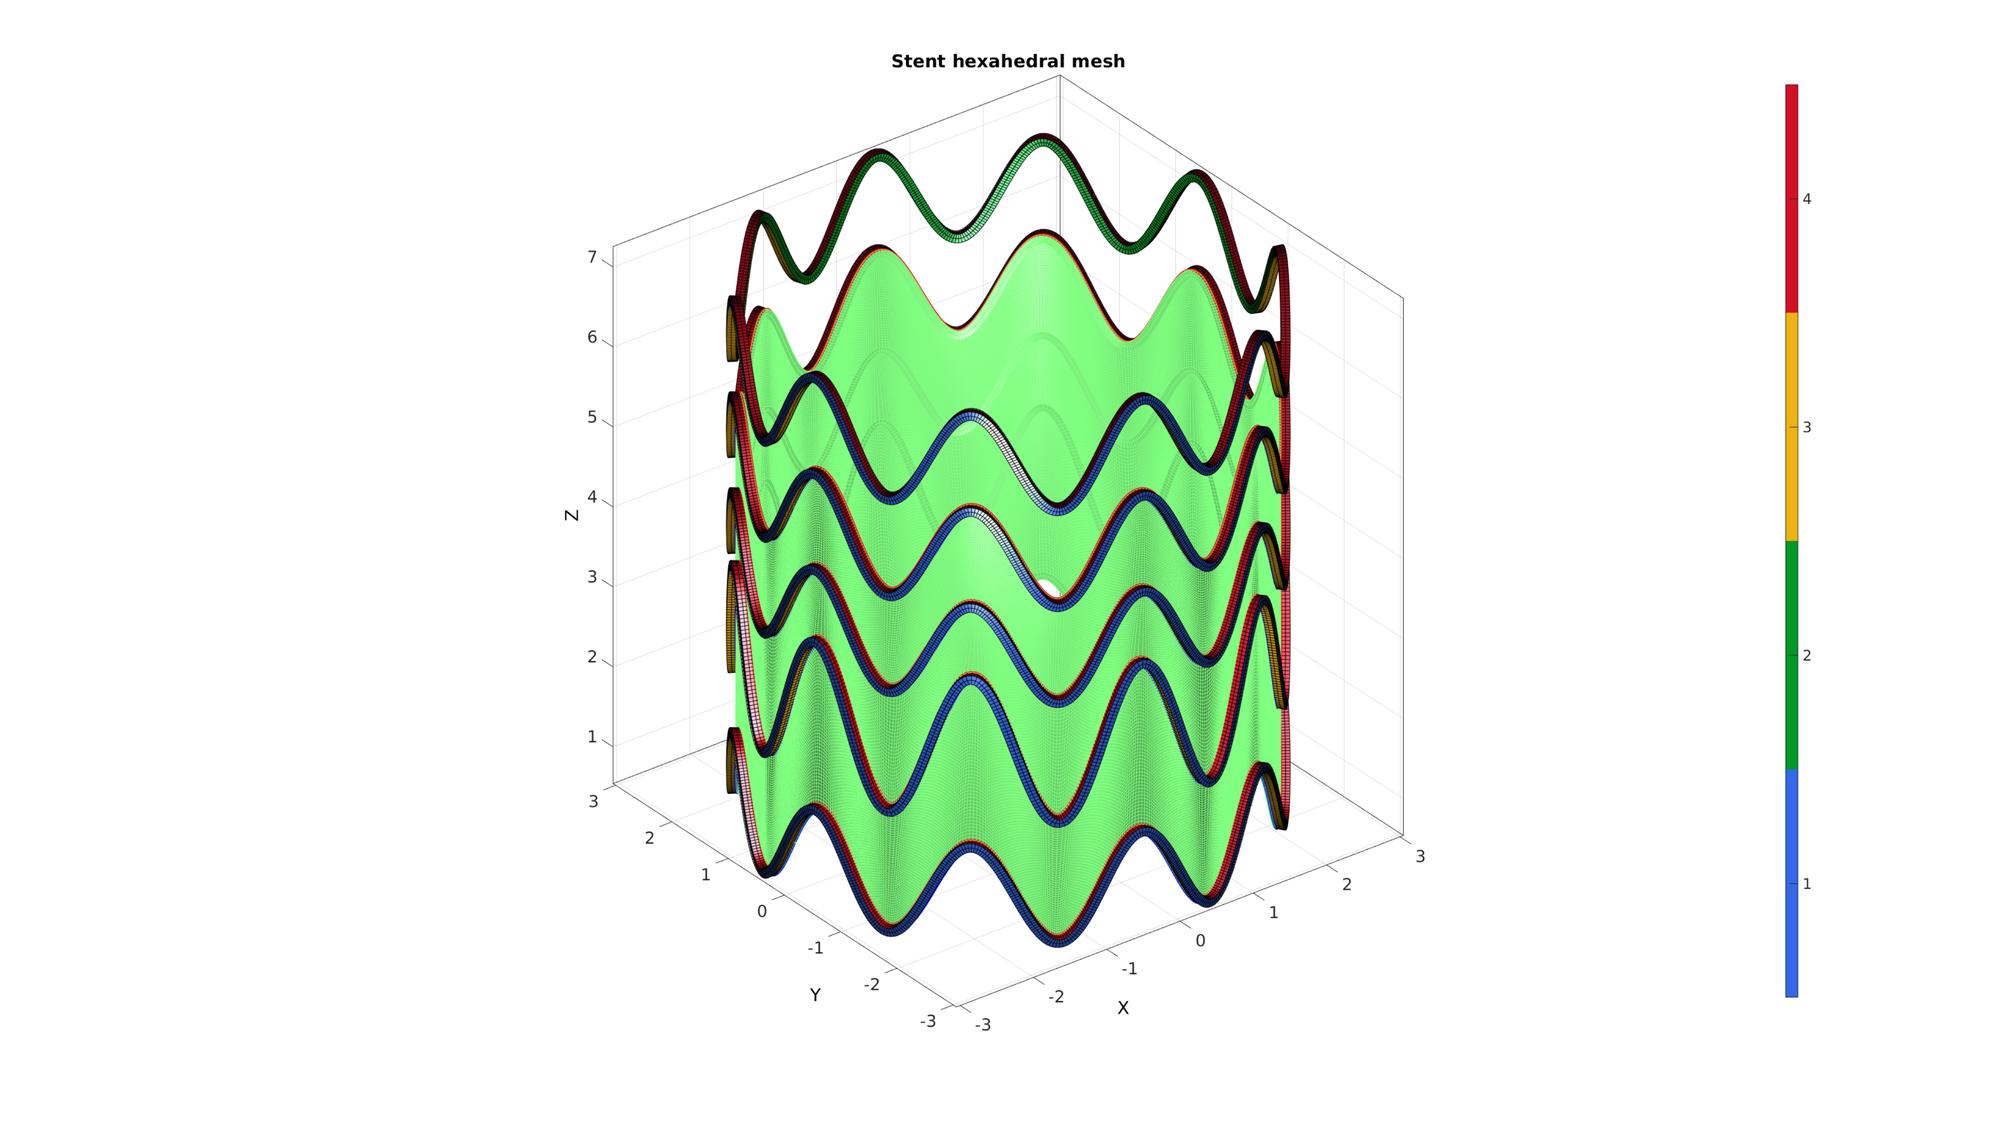
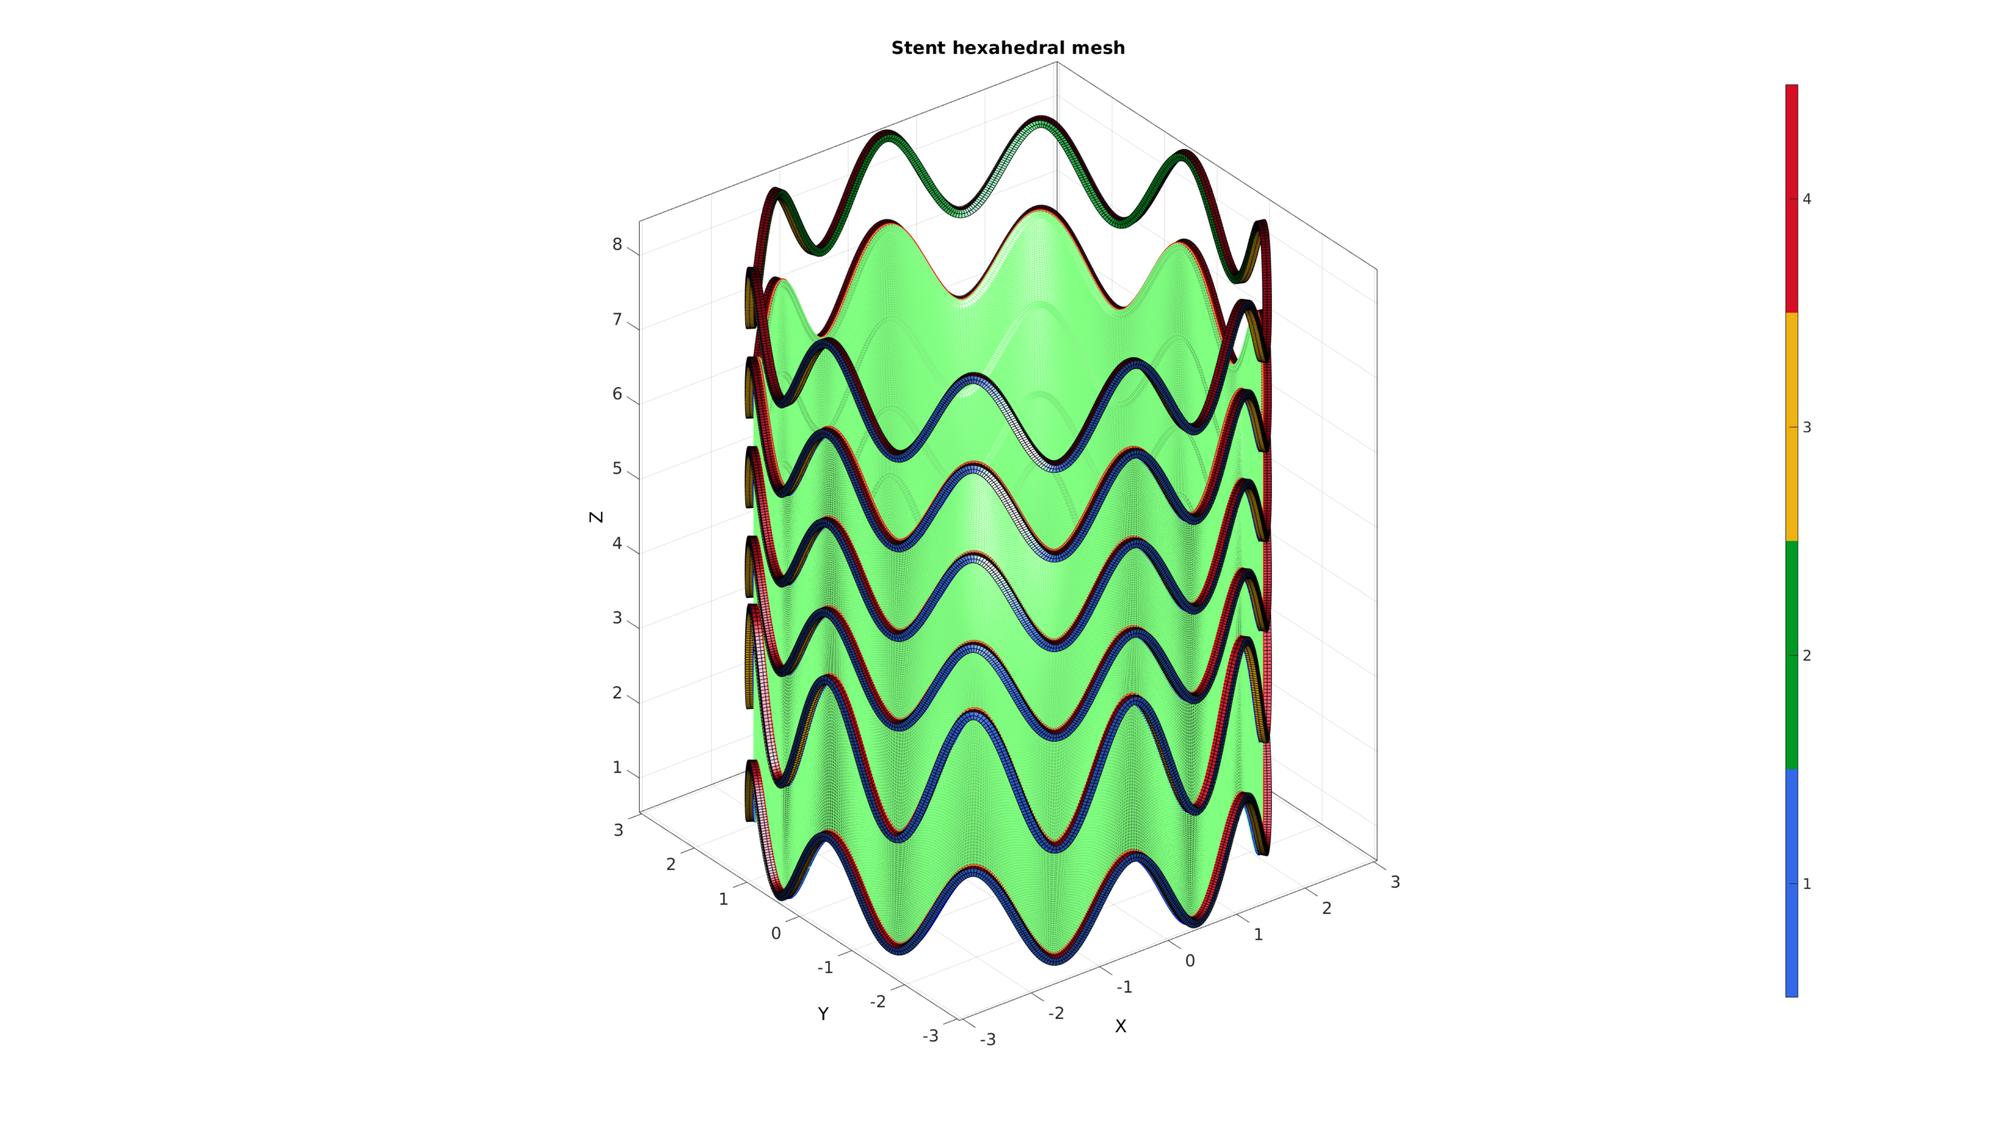
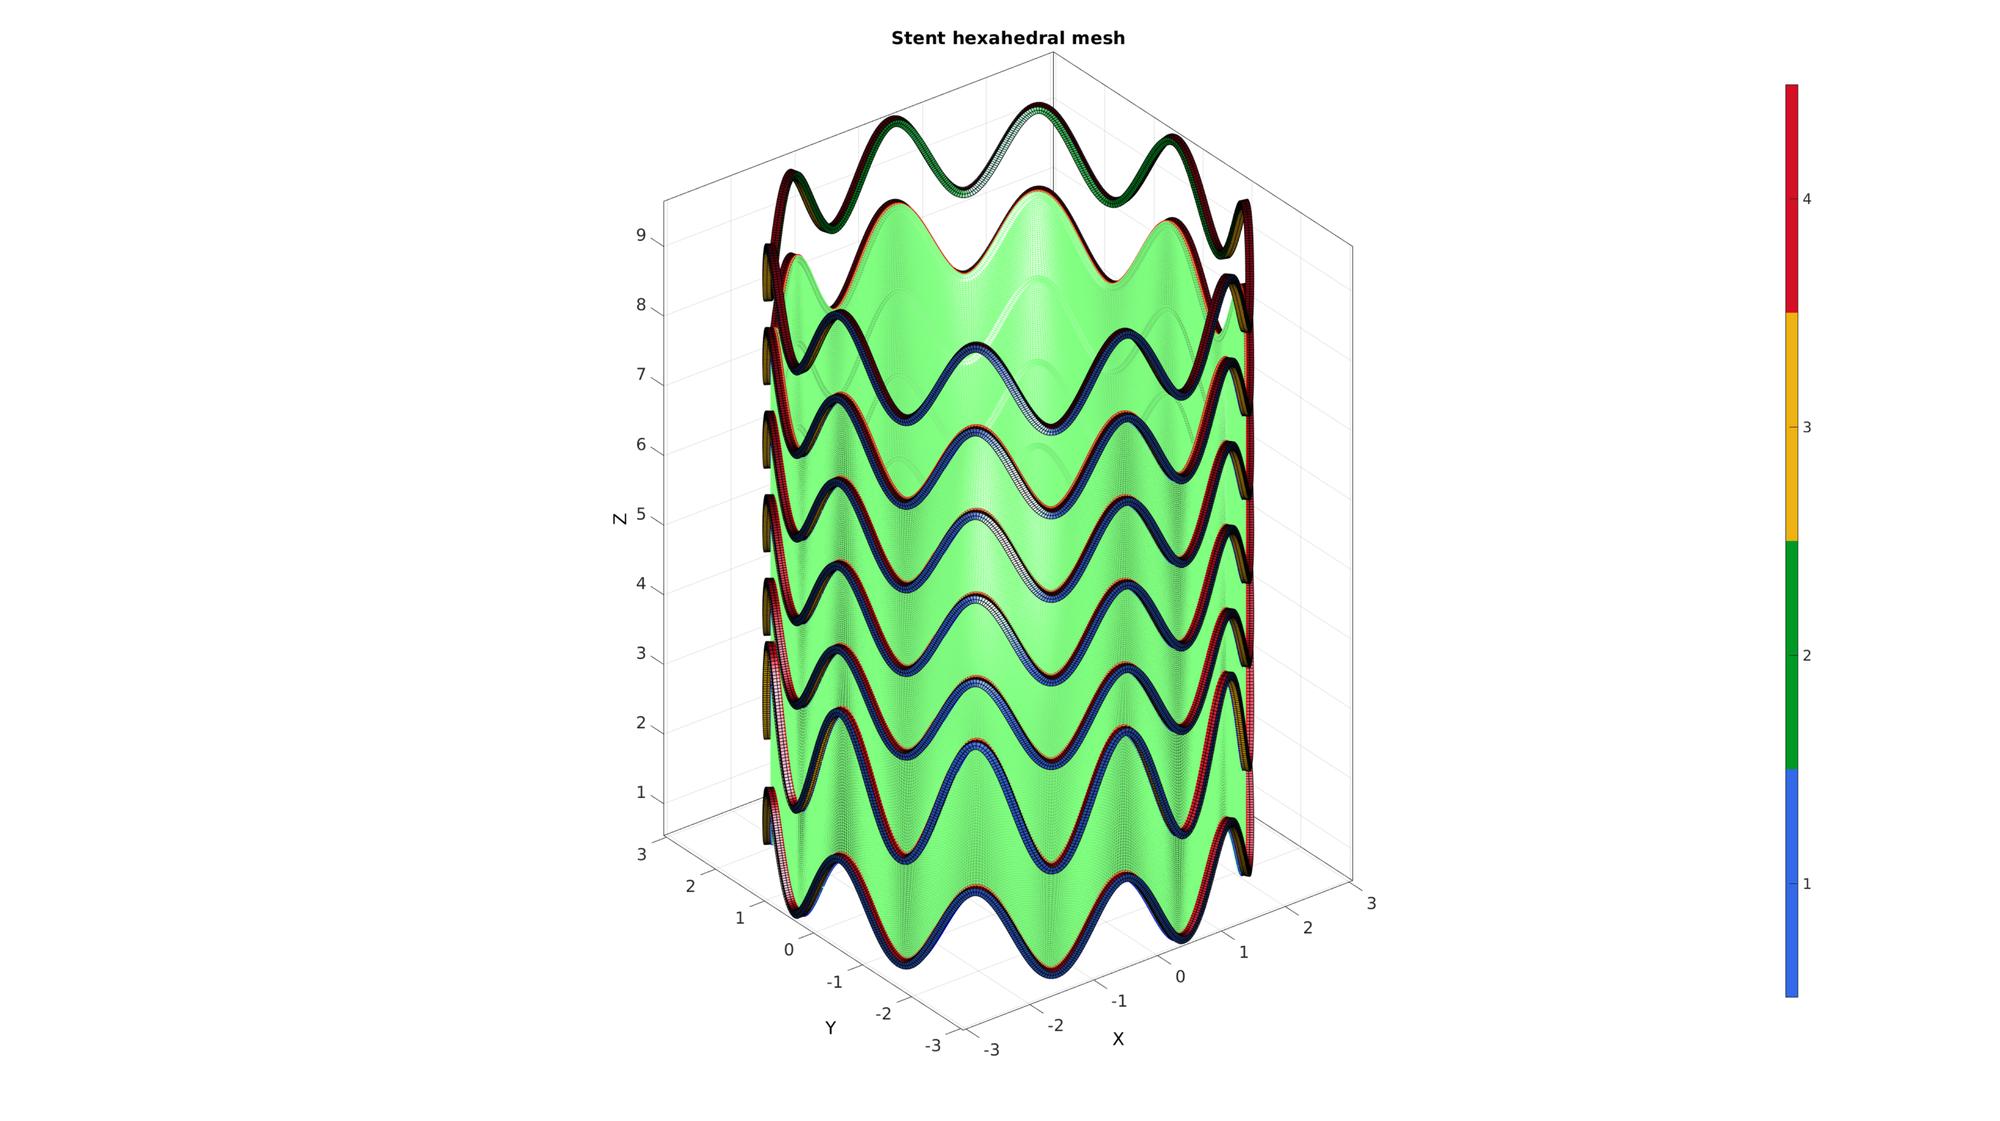
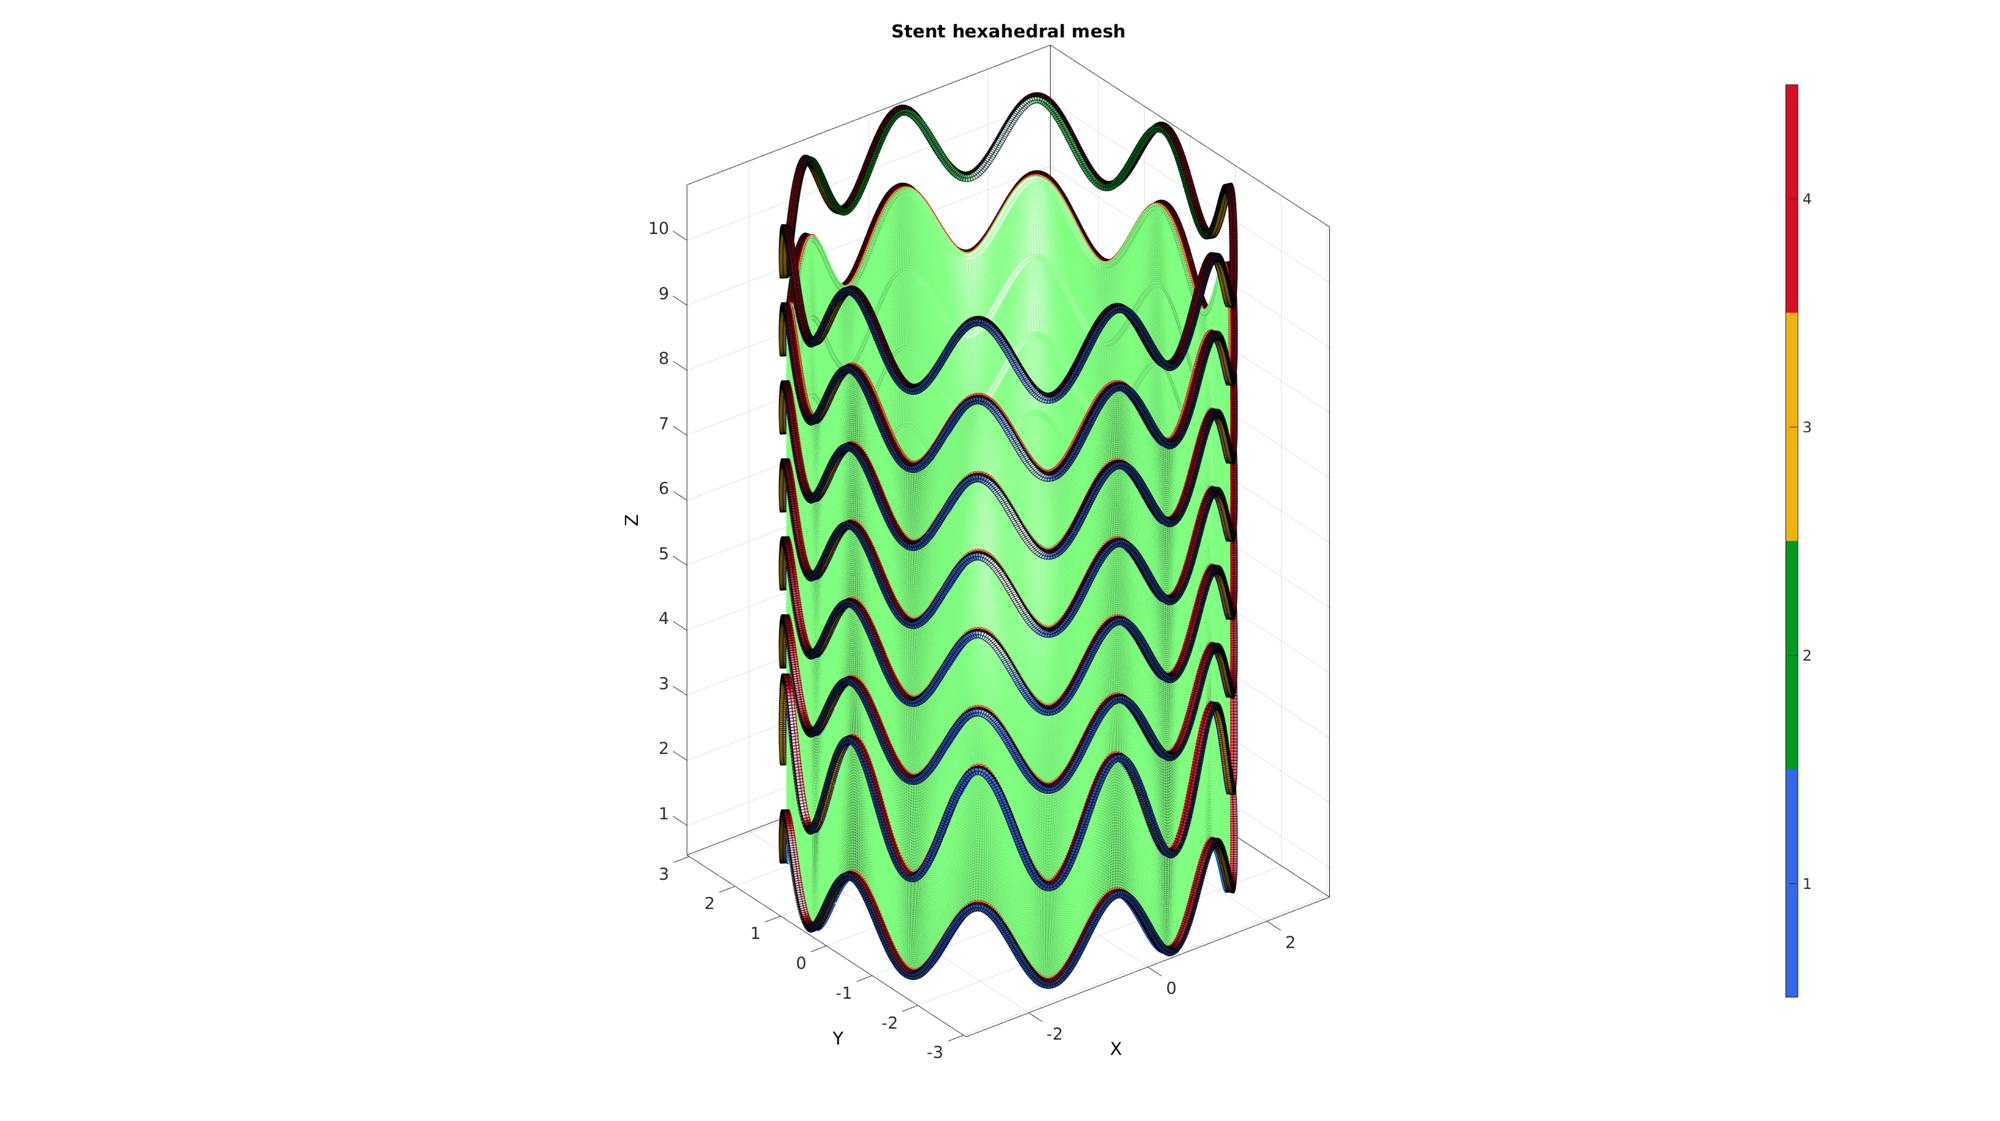
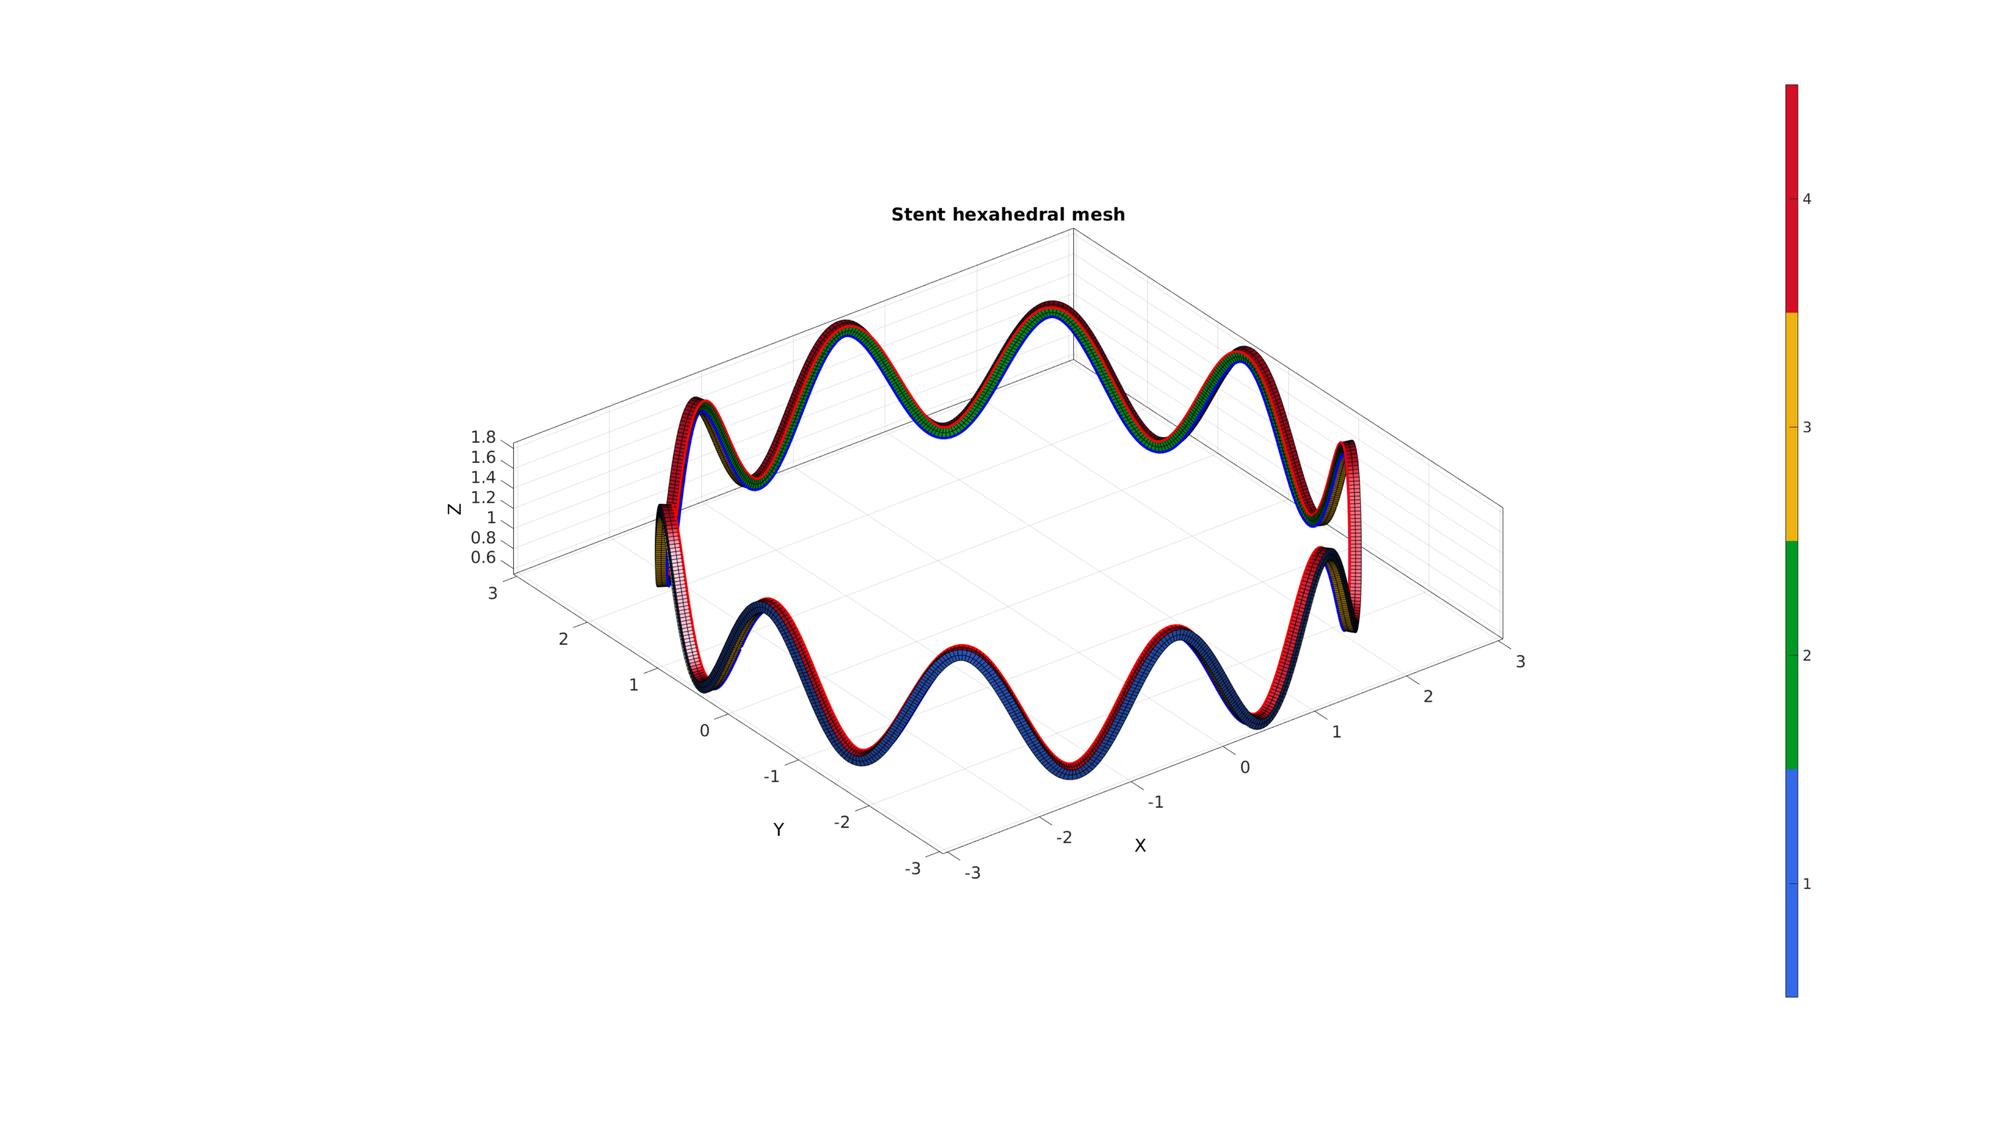
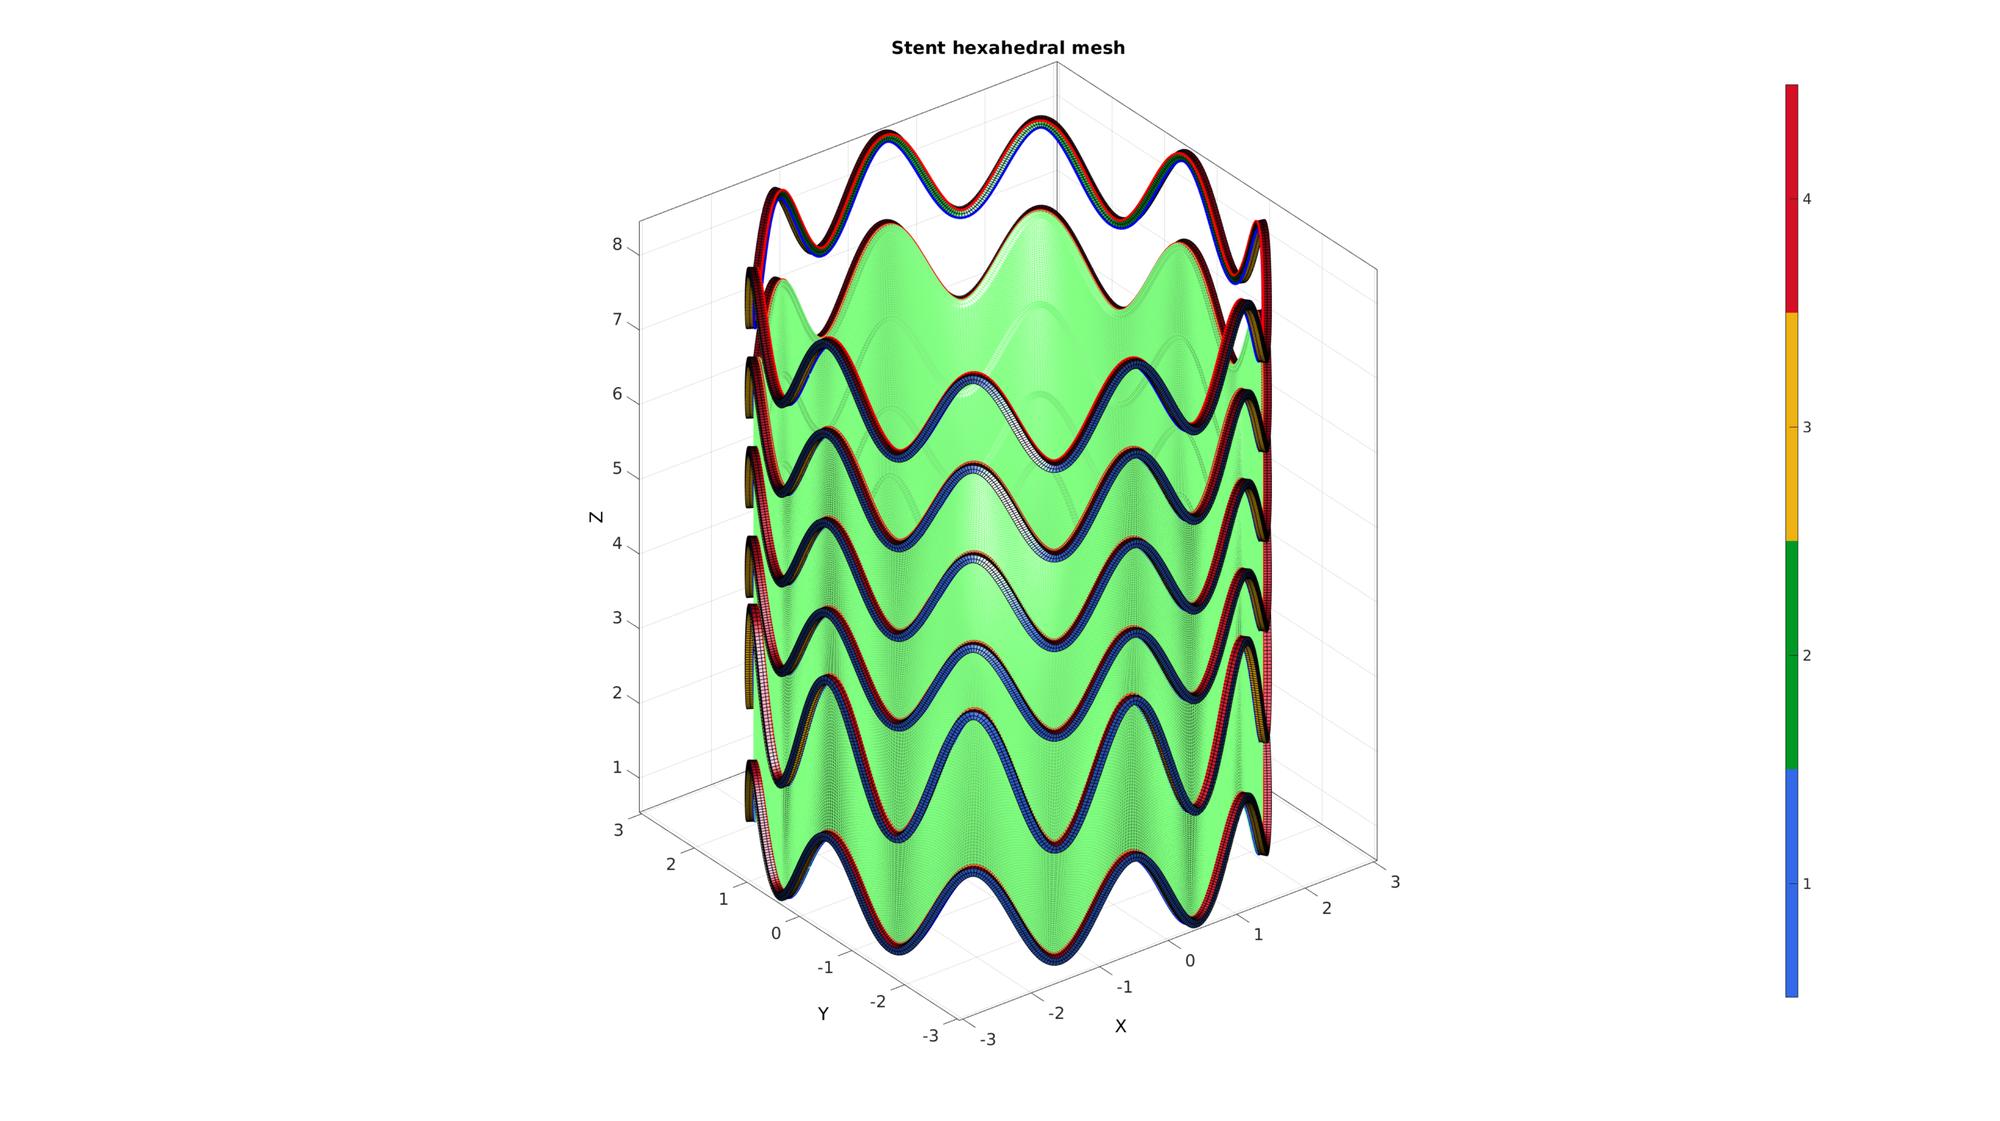
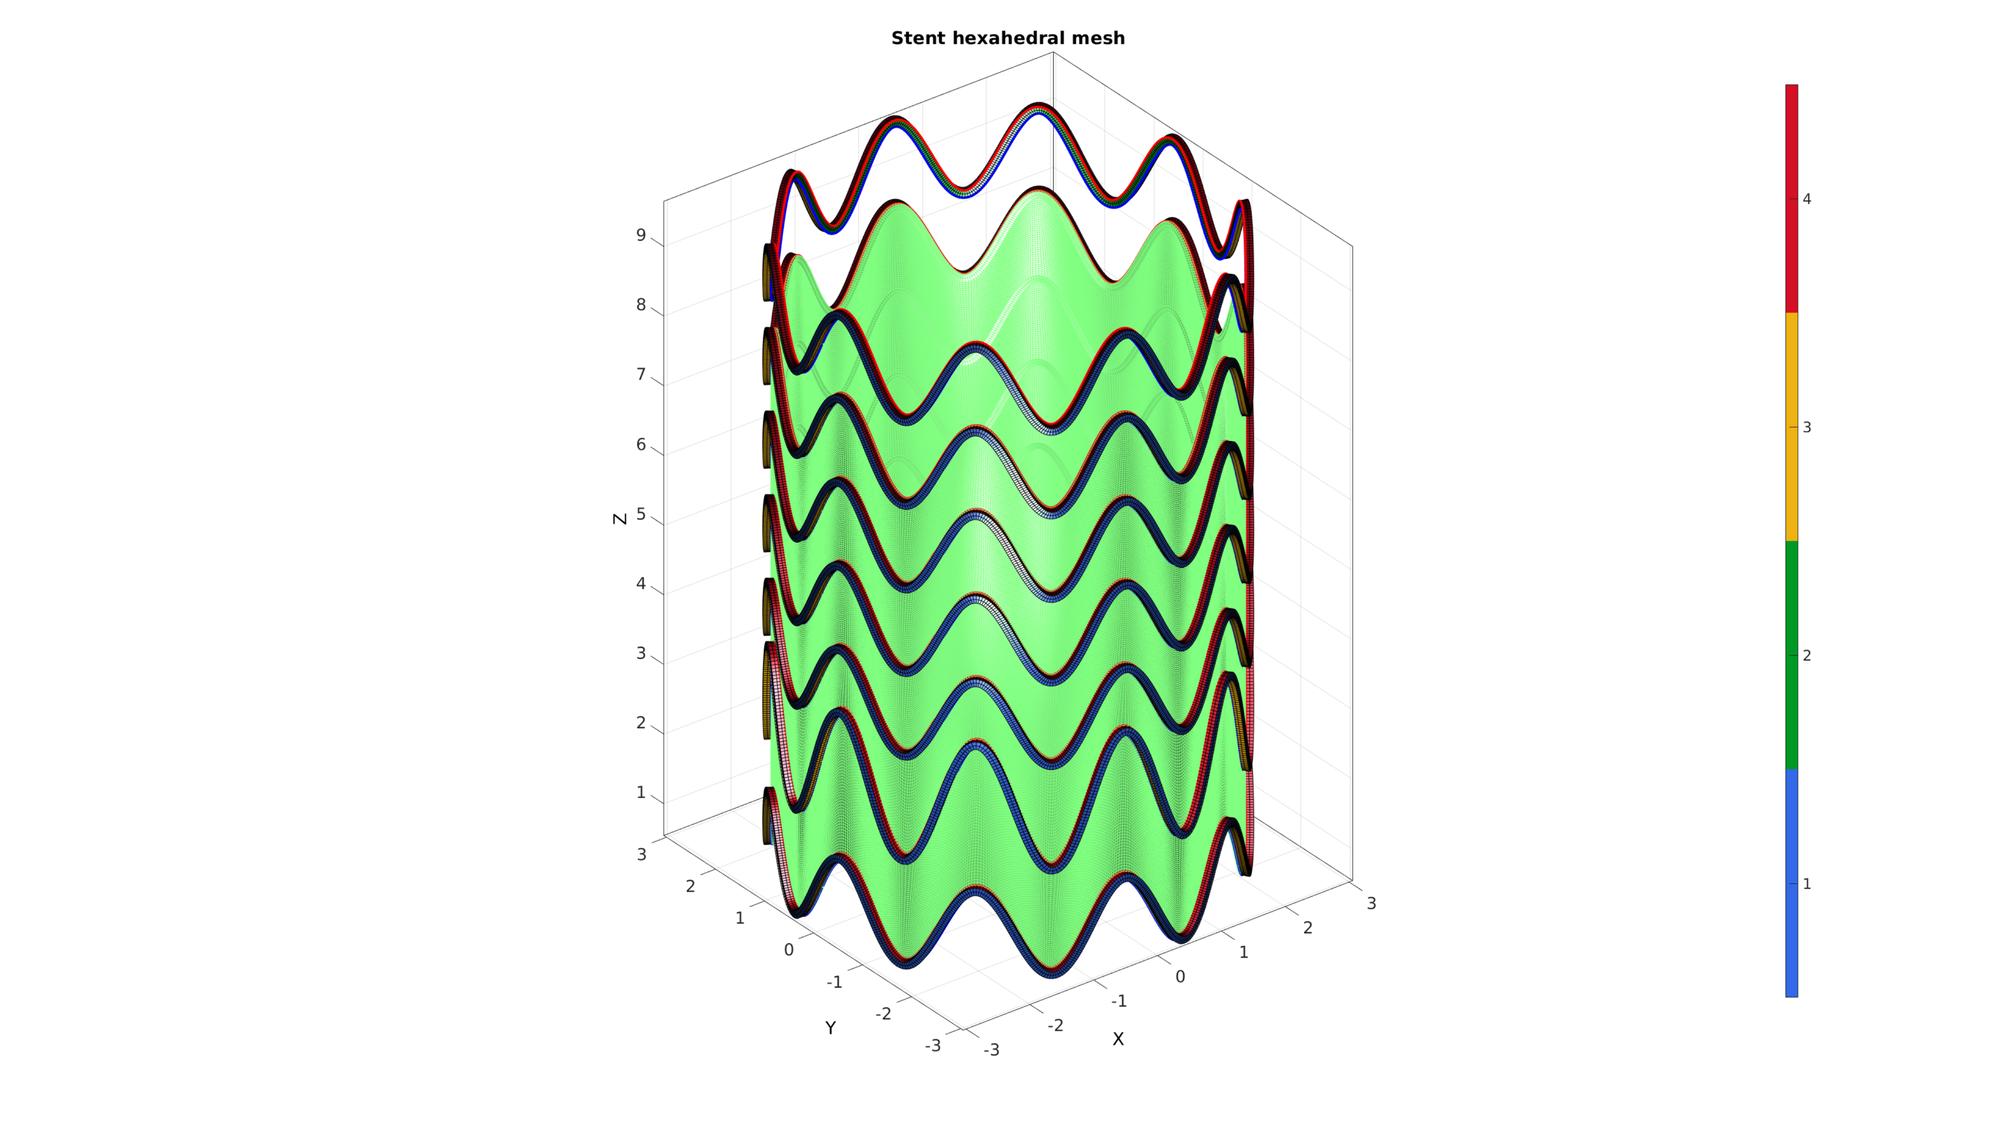
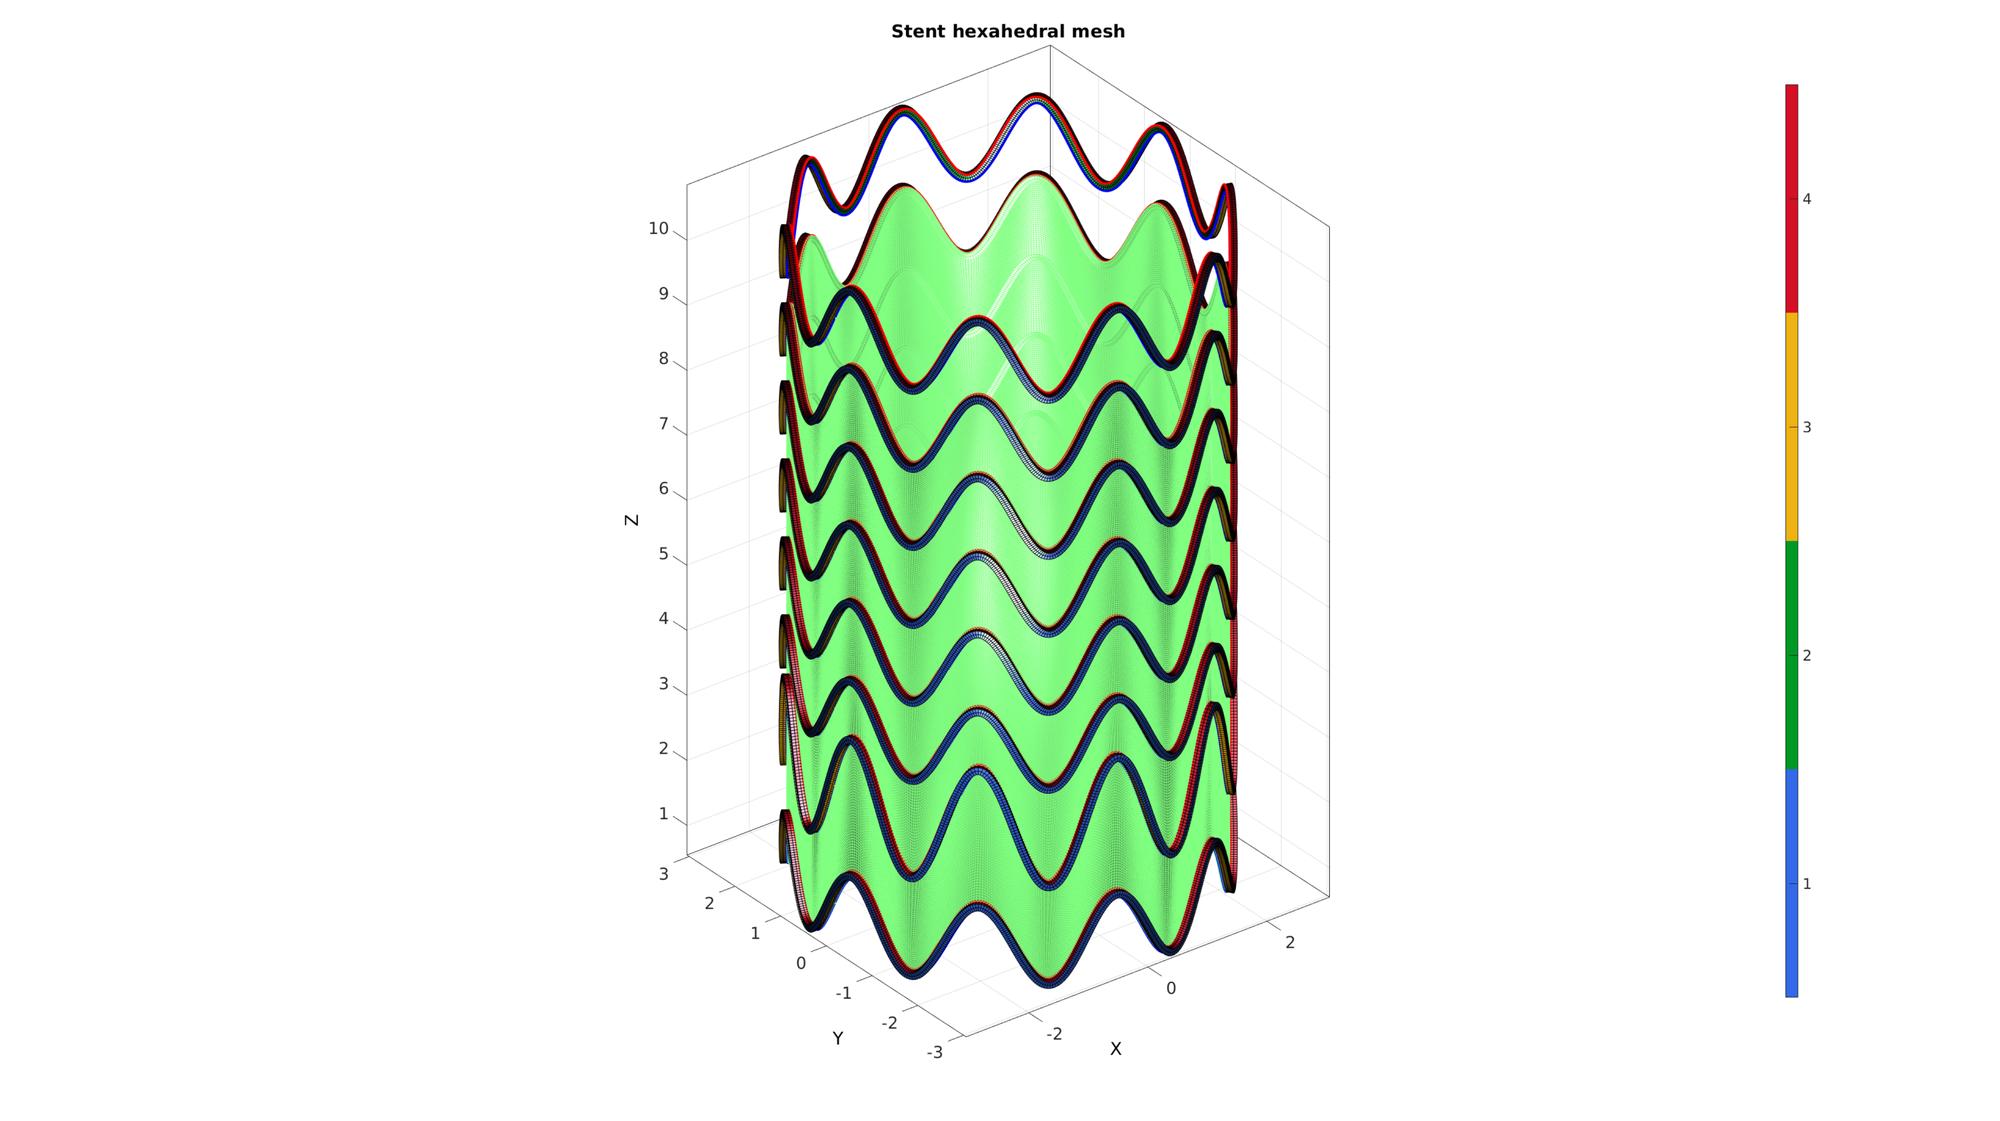
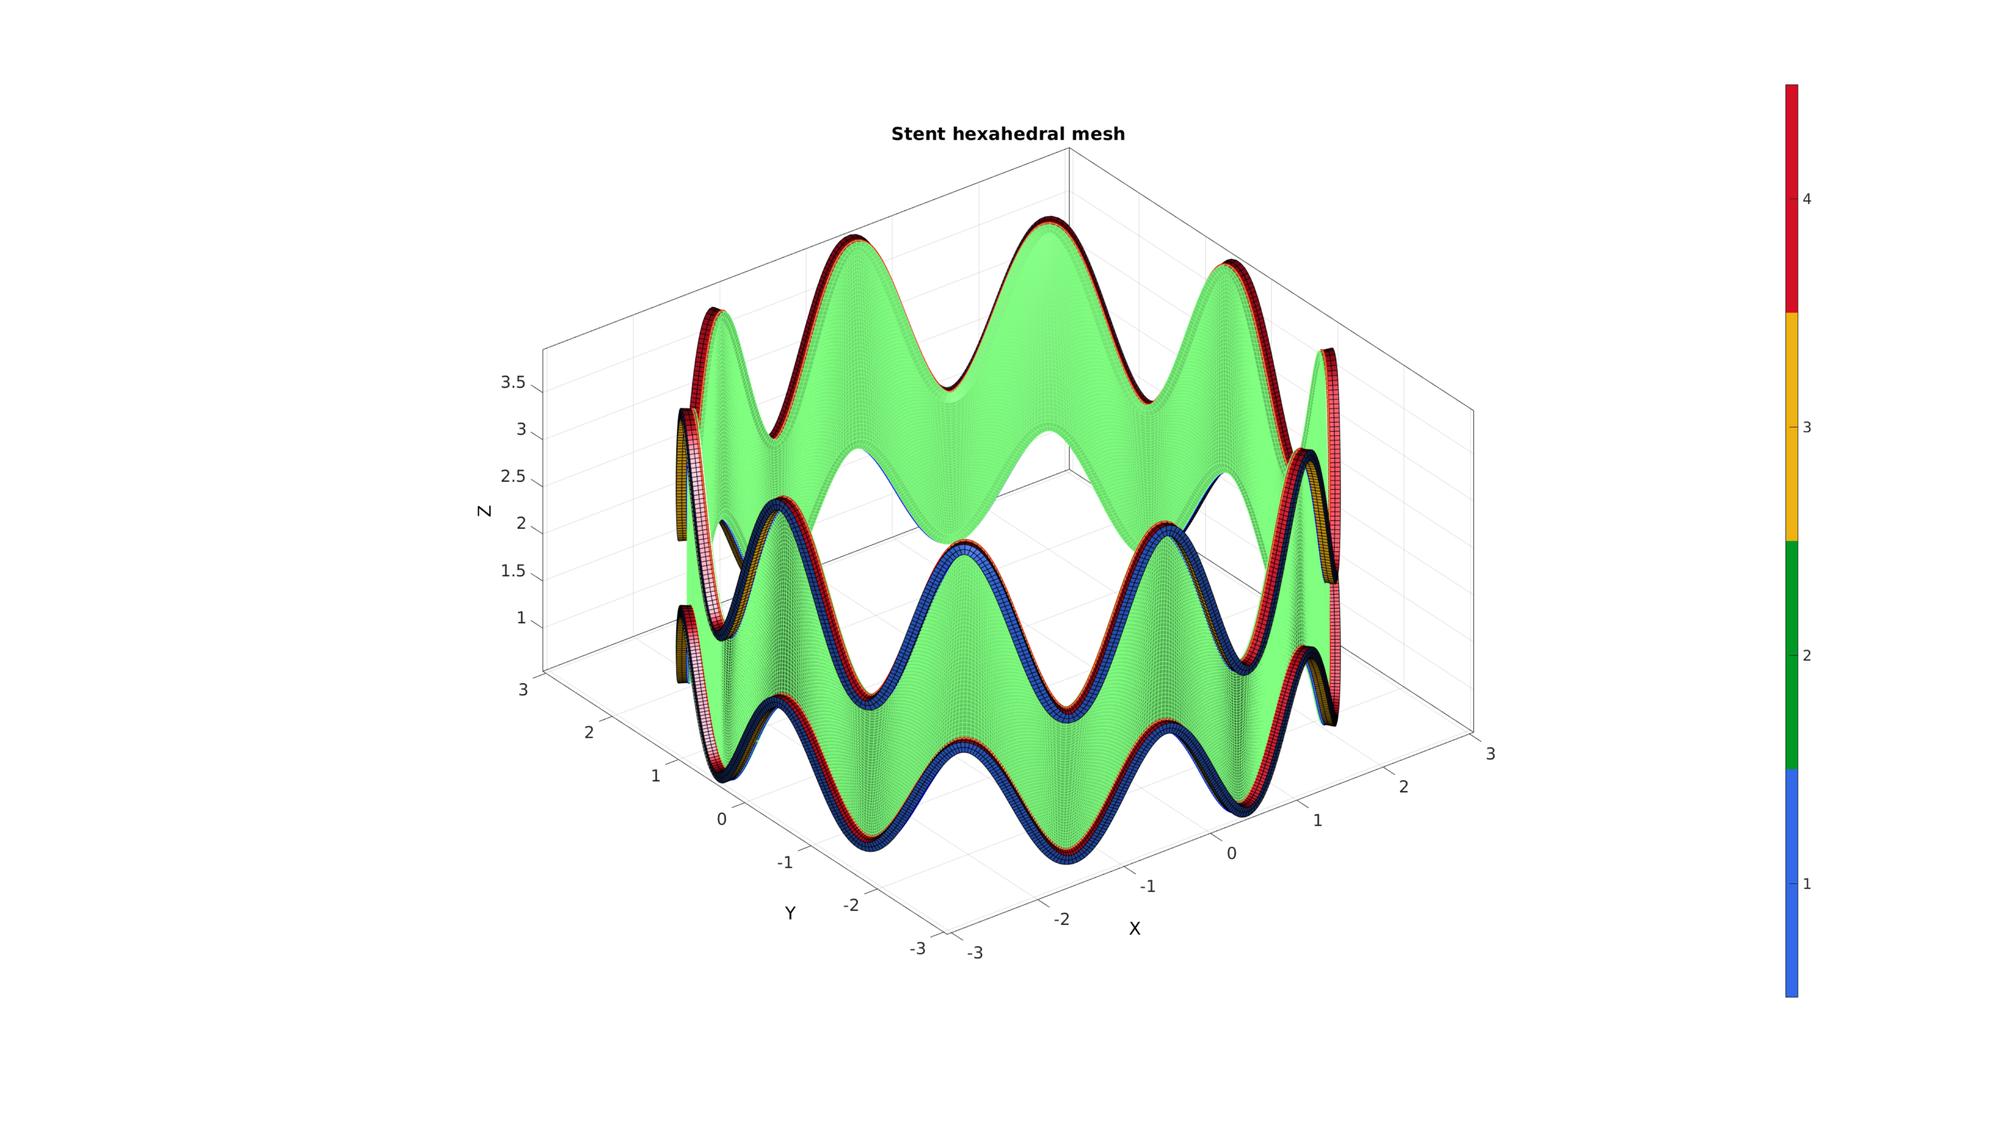
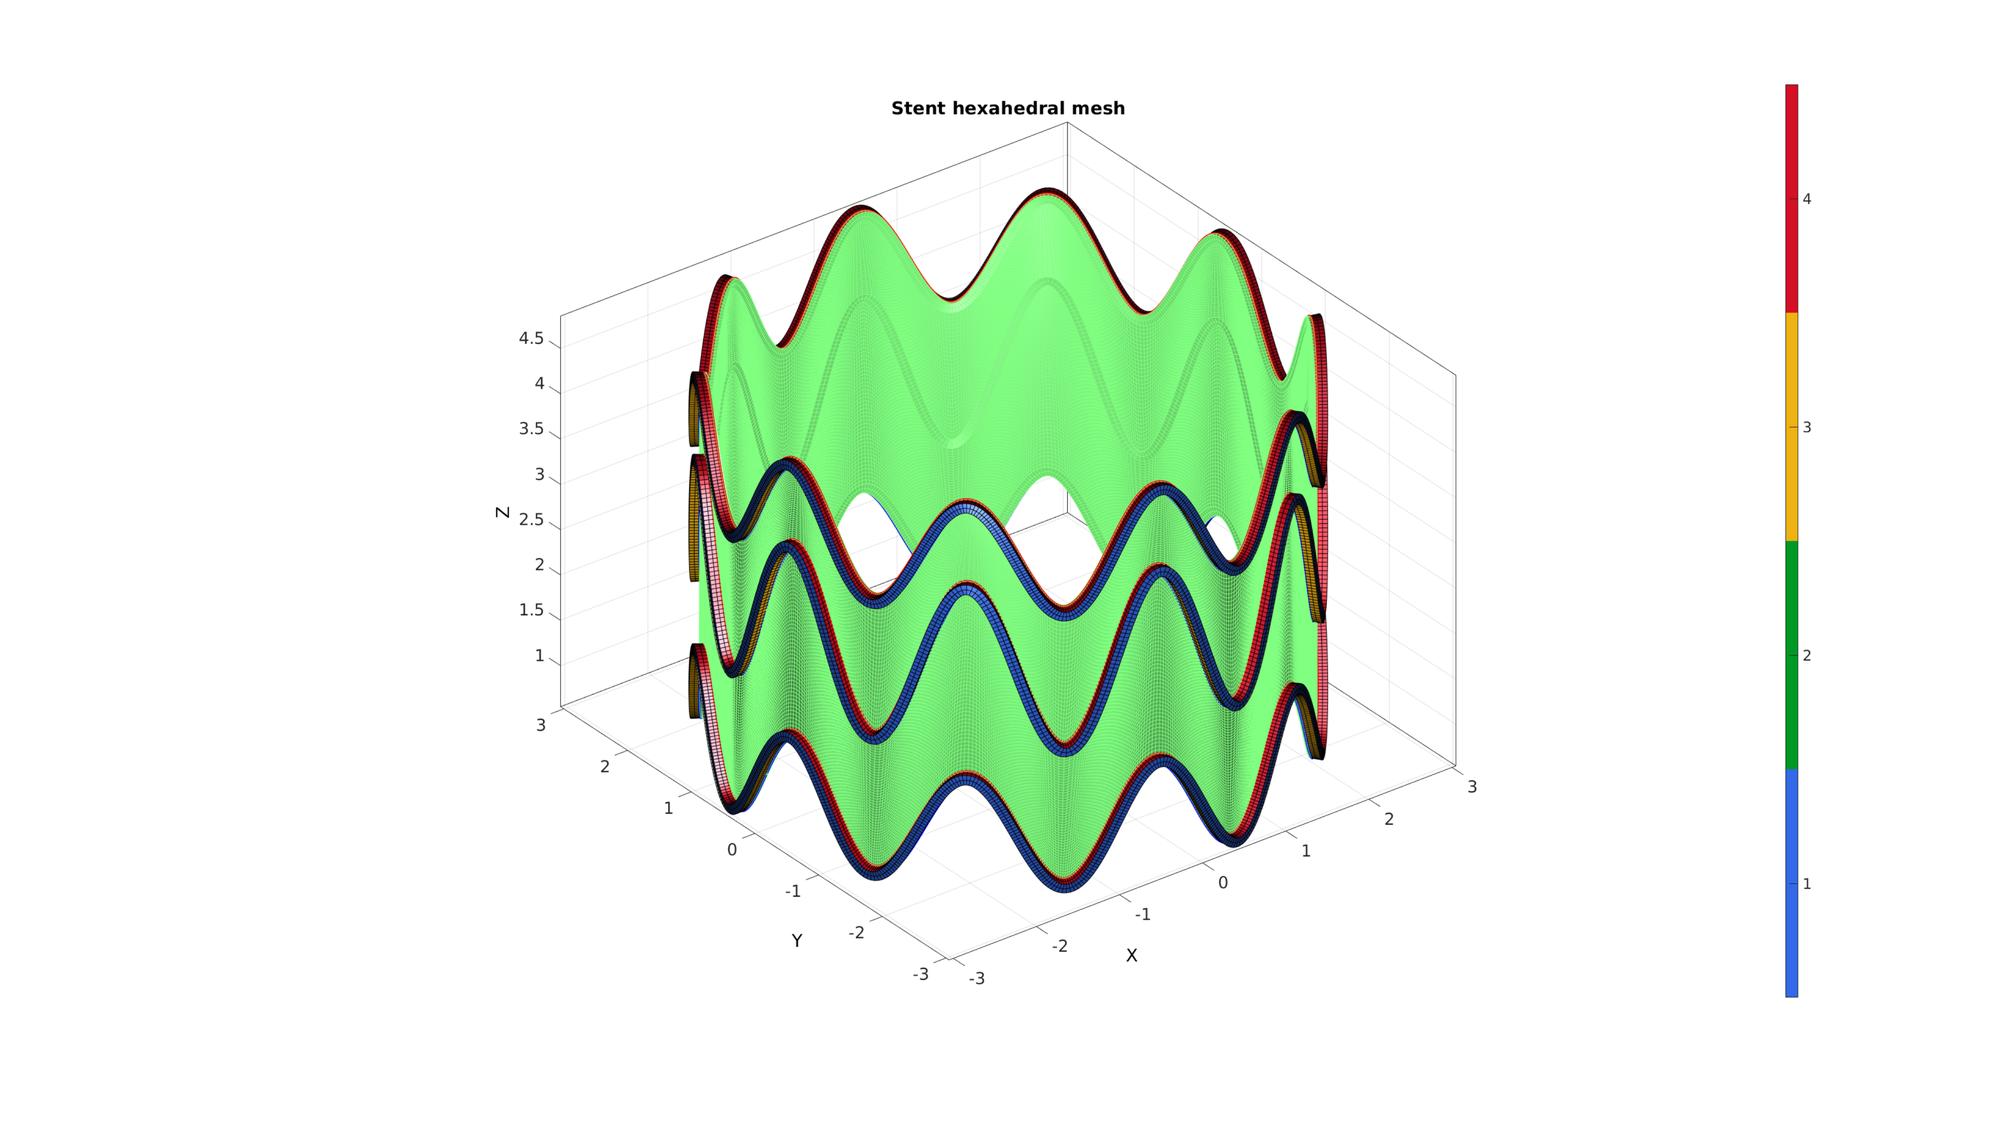
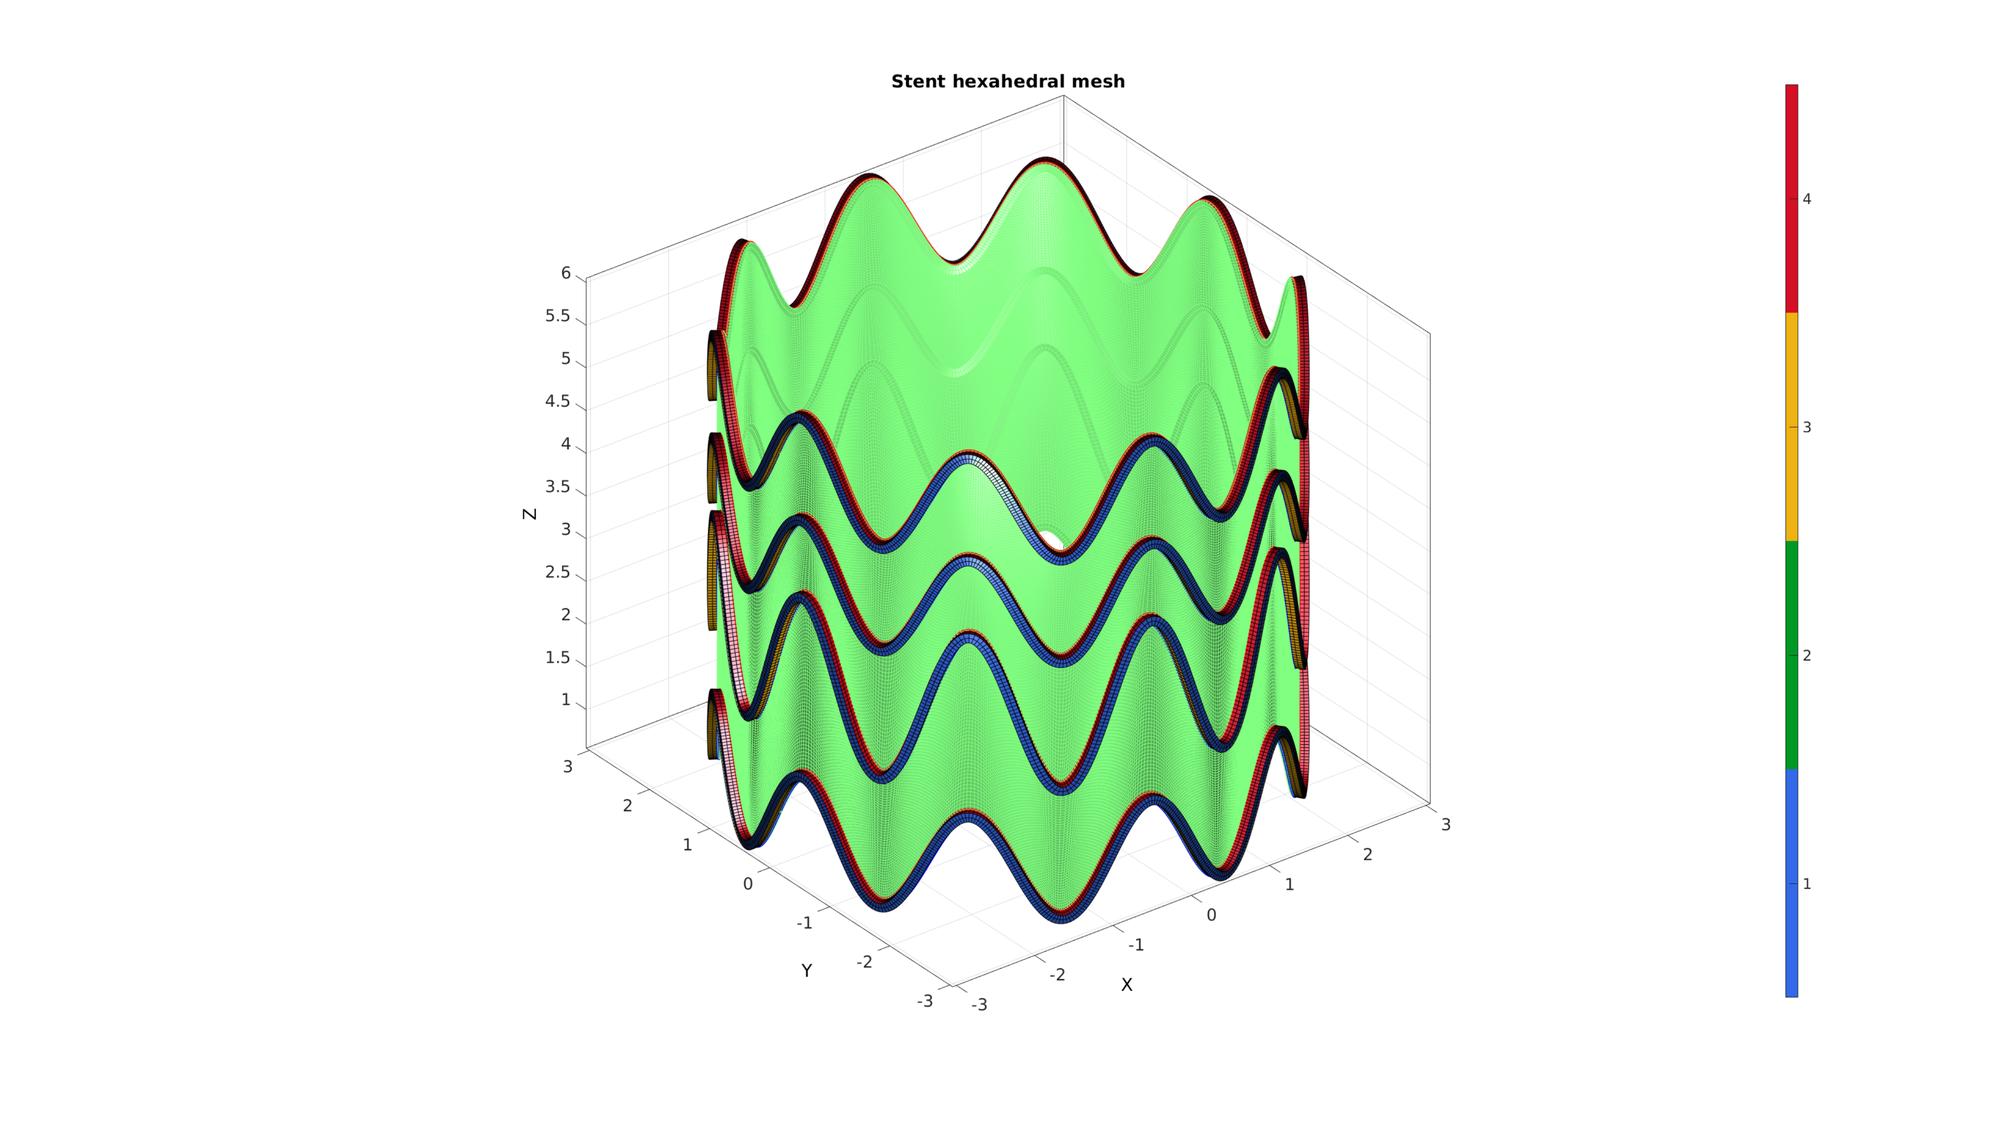
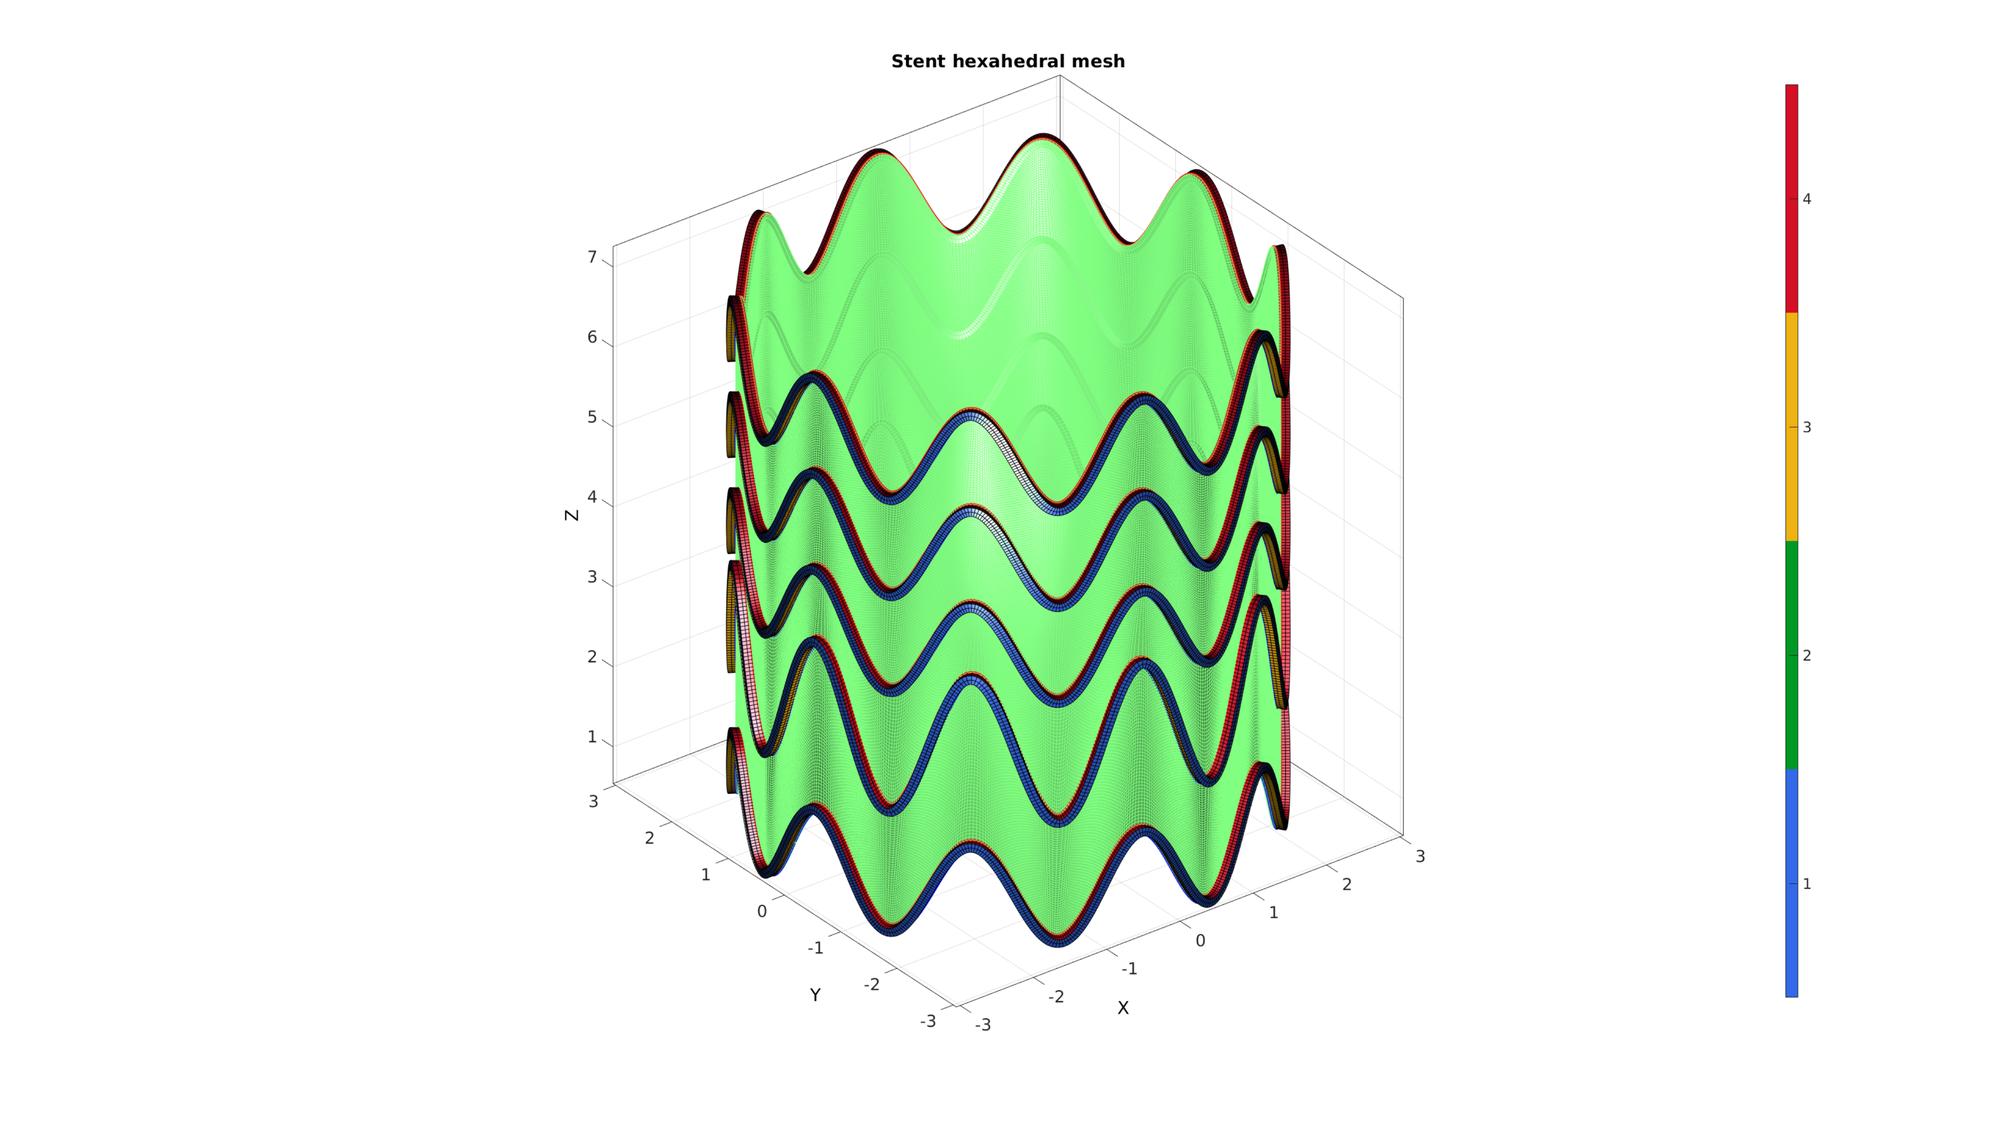
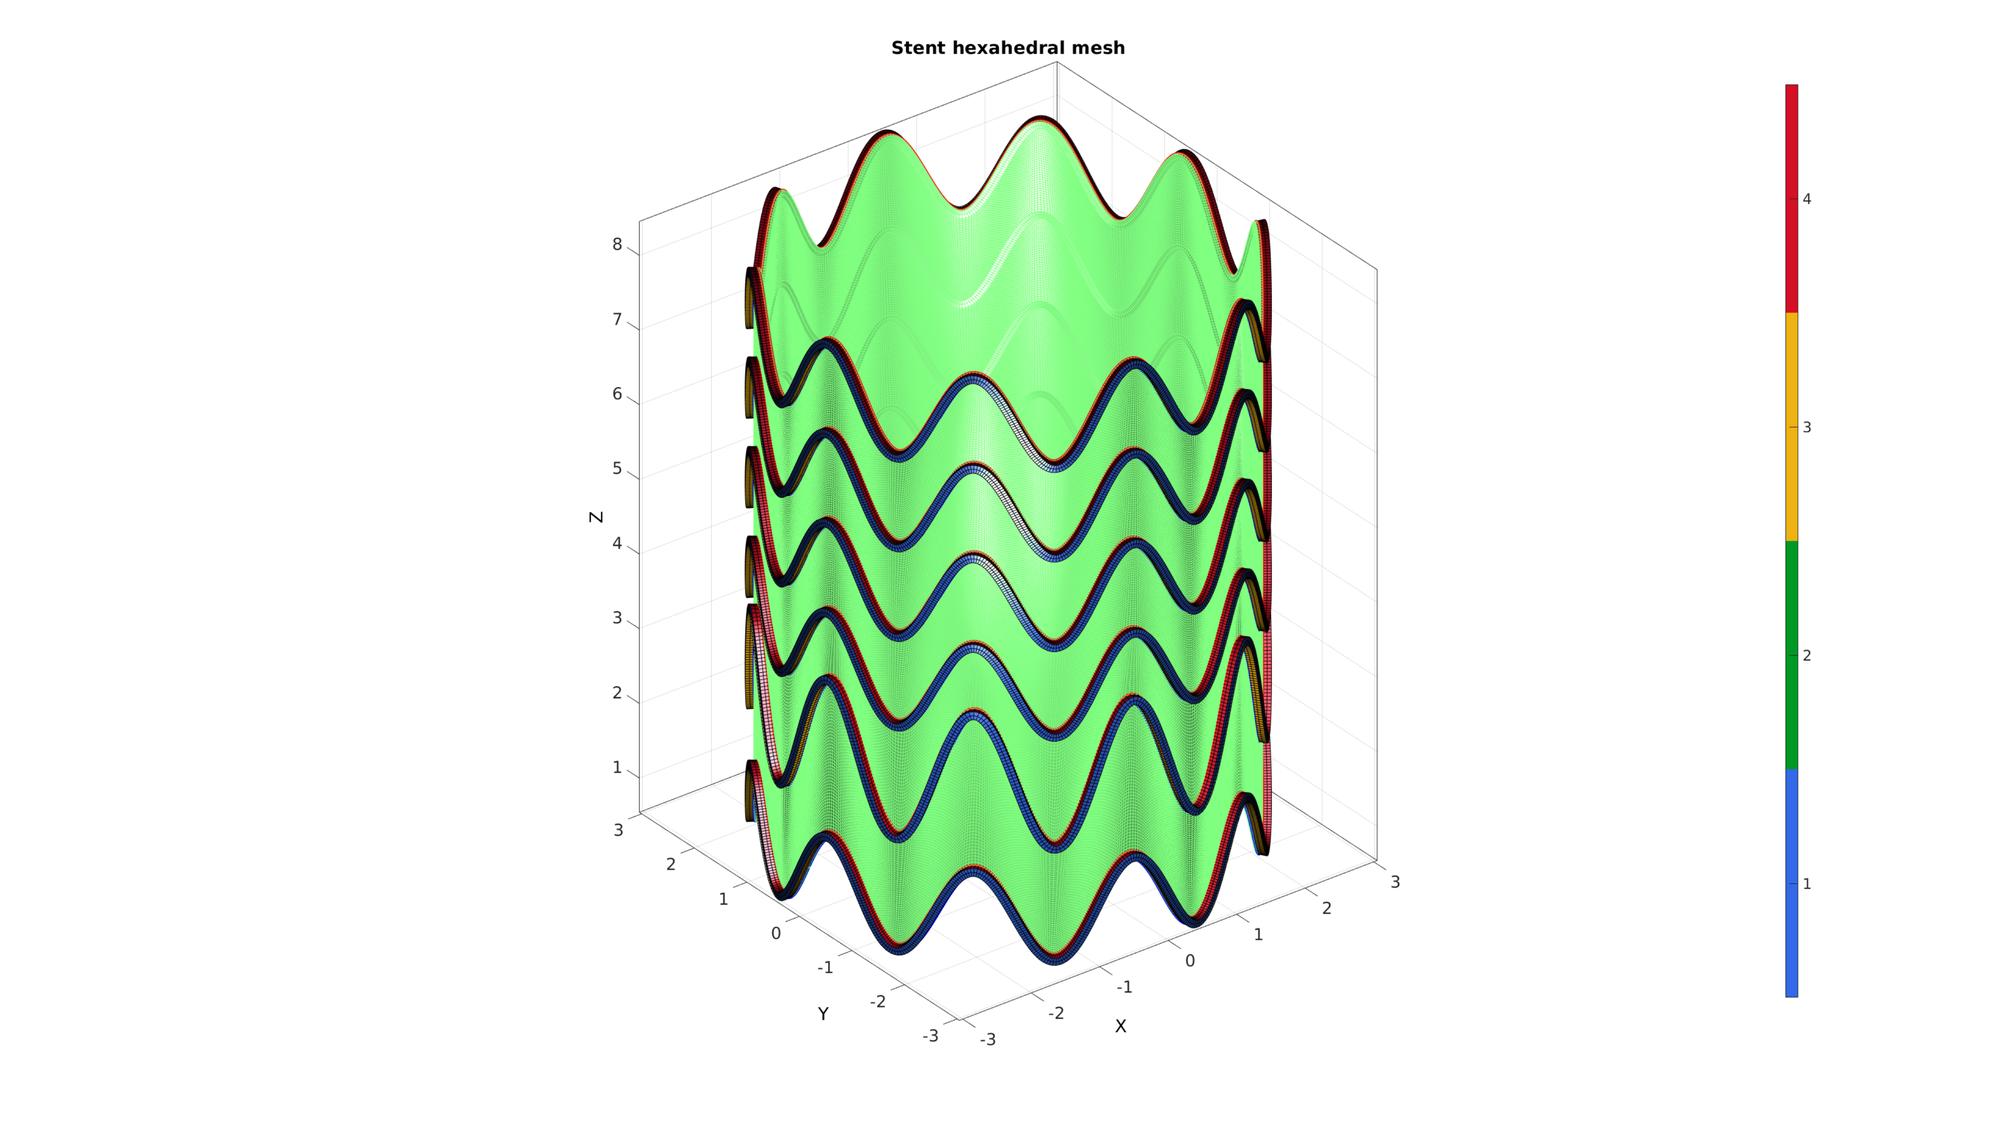
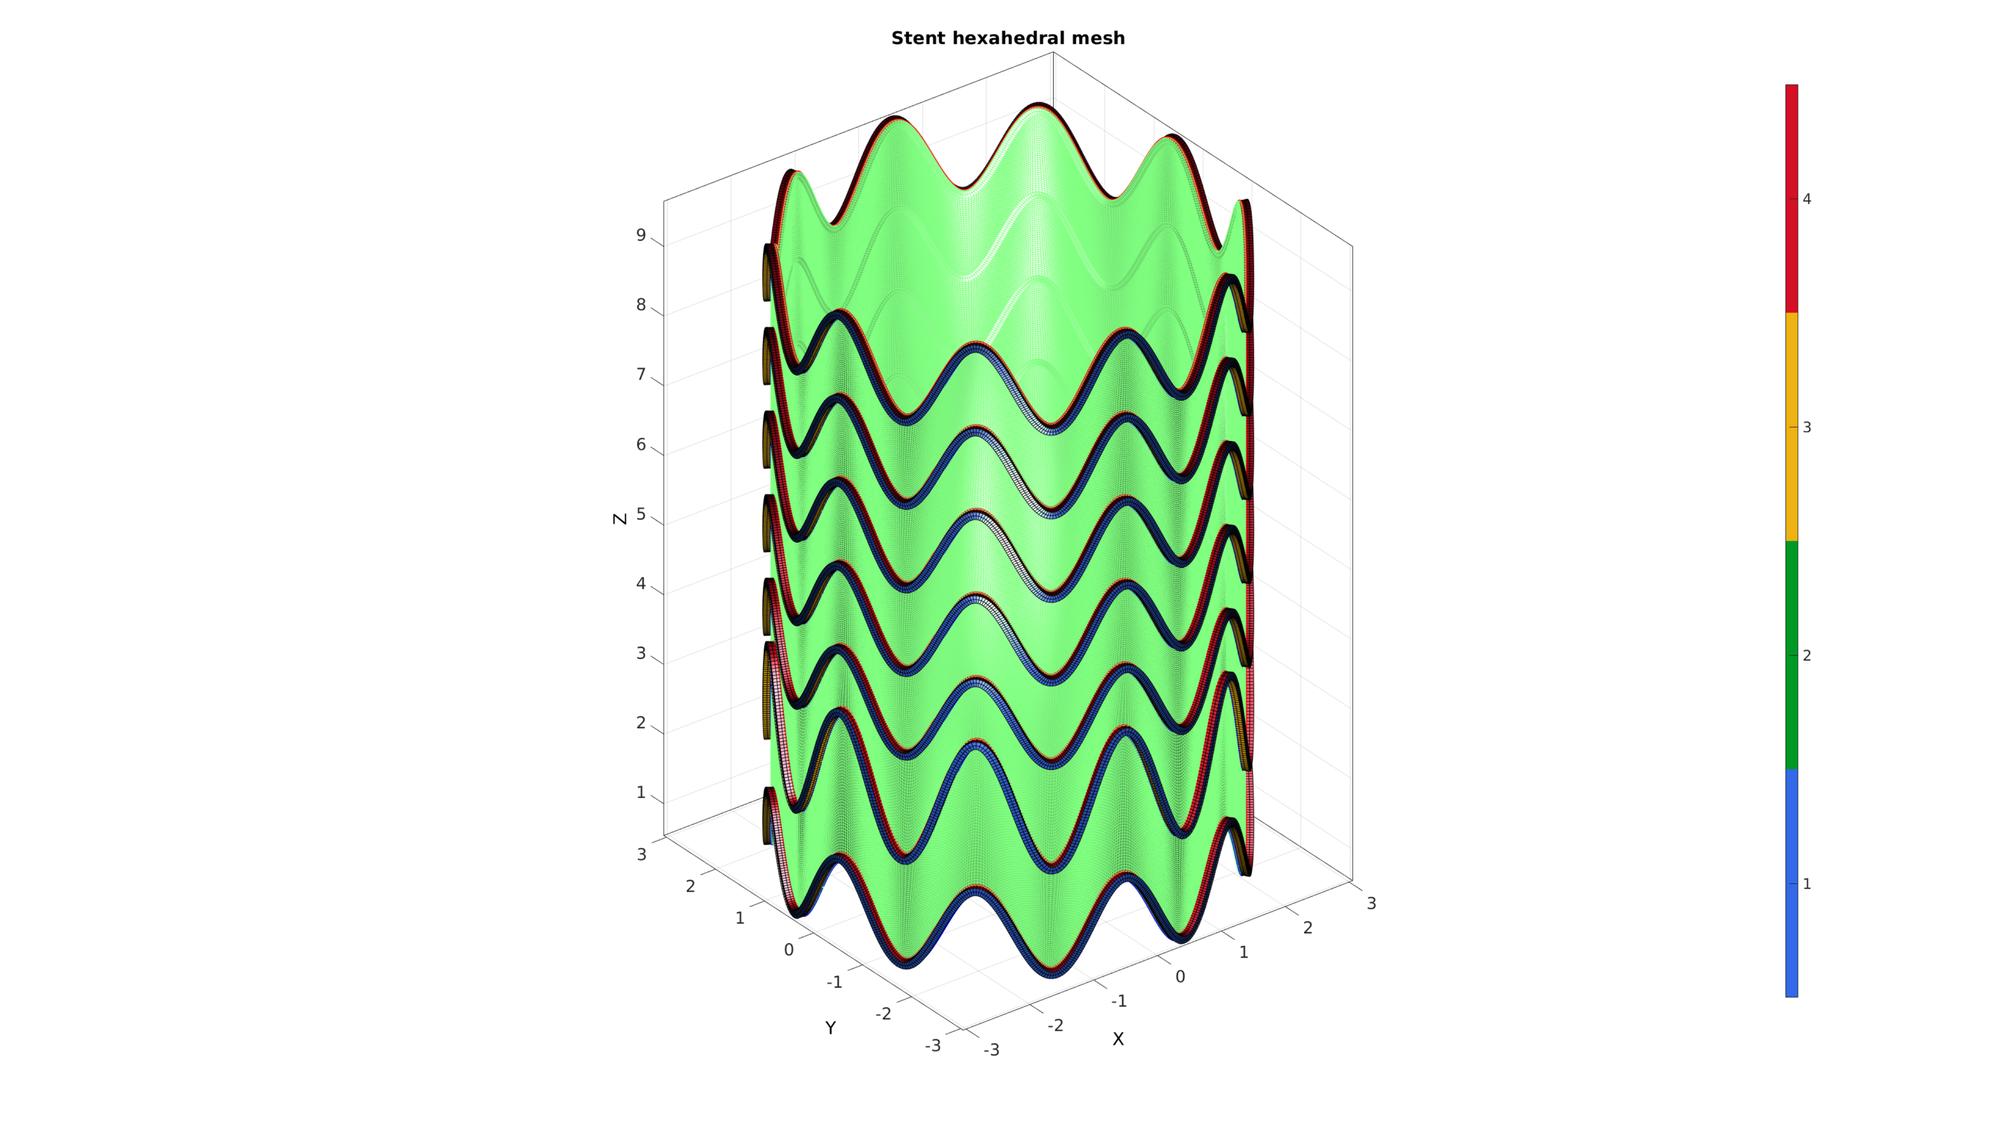
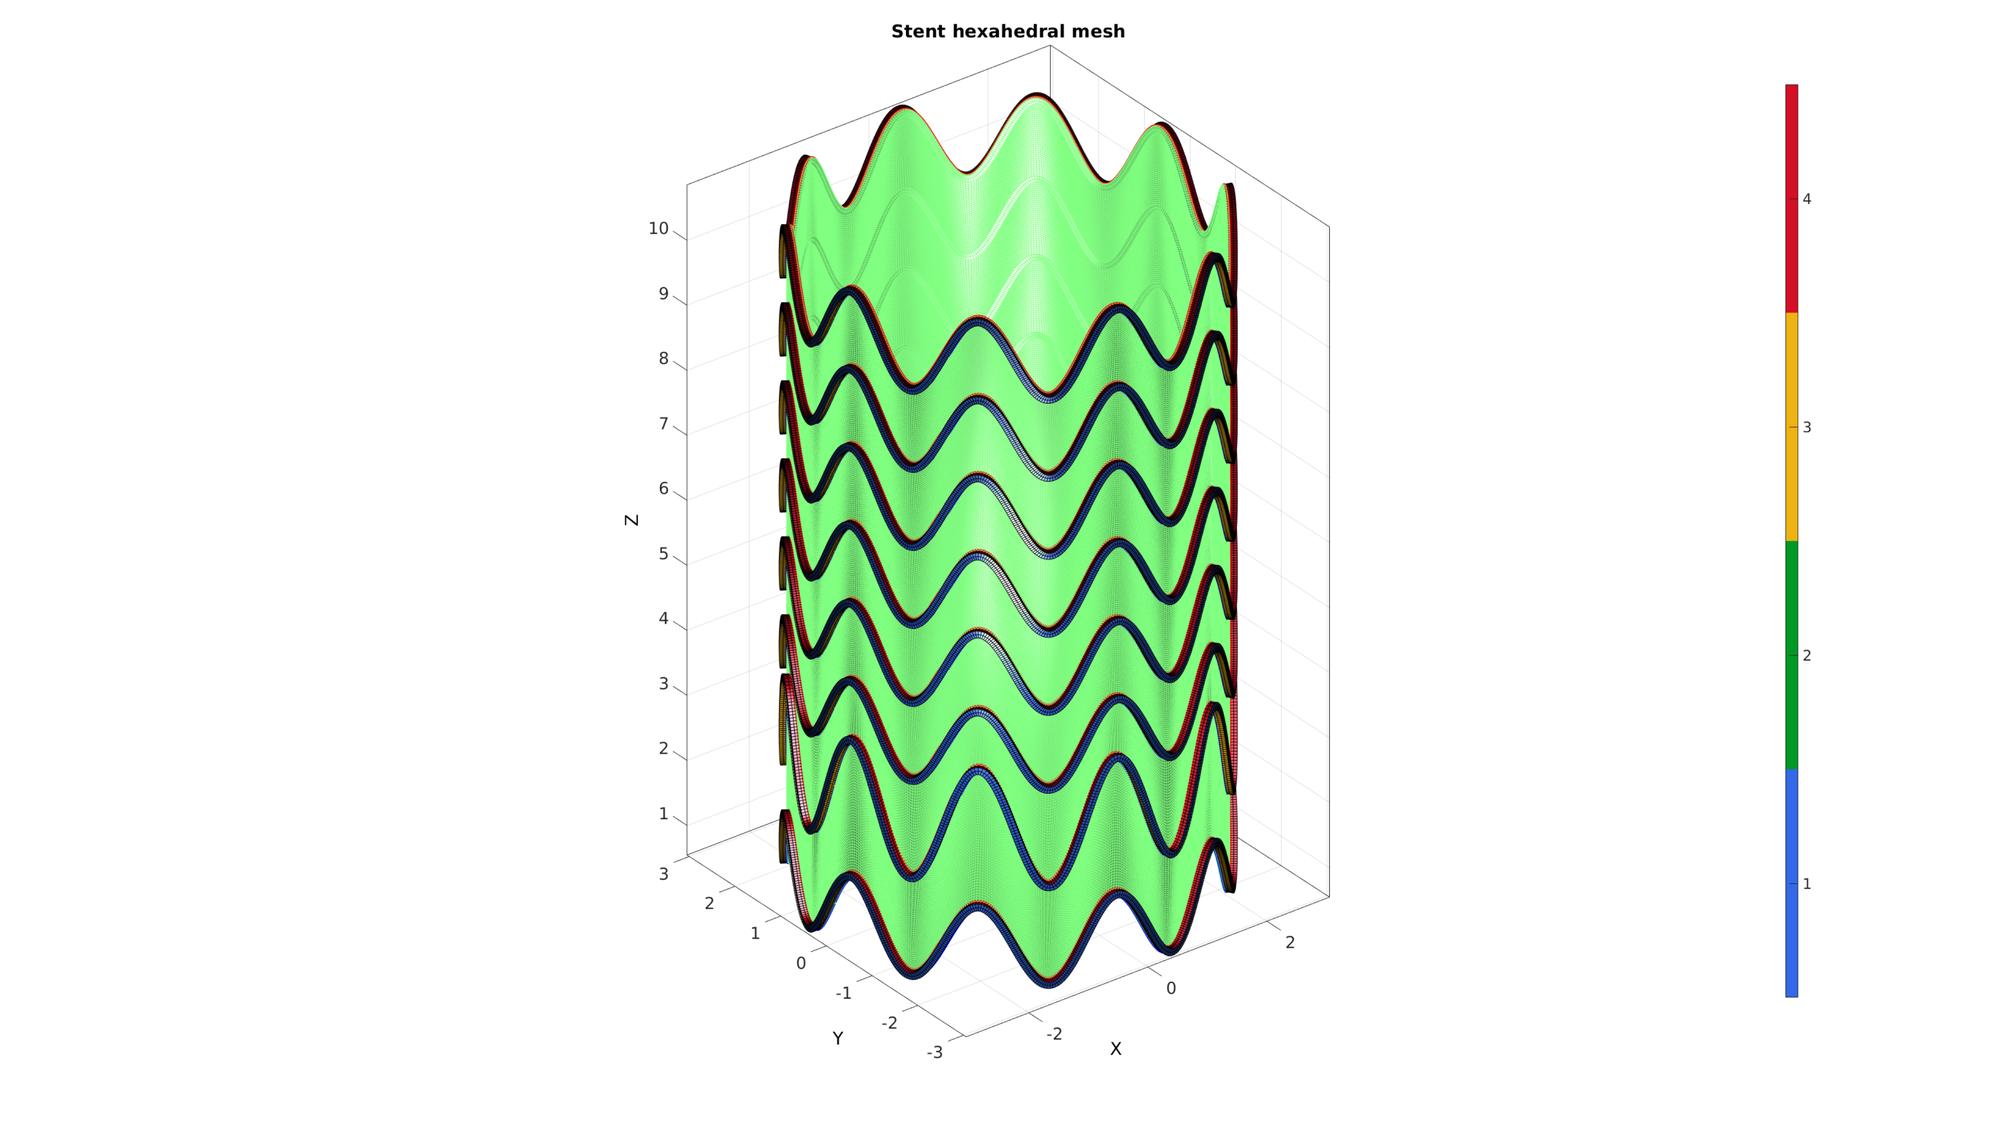
numSegments=8;
waveAmplitudes=0.6*ones(1,numSegments);
waveAmplitudes(2)=0.9;
offsetLevels=waveAmplitudes*2;

offSetTotal=0;

cFigure; hold on;
title('Stent hexahedral mesh','fontSize',fontSize);
colormap(gjet(4)); caxis([1 4]); icolorbar;
axisGeom;
camlight headlight;
drawnow;

E_stent_cell=cell(numSegments,1);
V_stent_cell=cell(numSegments,1);
E_sheet_cell=cell(numSegments,1);
V_sheet_cell=cell(numSegments,1);
for q=1:1:numSegments
    controlParameterSet.waveAmplitude=waveAmplitudes(q); %Amplitude of the sinusoidal modulation
    [E,V]=stentSegmentDesign(controlParameterSet);

    offSetTotal=offSetTotal+offsetLevels(q);
    V(:,3)=V(:,3)+offSetTotal;
    C=hexVol(E,V); %Get hexahedral element volumes

    [F,CF]=element2patch(E,C); %Create face data for plotting

    [indBoundary]=tesBoundary(F,V);
    faceMarker=ones(size(E,1),1)*(1:6); %The 6 face colors for the hexahedral faces
    faceMarker=faceMarker(:); %Force as a column
    Fb=F(indBoundary,:); %Select the boundary faces (which will exclude tops (1) and bottoms (2))
    faceBoundaryMarker=faceMarker(indBoundary,:)-2; %Get boundary colors and subtract 2 so they are 1-4
gpatch(Fb,V,faceBoundaryMarker,'k',1);
    F_inner = Fb(faceBoundaryMarker==2,:);
    [edgesBoundaryInner]=patchBoundary(F_inner,V);

    edgesBottom=F_inner(:,[4 1]);
    edgesTop=F_inner(:,[2 3]);

    edgesBoundaryInnerTop=edgesBoundaryInner(all(ismember(edgesBoundaryInner,edgesTop),2),:);
    edgesBoundaryInnerBottom=edgesBoundaryInner(all(ismember(edgesBoundaryInner,edgesBottom),2),:);

    indCurveTop=edgeListToCurve(edgesBoundaryInnerTop);
    indCurveTop=flip(indCurveTop(1:end-1));
    indCurveBottom=edgeListToCurve(edgesBoundaryInnerBottom);
    indCurveBottom=indCurveBottom(1:end-1);

    plotV(V(indCurveTop(:),:),'r-','LineWidth',lineWidth);
    plotV(V(indCurveBottom(:),:),'b-','LineWidth',lineWidth);

    drawnow;
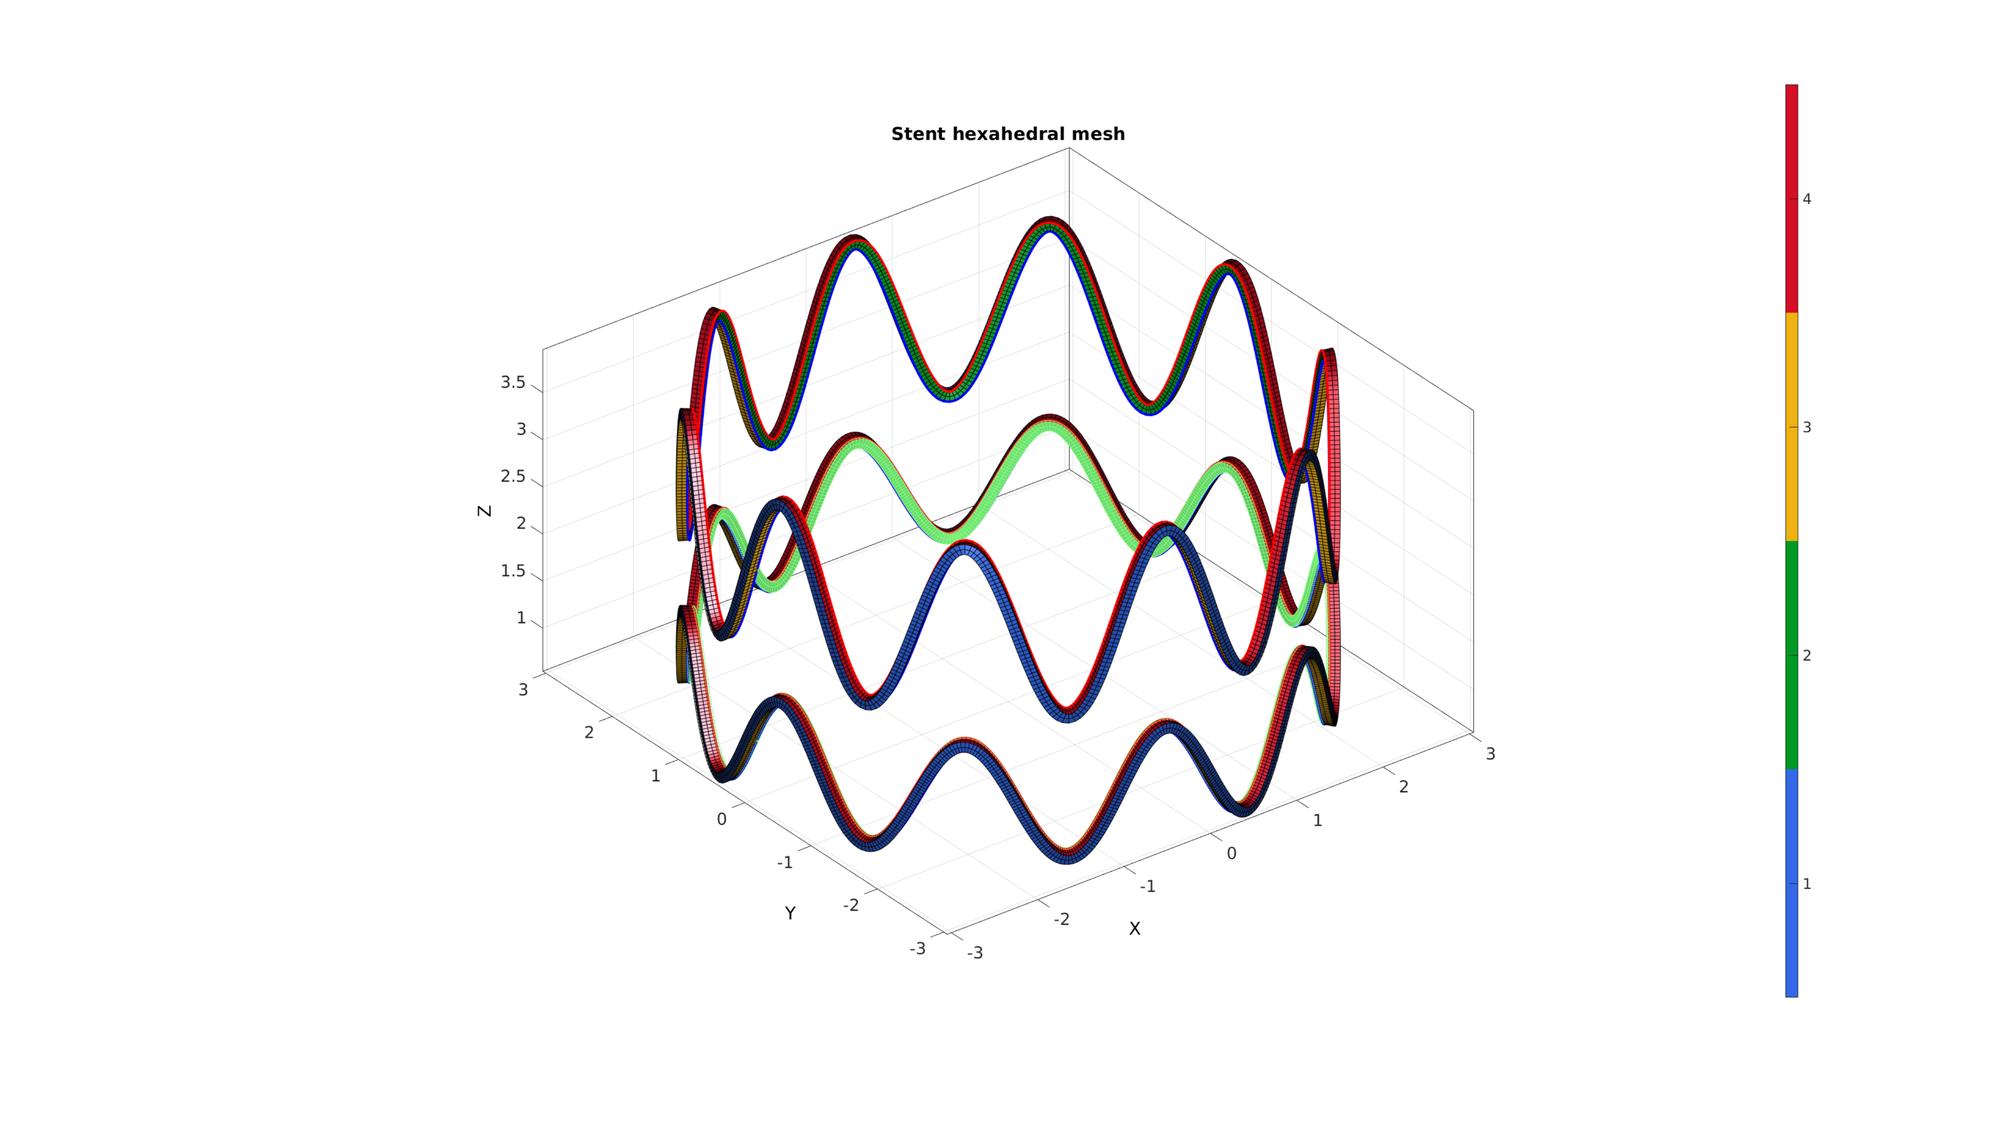
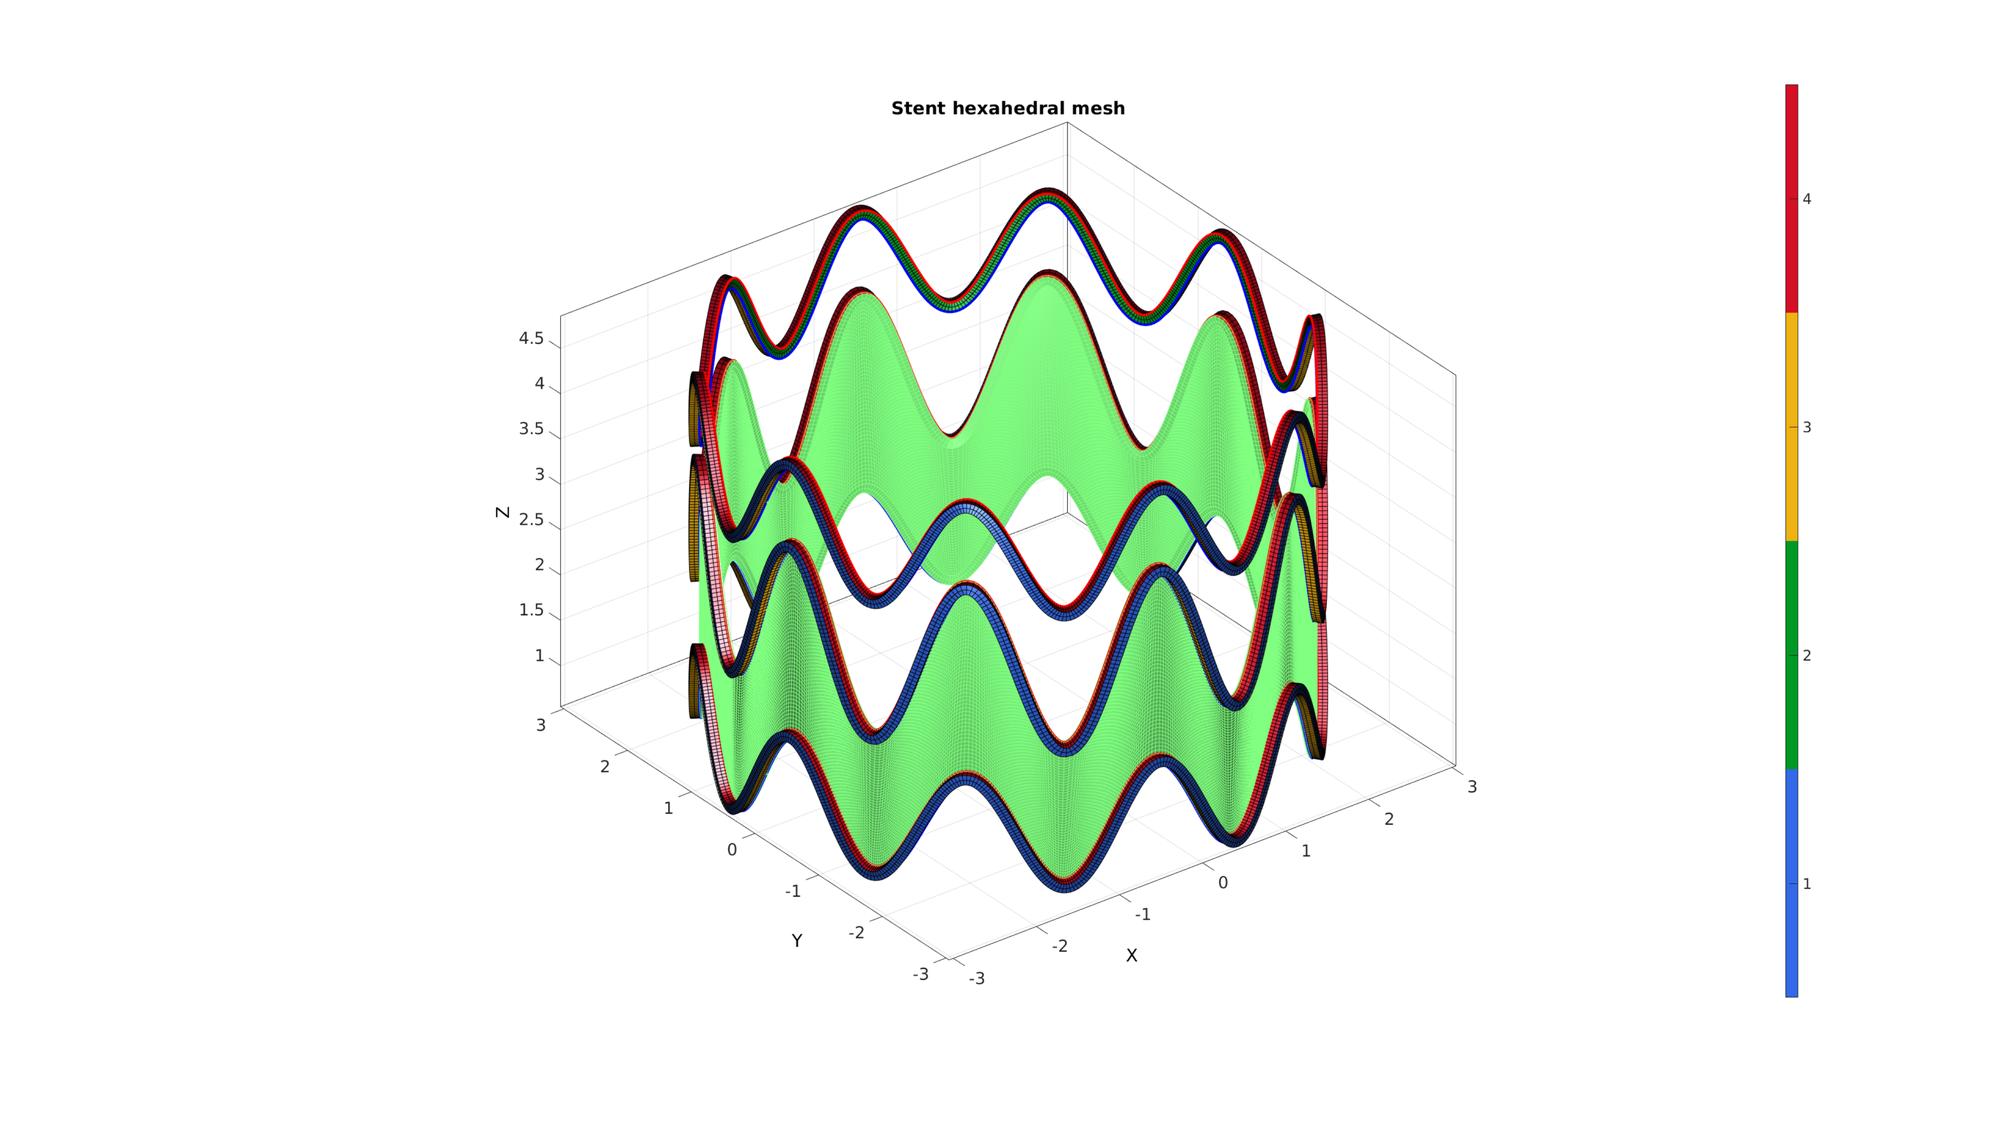

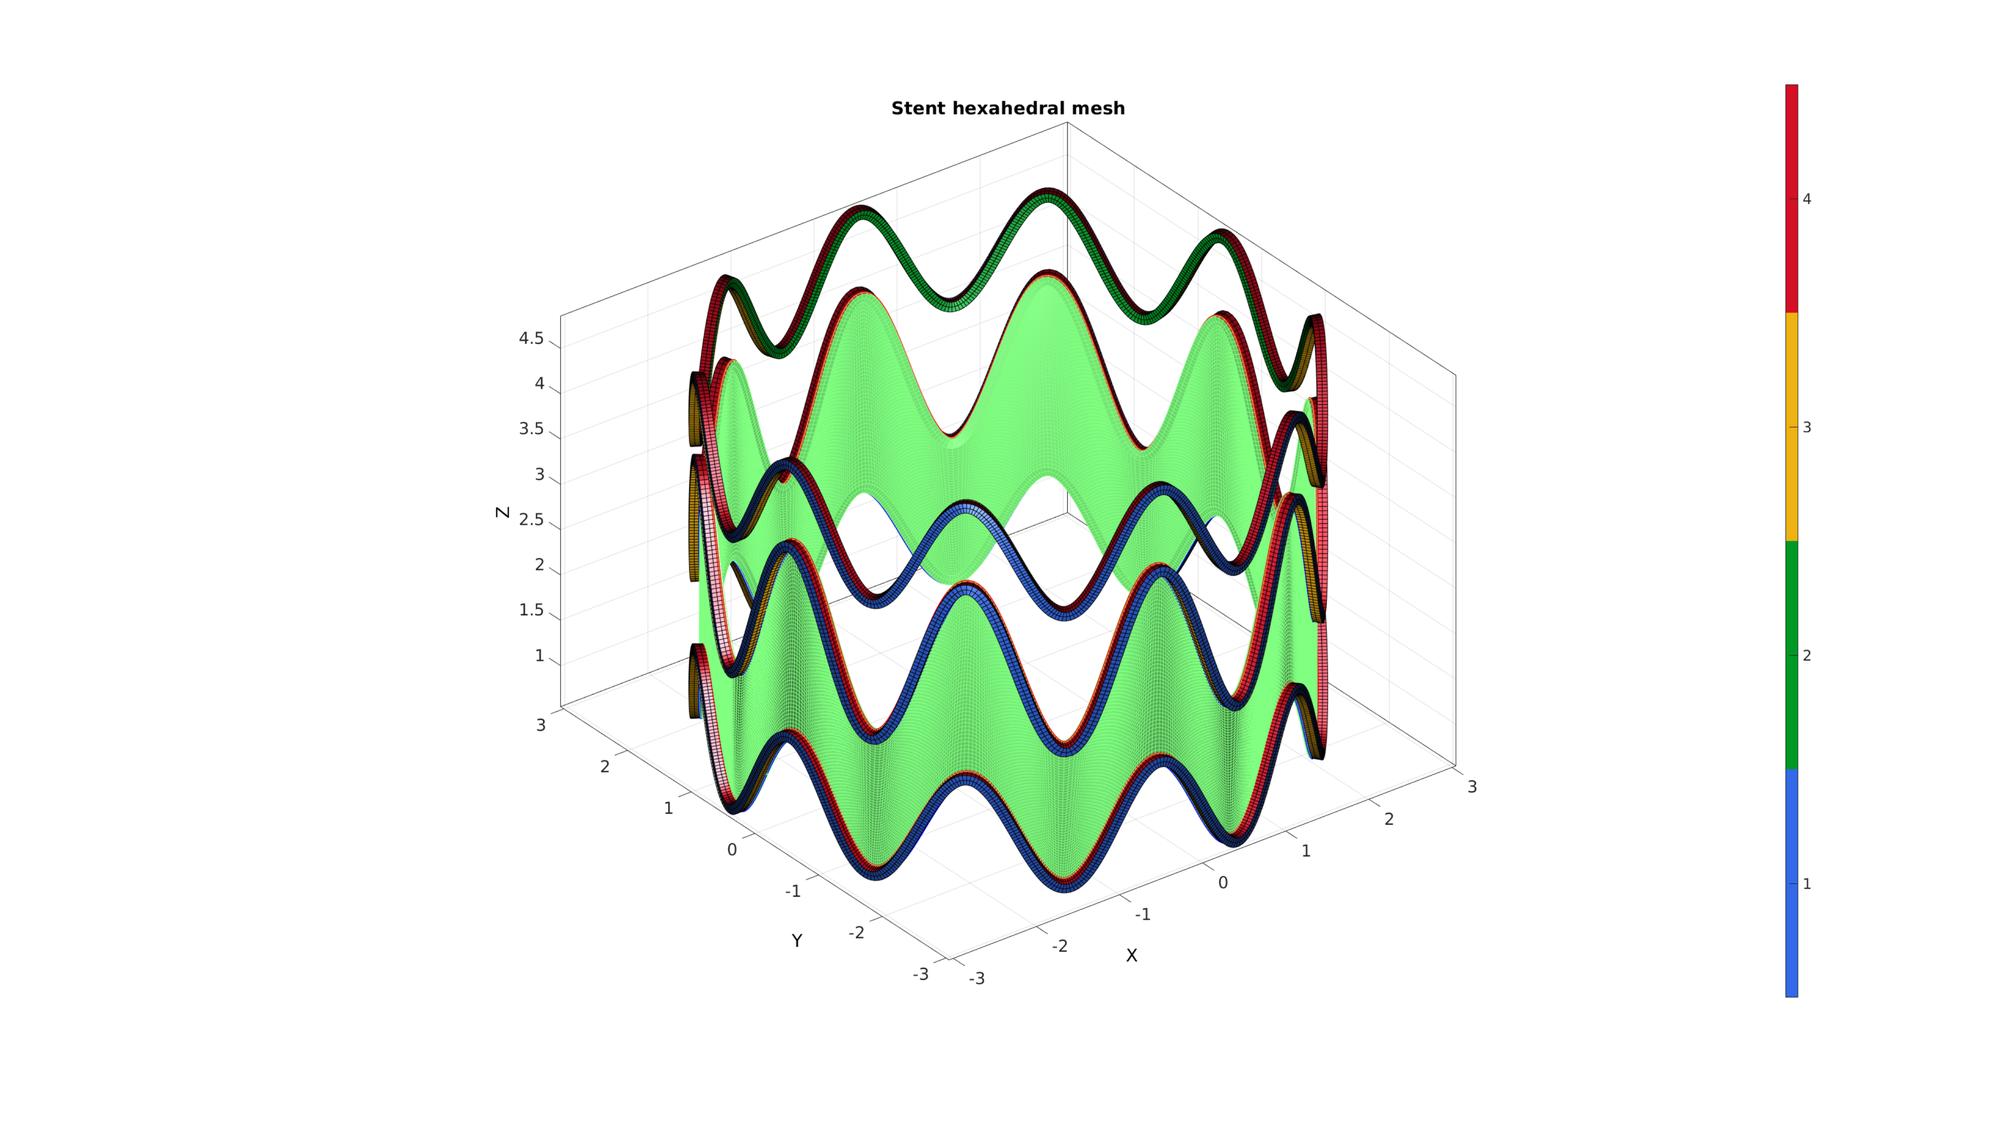
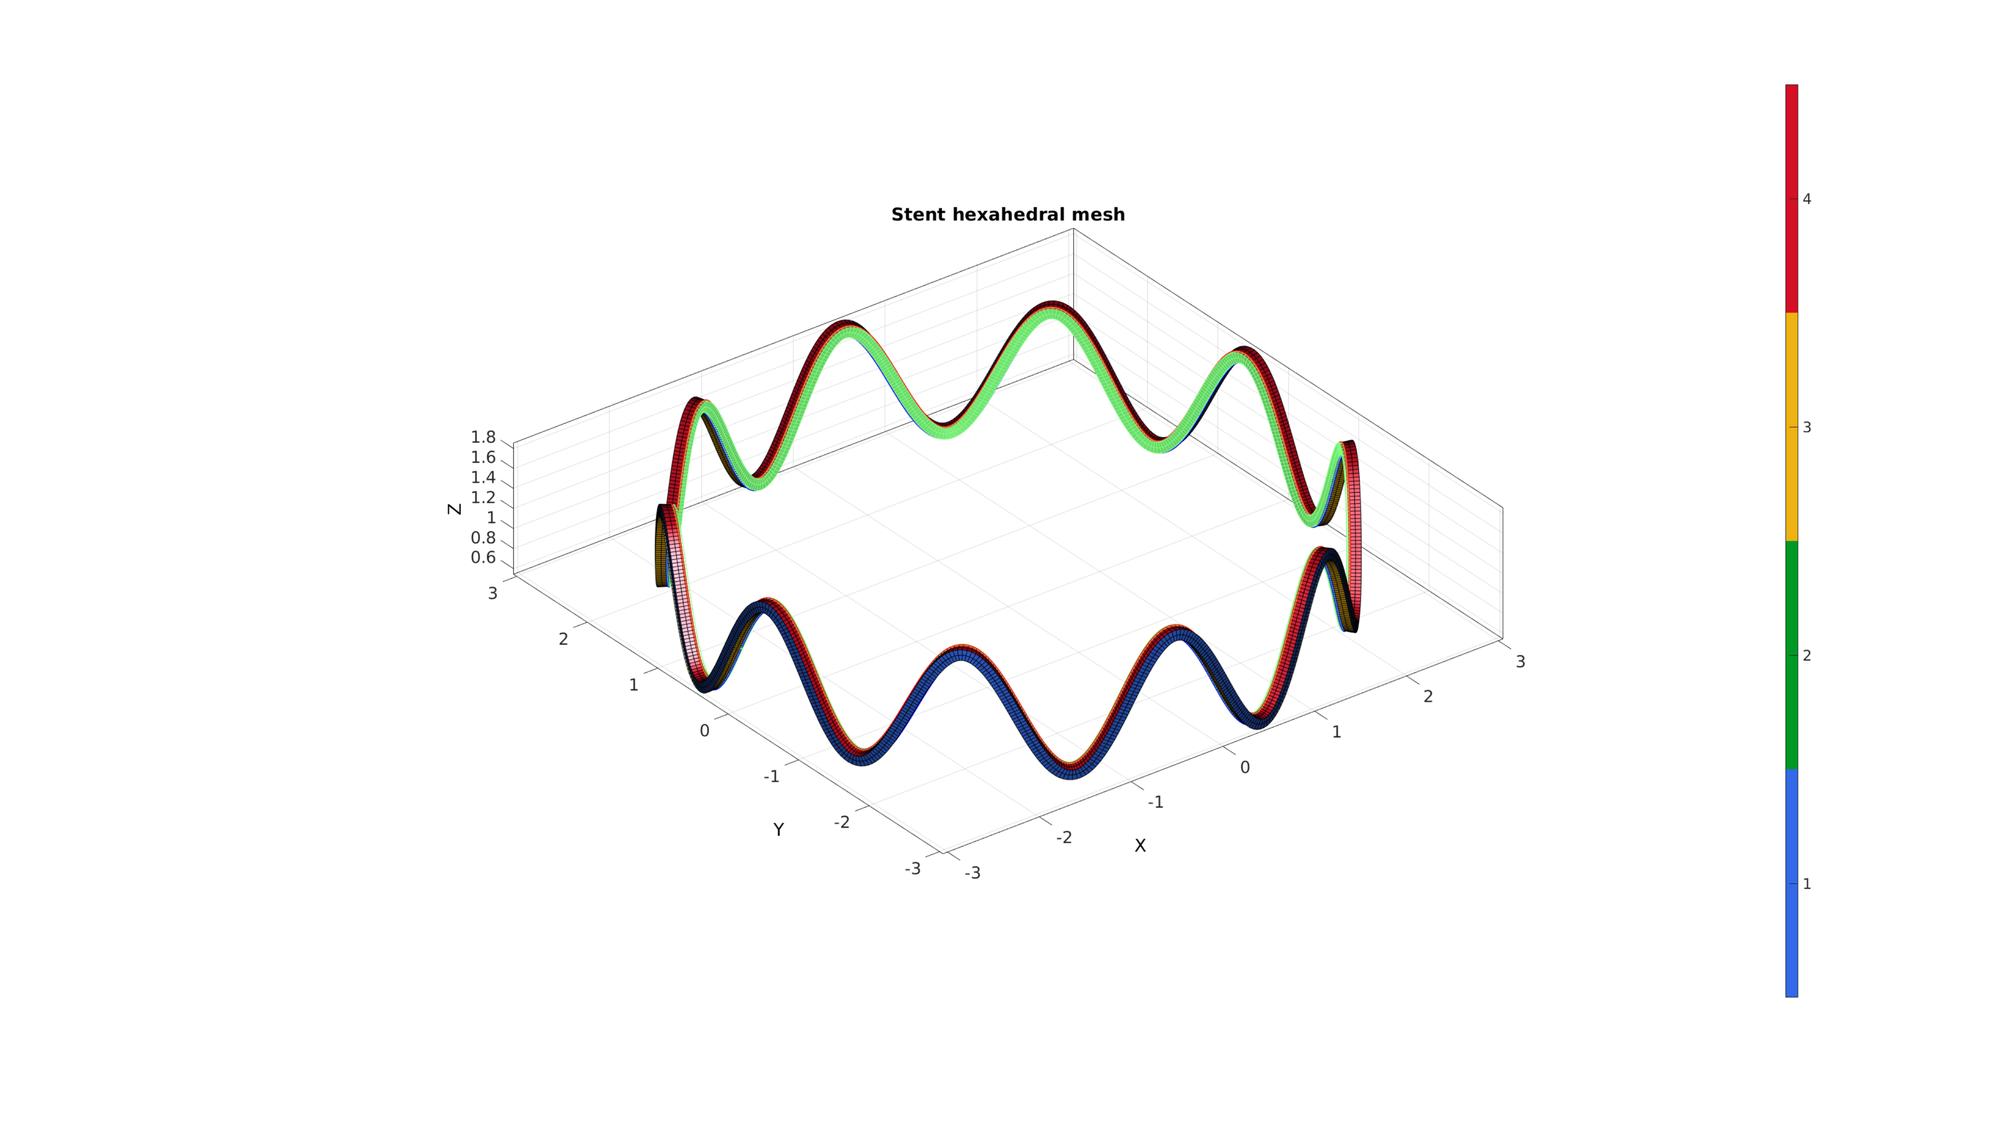
   if q==1
       [FQ,VQ]=patchCleanUnused(F_inner,V);
   else
       cPar.closeLoopOpt=1;
       cPar.patchType='quad';
       [Fq,Vq]=polyLoftLinear(V_curveTopPrevious,V(indCurveBottom(:),:),cPar);
%        gpatch(Fq,Vq,'rw','rw',1);
       [F_inner_clean,V_inner_clean]=patchCleanUnused(F_inner,V);
       [FQ,VQ]=joinElementSets({Fq,F_inner_clean},{Vq,V_inner_clean});
       [FQ,VQ]=mergeVertices(FQ,VQ);
%        gpatch(FQ,VQ,'rw','rw',1);
%        patchNormPlot(FQ,VQ);
   end

   [E_sheet,V_sheet,Fq1,Fq2]=quadThick(FQ,VQ,1,sheetLayerThickness,numStepsSheet);

   [F_sheet]=element2patch(E_sheet); %Create face data for plotting
   gpatch(F_sheet,V_sheet,'gw','gw',1);
   %        patchNormPlot(F_sheet,V_sheet);

   E_sheet_cell{q}=E_sheet;
   V_sheet_cell{q}=V_sheet;

   V_curveTopPrevious=V(indCurveTop(:),:);

   E_stent_cell{q}=E;
   V_stent_cell{q}=V;
end
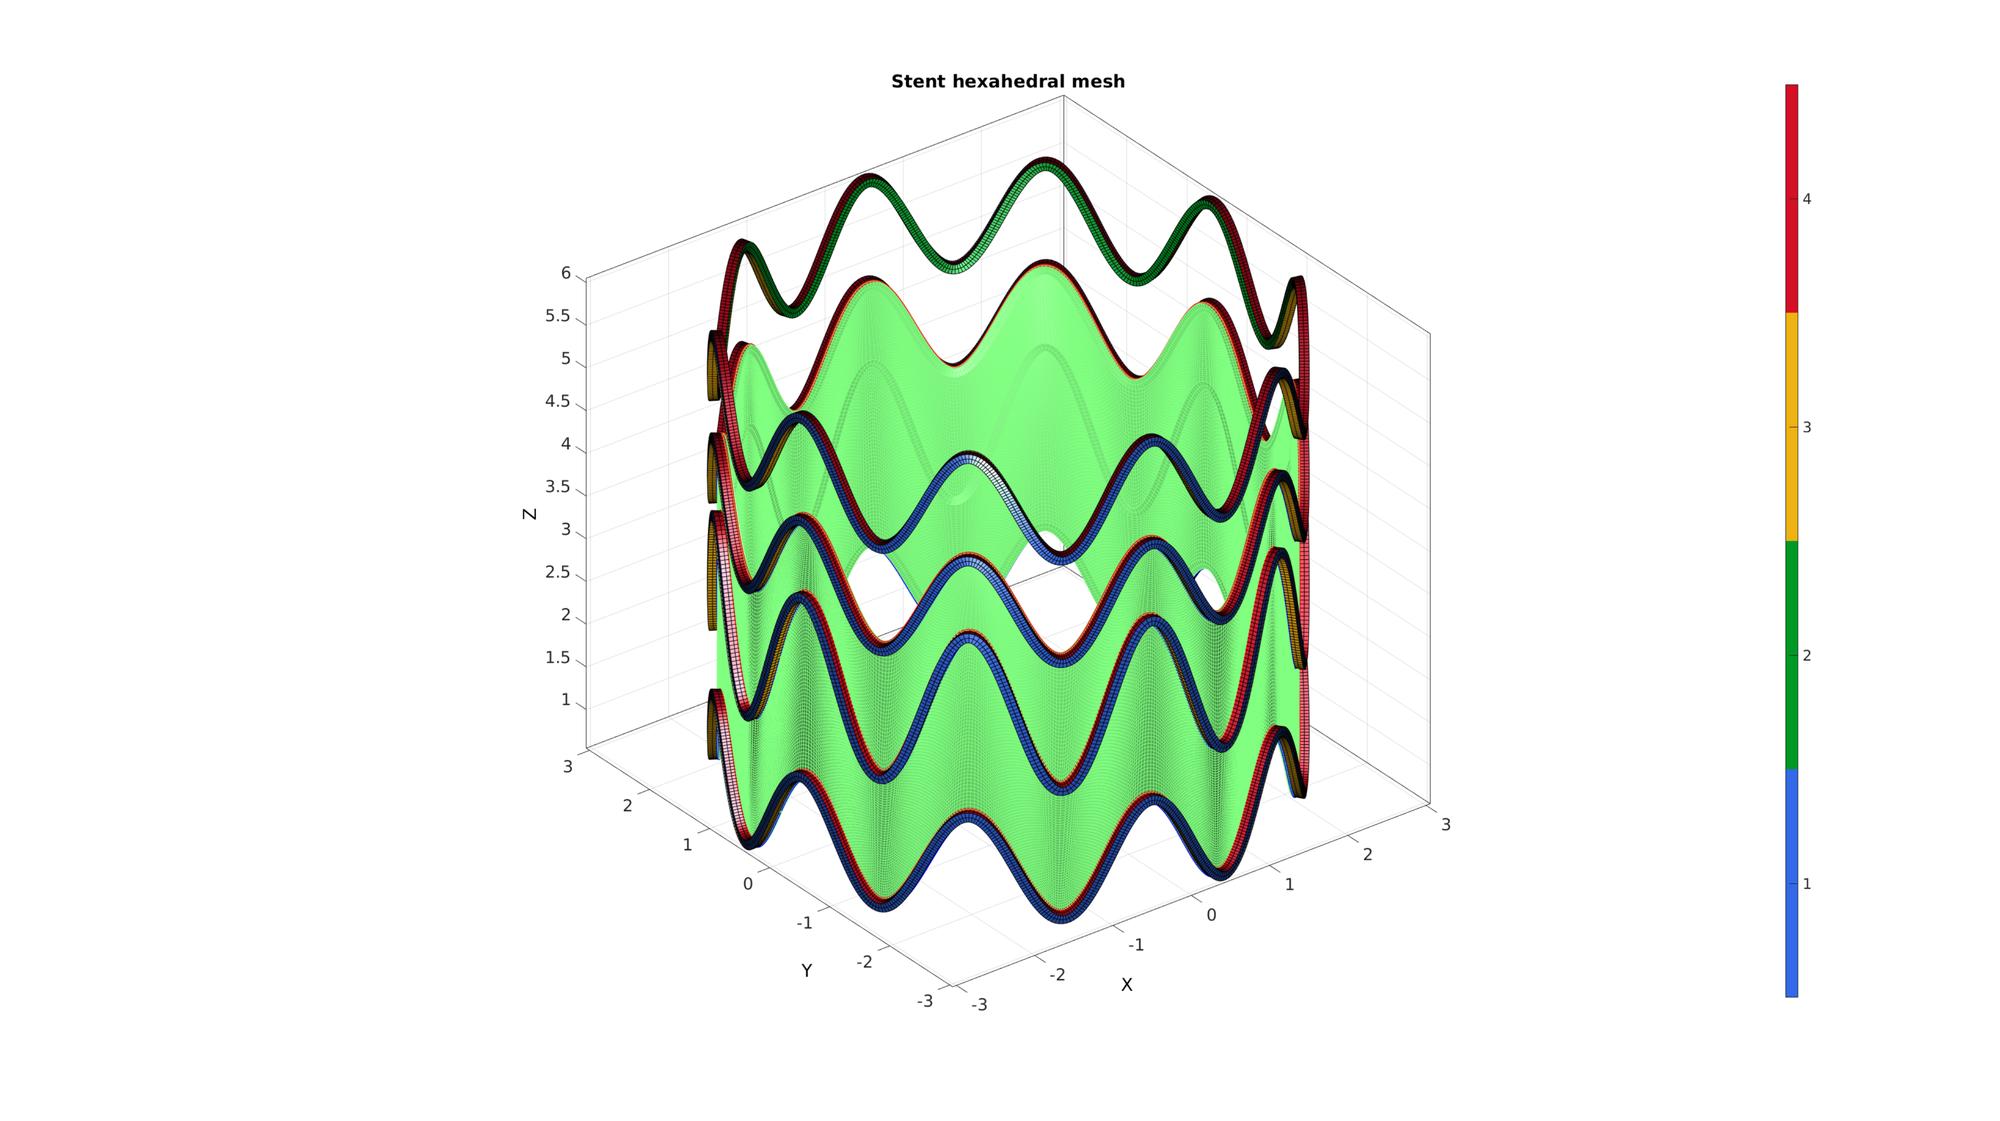
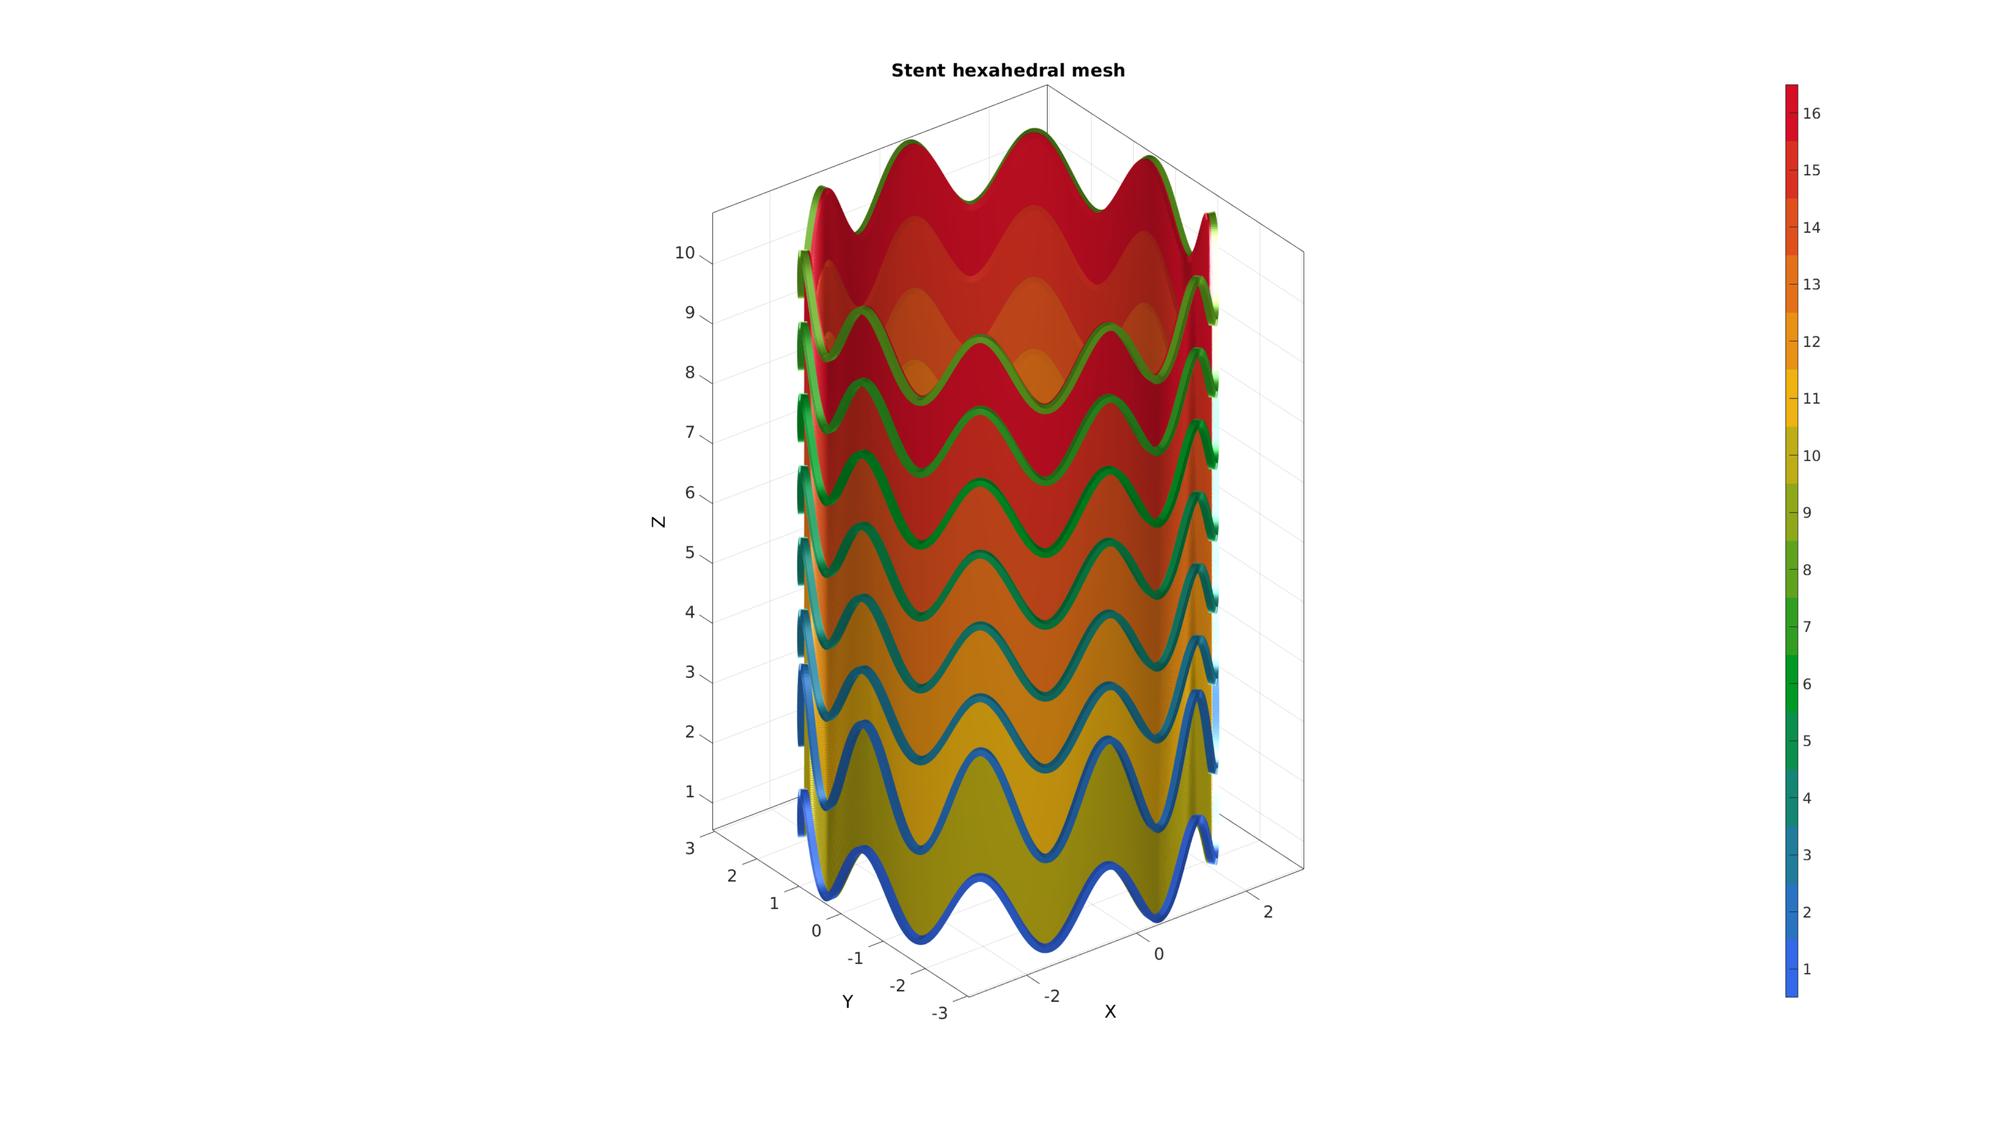
Merge components
[E_stent,V_stent,C_stent]=joinElementSets(E_stent_cell,V_stent_cell);
[E_sheet,V_sheet,C_sheet]=joinElementSets(E_sheet_cell,V_sheet_cell);
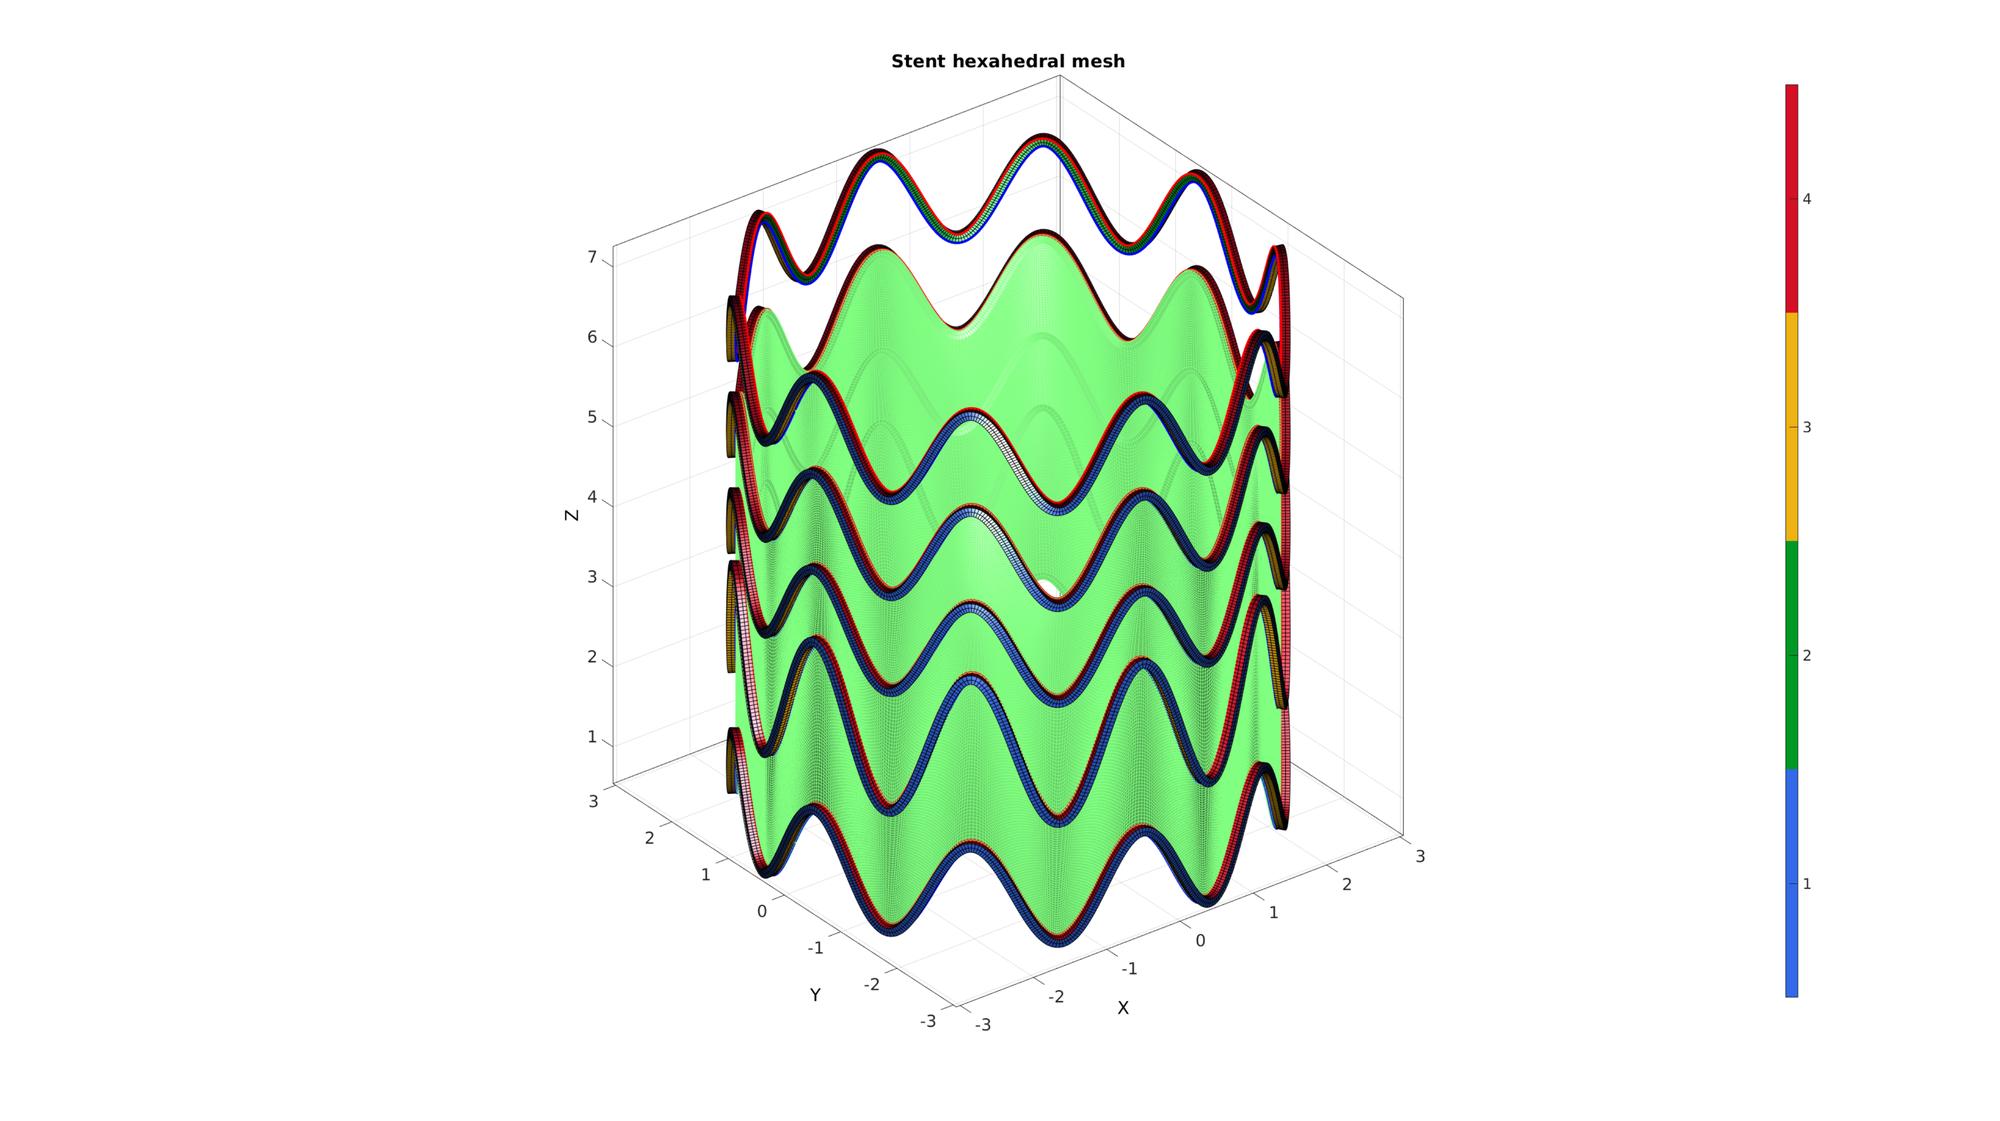
[E,V,C]=joinElementSets({E_stent,E_sheet},{V_stent,V_sheet},{C_stent,C_sheet+max(C_stent)});
[E,V]=mergeVertices(E,V);
[F,CF]=element2patch(E,C); %Create face data for plotting
cFigure; hold on;
title('Stent hexahedral mesh','fontSize',fontSize);
gpatch(F,V,CF,'none',1);
% patchNormPlot(F,V);
colormap gjet; icolorbar
axisGeom;
camlight headlight;
drawnow;
Export inp file
elementStruct.E=E; elementStruct.E_ind=(1:size(E,1))'; elementStruct.E_type='*ELEMENT, TYPE=C3D8, ELSET=PART-STENT'; nodeStruct.N=V; nodeStruct.N_ind=(1:size(V,1))';
pathName = fileparts(fileparts(mfilename('fullpath'))); fileName=fullfile(pathName,'data','INP','stentMeshSheet.inp'); export_INP(elementStruct,nodeStruct,fileName);
FUNCTIONS
function [E,V]=stentSegmentDesign(controlParameterSet)
parse input
stentRadius=controlParameterSet.stentRadius; %The outer radius of the stent
numPeriodsWave=controlParameterSet.numPeriodsWave; %The number of periods to use for a sinusoidal modulation
waveAmplitude=controlParameterSet.waveAmplitude; %Amplitude of the sinusoidal modulation
stentSectionHeight=controlParameterSet.stentSectionHeight; %Height of the stent wire
stentSectionWidth=controlParameterSet.stentSectionWidth; %Width of the stent wire
numStepsCircumference=controlParameterSet.numStepsCircumference; %Number of sweeping steps across curve
overSampleFactorCurve=controlParameterSet.overSampleFactorCurve; %Oversample factor curve
numSplitSteps_axial=controlParameterSet.numSplitSteps_axial;
numSplitSteps_inward=controlParameterSet.numSplitSteps_inward;
plotOn=controlParameterSet.plotOn;
plot settings
if plotOn==1
    fontSize=25;
    markerSize=10;
    lineWidth=1;
end
Build stent section
The rectangular stent wire section is created here.
V_section=[-stentSectionWidth/2  stentSectionHeight/2 0; ...
    stentSectionWidth/2  stentSectionHeight/2 0; ...
    stentSectionWidth/2 -stentSectionHeight/2 0; ...
    -stentSectionWidth/2 -stentSectionHeight/2 0; ...
    ];
V=isualize stent section
if plotOn==1
    cFigure; hold on;
    title('Stent section','fontSize',fontSize);
    plotV(V_section,'b.-','lineWidth',lineWidth,'MarkerSize',markerSize);
    view(2); axis tight; axis equal; grid on; box on;
    set(gca,'fontSize',fontSize);
    drawnow;
end
Create guide curve
The sweepLoft (see HELP_sweepLoft) is created here. First and angle based parameterization is created. Next this curve is evenly sample across the curve length (see HELP_evenlySampleCurve).
t=linspace(0,2*pi,numStepsCircumference*overSampleFactorCurve); %Angles
t=t(1:end-1); %Remove last point so it is not closed for resampling
x=stentRadius.*sin(t); %x-coordinates
y=stentRadius.*cos(t); %y-coordinates
z=waveAmplitude.*sin(numPeriodsWave*t); %z-coordinates
V_guide_curve=[x(:) y(:) z(:)]; %Collected curve nodes
[V_guide_curve] = evenlySampleCurve(V_guide_curve,numStepsCircumference-1,'pchip',1); %Resample curve evenly
V_guide_curve(end+1,:)=V_guide_curve(1,:); %Append start to end so it is a closed loop
Visualize guide curve
if plotOn==1
    cFigure; hold on;
    title('Stent guide curve','fontSize',fontSize);
    plotV(V_guide_curve,'k.-','lineWidth',lineWidth,'MarkerSize',markerSize);
    axisGeom;
    drawnow;
end
Position stent section at the start and end of the guide curve
Next the section is translated and rotated so it is placed at the start of the guide curve such that the curve normal points allong the curve.
% Create rotation matrix
n3=vecnormalize(V_guide_curve(2,:)-V_guide_curve(1,:)); %Out of section normal direction z ish direction
[~,indMin]=min(dot(n3(ones(1,2),:),[1 0 0; 0 1 0],2)); %Get index most appropriate initial other axis
switch indMin
    case 1
        n1=[1 0 0]; %Initialized x direction
        n2=vecnormalize(cross(n3,n1)); %y ish direction
        n1=vecnormalize(cross(n2,n3)); %Proper x ish direction
        R=[n1; n2; n3]; %Rotation matrix
    case 2
        n2=[0 1 0]; %Initialized y direction
        n1=vecnormalize(cross(n2,n3)); %x ish direction
        n2=vecnormalize(cross(n3,n1)); %Proper y ish direction
        R=[n1; n2; n3]; %Rotation matrix
end

p1=V_guide_curve(1,:); %The start node
V_section=V_section*R; %Rotate the section
V_section=V_section+p1(ones(size(V_section,1),1),:); % Translate coordinate to start
Visualize guide curve
if plotOn==1
    cFigure; hold on;
    title('Stent section positioned on guide curve','fontSize',fontSize);
    plotV(V_guide_curve,'k-','lineWidth',1);
    plotV(V_section,'k.-','lineWidth',lineWidth,'MarkerSize',markerSize);
    quiverVec(p1,n1,1,'r');
    quiverVec(p1,n2,1,'g');
    quiverVec(p1,n3,1,'b');
    axisGeom;
    drawnow;
end
Sweeping section allong curve
Normally sweepLoft produces patch data as an output (e.g. faces and vertices). However these outputs are supressed here and the coordinate mesh output is instead used to create a hexahedral mesh. See also HELP_sweepLoft
numTwist=0; %Number of additional twists of loft feature around guide curve
numStepsSweep=numStepsCircumference; %Number of steps for loft feature from sketch 1 to sketch 2
[~,~,~,S]=sweepLoft(V_section,V_section,n3,n3,V_guide_curve,numStepsSweep,numTwist,0);
Construct hexahedral mesh
X=S.X'; Y=S.Y'; Z=S.Z'; %Coordinate matrices
V=[X(:) Y(:) Z(:)]; %Create node list

F=reshape((1:1:size(V,1)),4,size(V,1)/4)'; %All top and bottom faces
E=[F(2:end,:) F(1:end-1,:)]; %The hexahedral elements
[E,V]=mergeVertices(E,V); %Merge nodes (start and end are not shared yet)
Refine mesh
The swept mesh can be refined through slitting. The splitting can be homogeneous or only in a particular direction (see HELP_subHex|) Split method explanation: 1: Overall splitting in all directions 2: Split allong curve direction 3: Split axially 4: Splint inward
splitMethod=3;
nRefine=numSplitSteps_axial;
[E,V]=subHex(E,V,nRefine,splitMethod);

splitMethod=4;
nRefine=numSplitSteps_inward;
[E,V]=subHex(E,V,nRefine,splitMethod);
Visualize hexahedral mesh
if plotOn==1

    [F]=element2patch(E); %Create face data for plotting

    cFigure; hold on;
    title('Stent hexahedral mesh','fontSize',fontSize);
    plotV(V_guide_curve,'k-','lineWidth',3);
    gpatch(F,V,'gw','k',1);
    patchNormPlot(F,V);
    axisGeom;
    camlight headlight;
    drawnow;
end
end
GIBBON footer text
License: https://github.com/gibbonCode/GIBBON/blob/master/LICENSE
GIBBON: The Geometry and Image-based Bioengineering add-On. A toolbox for image segmentation, image-based modeling, meshing, and finite element analysis.
Copyright (C) 2019 Kevin Mattheus Moerman
This program is free software: you can redistribute it and/or modify it under the terms of the GNU General Public License as published by the Free Software Foundation, either version 3 of the License, or (at your option) any later version.
This program is distributed in the hope that it will be useful, but WITHOUT ANY WARRANTY; without even the implied warranty of MERCHANTABILITY or FITNESS FOR A PARTICULAR PURPOSE. See the GNU General Public License for more details.
You should have received a copy of the GNU General Public License along with this program. If not, see http://www.gnu.org/licenses/.