DEMO_additional_colormaps
Below is a demonstration for:
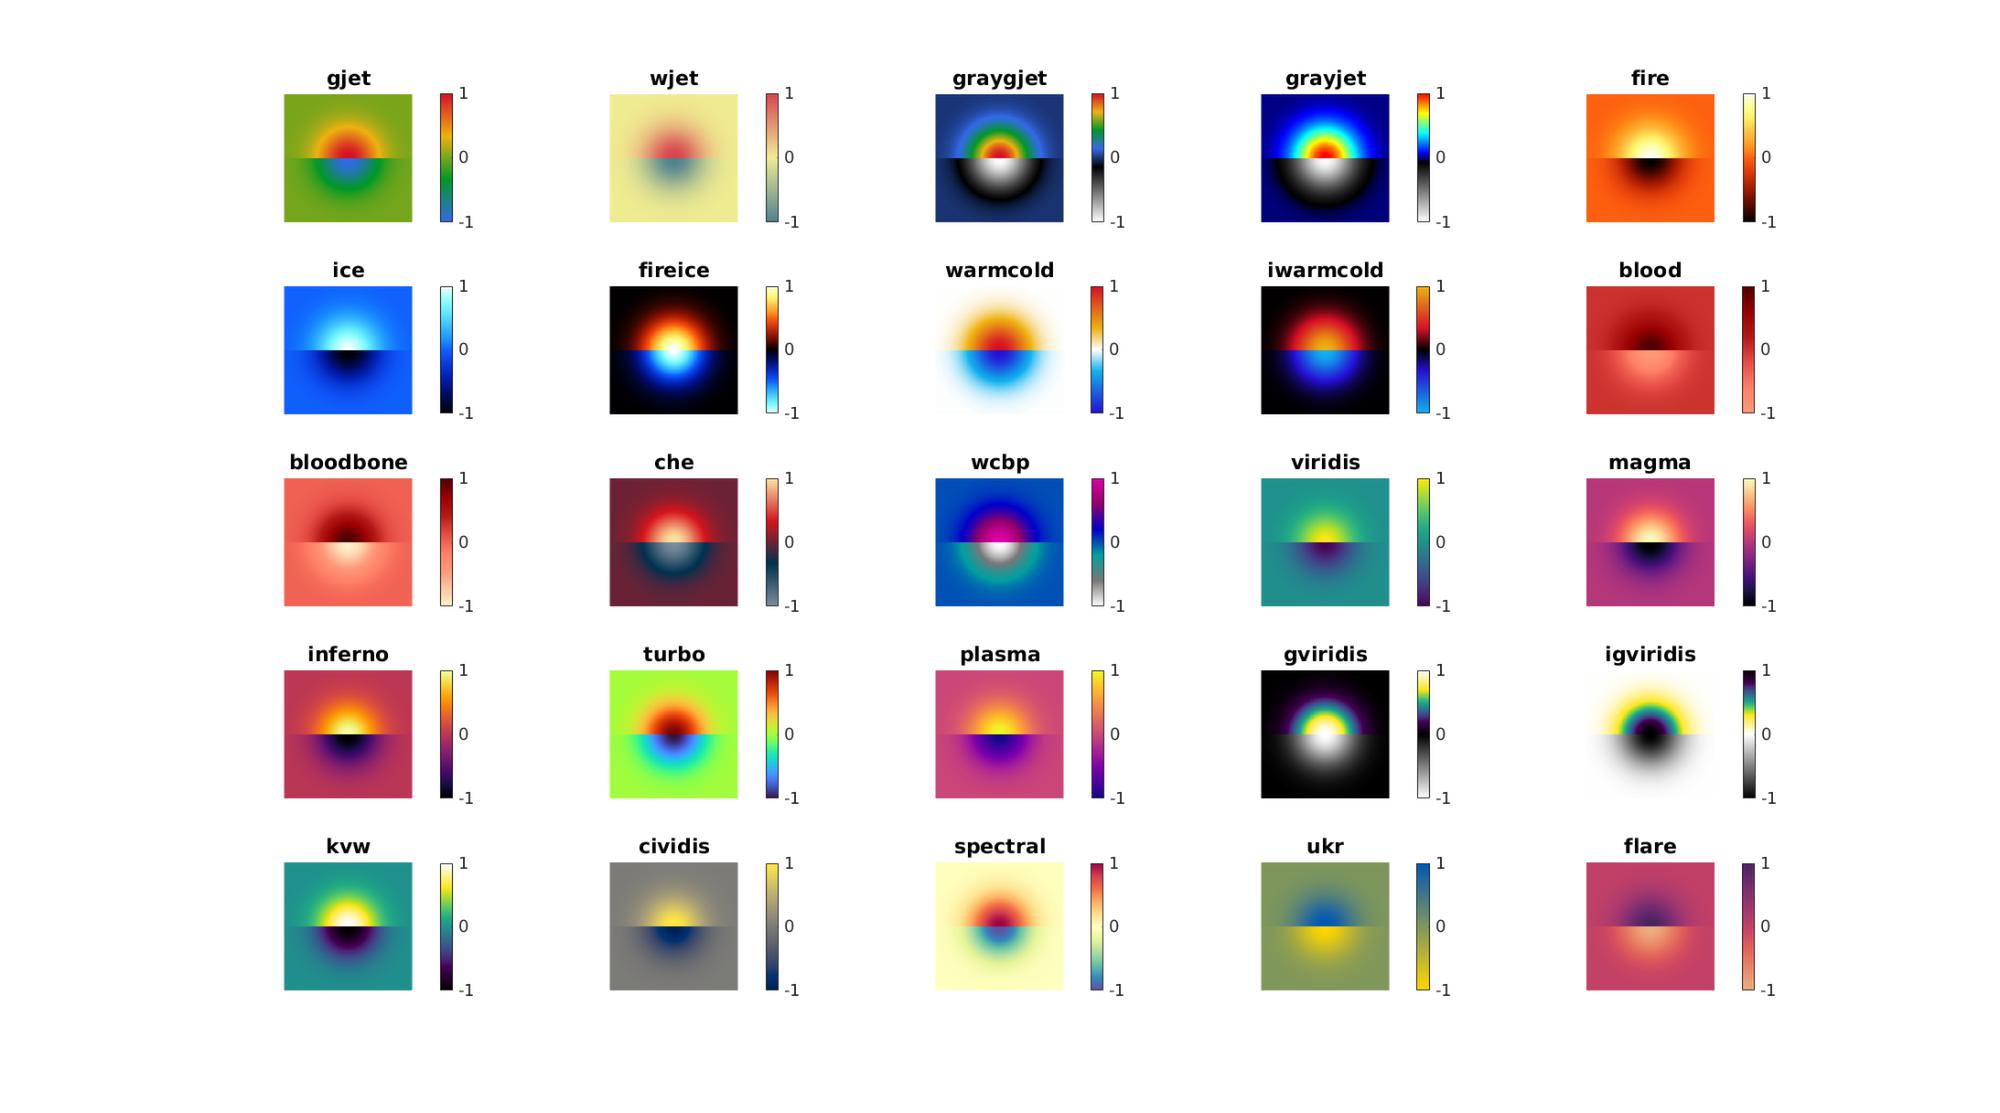
- Additional colormaps available in GIBBON
Contents
clear; close all; clc;
%Plot settings
fontSize=15;

% Create example data for visualizations
n=250;
s=1;
[X,Y]=ndgrid(linspace(-3*s,3*s,n));
Z=exp( -0.5.*((X./s).^2+(Y./s).^2));
Z=Z./max(Z(:));
Z(X<0)=-Z(X<0);
colorLim=[-1 1];
colormapset={'gjet','wjet','graygjet','grayjet',...
    'fire','ice','fireice','warmcold','iwarmcold','blood','bloodbone',...
    'che','wcbp','viridis','magma','inferno','turbo',...
    'plasma','gviridis','igviridis','kvw','cividis','spectral','ukr','flare'};
The gibbon color maps
Visualizing all additional color maps
n1=floor(sqrt(numel(colormapset)));
n2=ceil(numel(colormapset)/n1);

cFigure;

for q=1:1:numel(colormapset)

    h=subplot(n1,n2,q); hold on;
    title(colormapset{q},'FontSize',fontSize);
    imagesc(Z);
    colormap(h,colormapset{q}); colorbar;
    axis tight; axis equal; axis xy; box on;
    axis off;
    set(h,'FontSize',fontSize);
    clim(colorLim);
end
drawnow;

GIBBON www.gibboncode.org
Kevin Mattheus Moerman, [email protected]
GIBBON footer text
License: https://github.com/gibbonCode/GIBBON/blob/master/LICENSE
GIBBON: The Geometry and Image-based Bioengineering add-On. A toolbox for image segmentation, image-based modeling, meshing, and finite element analysis.
Copyright (C) 2006-2022 Kevin Mattheus Moerman and the GIBBON contributors
This program is free software: you can redistribute it and/or modify it under the terms of the GNU General Public License as published by the Free Software Foundation, either version 3 of the License, or (at your option) any later version.
This program is distributed in the hope that it will be useful, but WITHOUT ANY WARRANTY; without even the implied warranty of MERCHANTABILITY or FITNESS FOR A PARTICULAR PURPOSE. See the GNU General Public License for more details.
You should have received a copy of the GNU General Public License along with this program. If not, see http://www.gnu.org/licenses/.